| Param | Original file | Final file |
|---|---|---|
| Filename | modeM0/AS1G08_006T04_9000001812_12261cztM0_level2.evt | modeM0/AS1G08_006T04_9000001812_12261cztM0_level2_quad_clean.evt |
| Size (bytes) | 353,197,440 | 67,222,080 |
| Size | 336.8 MB | 64.1 MB |
| Events in quadrant A | 4,430,777 | 419,500 |
| Events in quadrant B | 2,575,572 | 448,522 |
| Events in quadrant C | 1,623,975 | 464,162 |
| Events in quadrant D | 1,822,298 | 449,548 |
| Mode M0 | |||
|---|---|---|---|
| Quadrant | BADHDUFLAG | Total packets | Discarded packets |
| A | 0 | 15709 | 0 |
| B | 0 | 9964 | 0 |
| C | 0 | 7415 | 0 |
| D | 0 | 7971 | 0 |
| Mode SS | |||
|---|---|---|---|
| Quadrant | BADHDUFLAG | Total packets | Discarded packets |
| A | 0 | 72 | 0 |
| B | 0 | 72 | 0 |
| C | 0 | 72 | 0 |
| D | 0 | 72 | 0 |
| Quadrant | Total seconds | Saturated seconds | Saturation percentage |
|---|---|---|---|
| A | 3577 | 712 | 19.904948% |
| B | 3577 | 286 | 7.995527% |
| C | 3577 | 11 | 0.307520% |
| D | 3577 | 37 | 1.034386% |
Noise dominated data is calculated using 1-second bins in cleaned event files. If a bin has >2000 counts, and if more than 50% of those come from <1% of pixels, then it is considered to be noise-dominated and hence unusable.
| Quadrant | # 1 sec bins | Bins with >0 counts | Bins with >2000 counts | High rate bins dominated by noise | Noise dominated (total time) | Noise dominated (detector-on time) | Marked lightcurve |
|---|---|---|---|---|---|---|---|
| A | 3578 | 3578 | 598 | 598 | 16.71% | 16.71% | 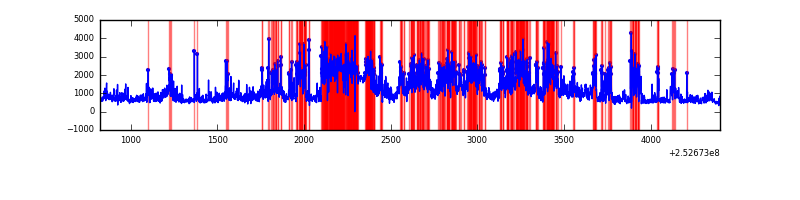 |
| B | 3578 | 3578 | 172 | 172 | 4.81% | 4.81% | 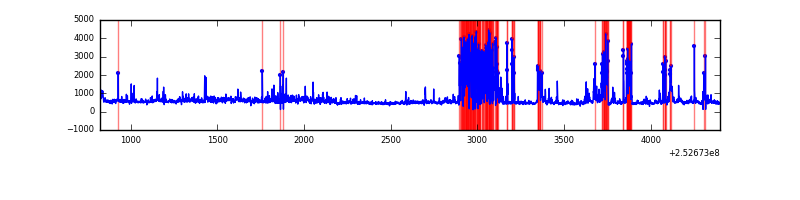 |
| C | 3578 | 3578 | 4 | 4 | 0.11% | 0.11% | 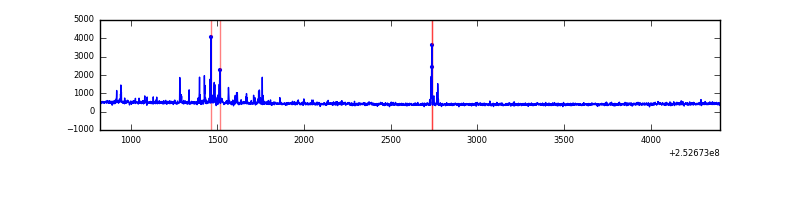 |
| D | 3578 | 3578 | 27 | 27 | 0.75% | 0.75% | 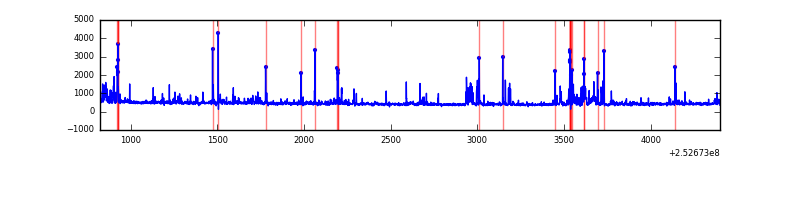 |
Top three noisy pixels from each quadrant. If the there are fewer than three noisy pixels in the level2.evt file, extra rows are filled as -1
| Pixel properties | Quadrant properties | ||||||
|---|---|---|---|---|---|---|---|
| Quadrant | DetID | PixID | Counts | Sigma | Mean | Median | Sigma |
| A | 14 | 237 | 1161094 | 15032.22 | 375 | 369 | 77.2 |
| A | 8 | 15 | 846850 | 10962.54 | 375 | 369 | 77.2 |
| A | 13 | 251 | 762339 | 9868.06 | 375 | 369 | 77.2 |
| B | 4 | 239 | 730290 | 9895.6 | 389 | 382 | 73.8 |
| B | 11 | 51 | 145497 | 1967.37 | 389 | 382 | 73.8 |
| B | 4 | 206 | 105841 | 1429.74 | 389 | 382 | 73.8 |
| C | 15 | 208 | 74884 | 832.69 | 385 | 388 | 89.5 |
| C | 0 | 207 | 20239 | 221.89 | 385 | 388 | 89.5 |
| C | 4 | 175 | 19254 | 210.88 | 385 | 388 | 89.5 |
| D | 10 | 199 | 137887 | 1492.02 | 386 | 374 | 92.2 |
| D | 1 | 52 | 63403 | 683.87 | 386 | 374 | 92.2 |
| D | 13 | 104 | 50407 | 542.86 | 386 | 374 | 92.2 |
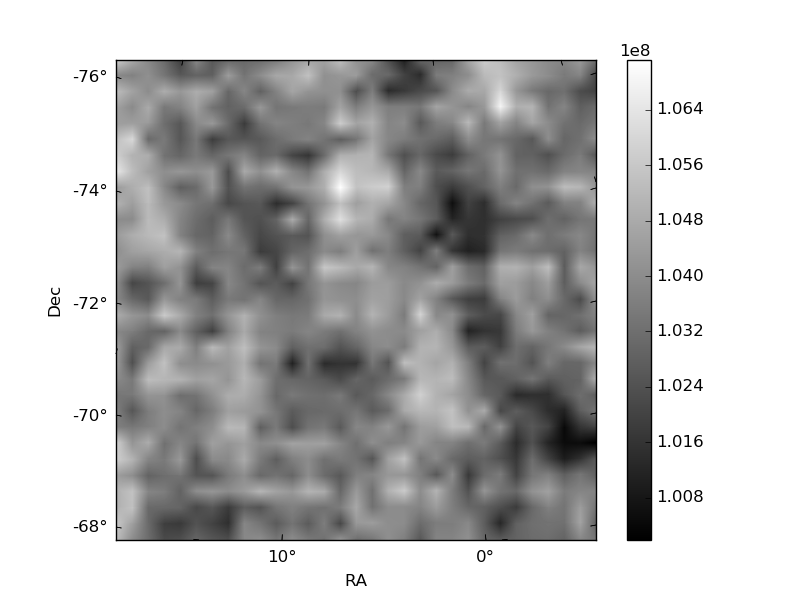
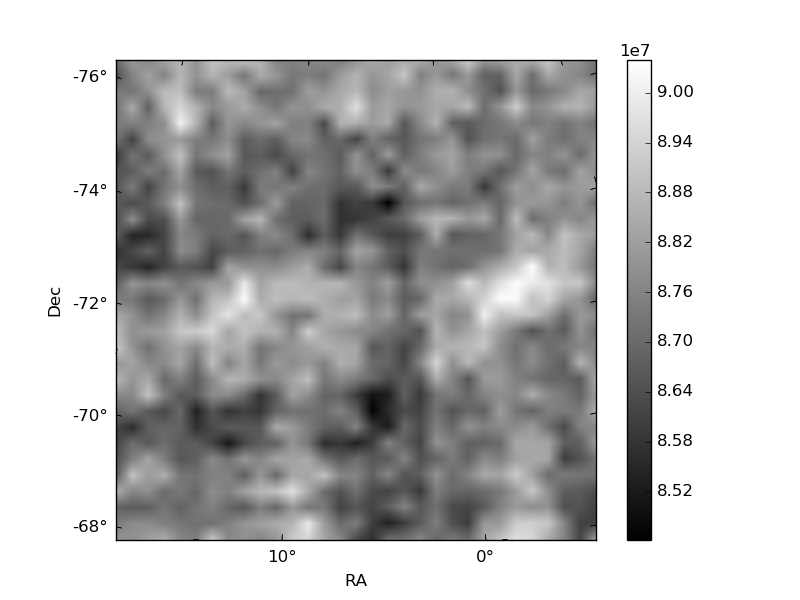
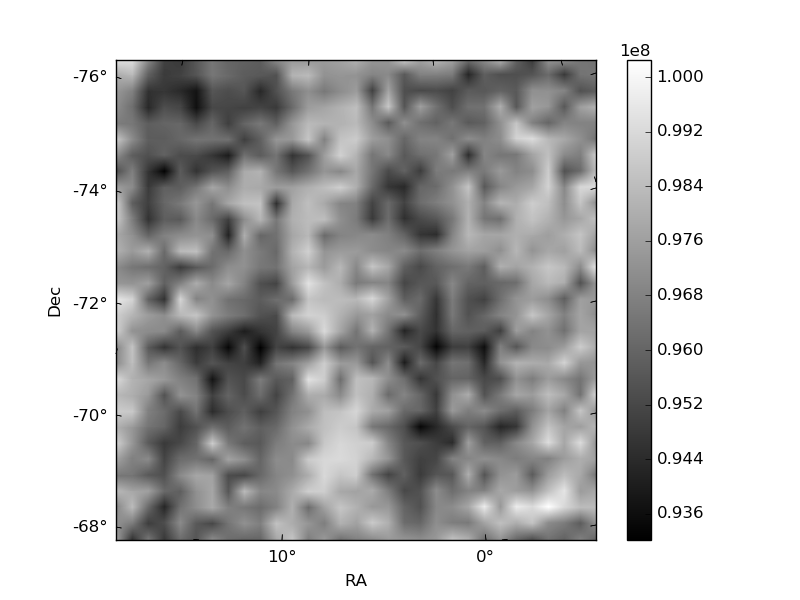
Histogram calculated using DETX and DETY for each event in the final _common_clean file
| Quadrant A | 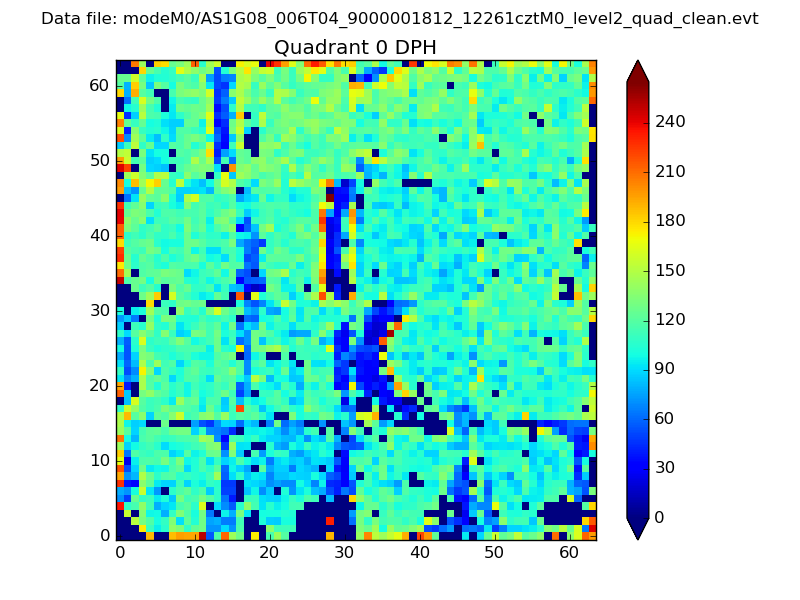 |
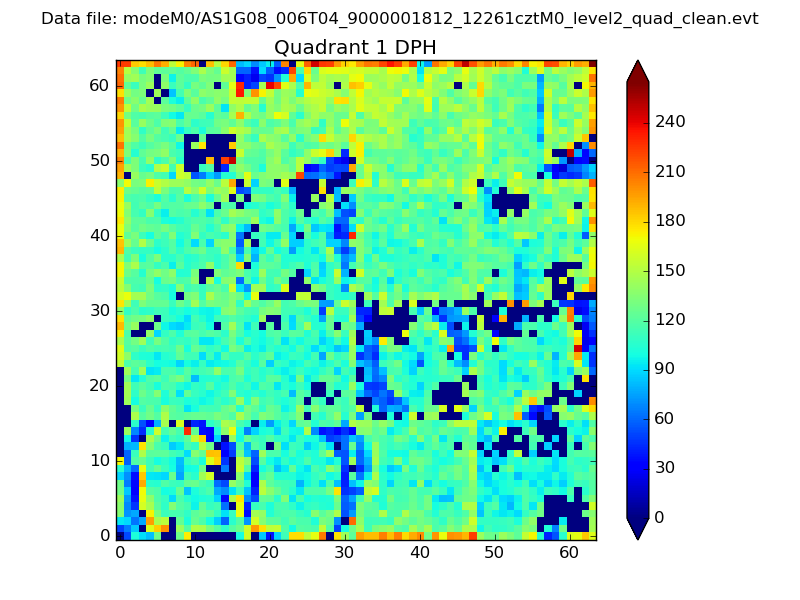 |
Quadrant B |
|---|---|---|---|
| Quadrant D | 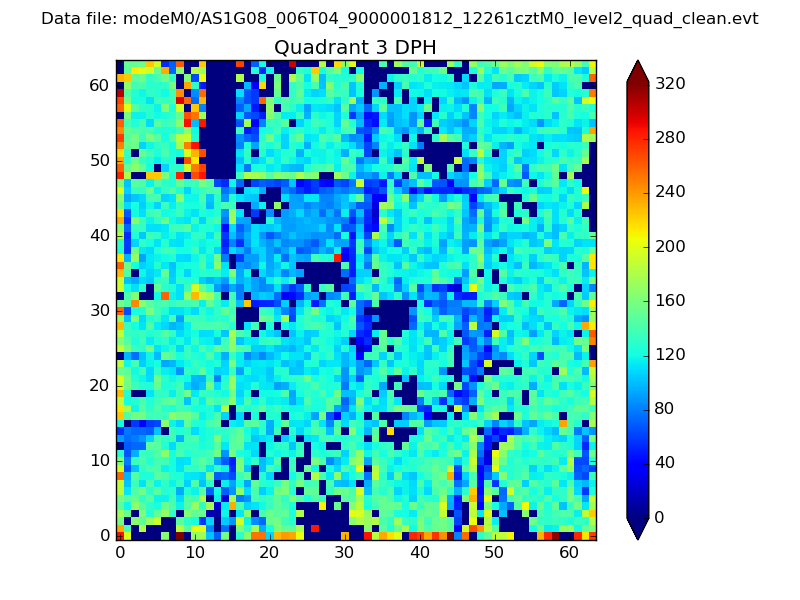 |
 |
Quadrant C |
| Plot type | Count rate plots | Images |
|---|---|---|
| Comparison with Poisson distribution Blue bars denote a histogram of data divided into 1 sec bins. Red curve is a Poisson curve with rate = median count rate of data. |
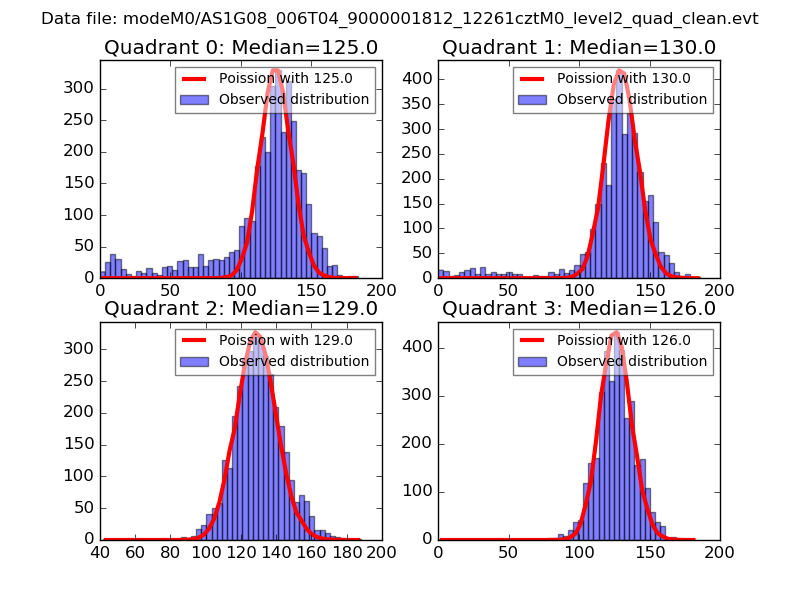 |
 |
| Quadrant-wise count rates Data is divided into 100 sec bins |
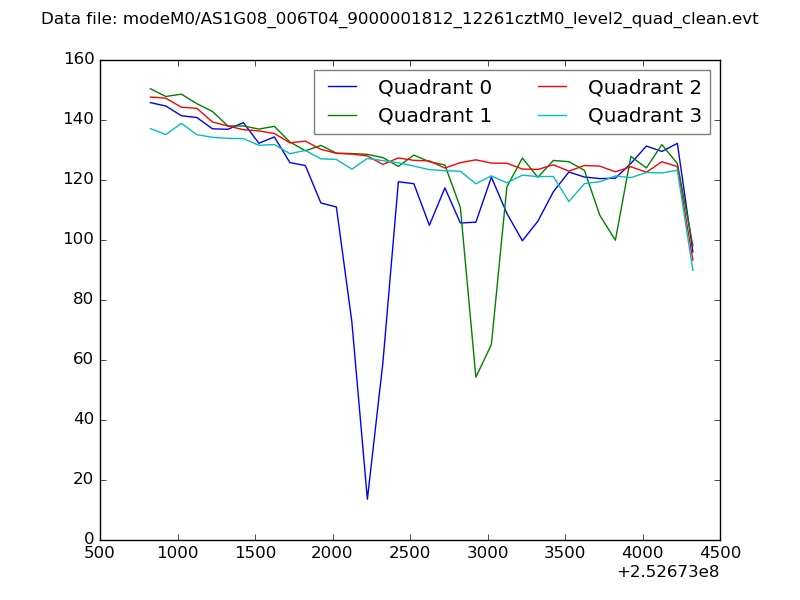 |
|
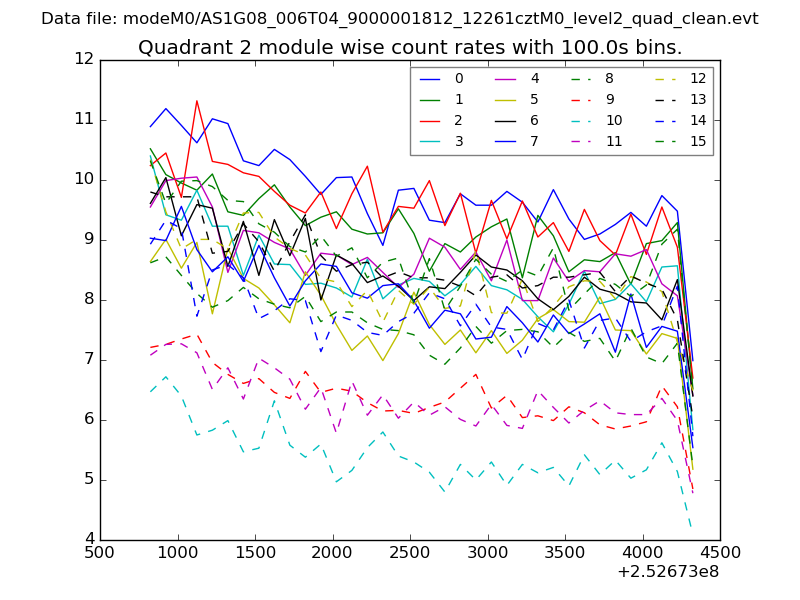
| Module-wise count rates for Quadrant A Data is divided into 100 sec bins |
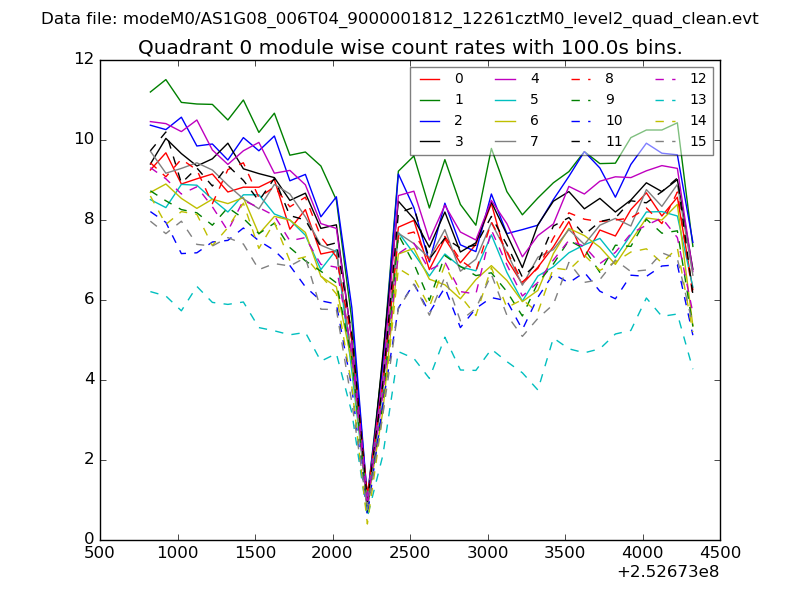 |
 |
| Module-wise count rates for Quadrant B Data is divided into 100 sec bins |
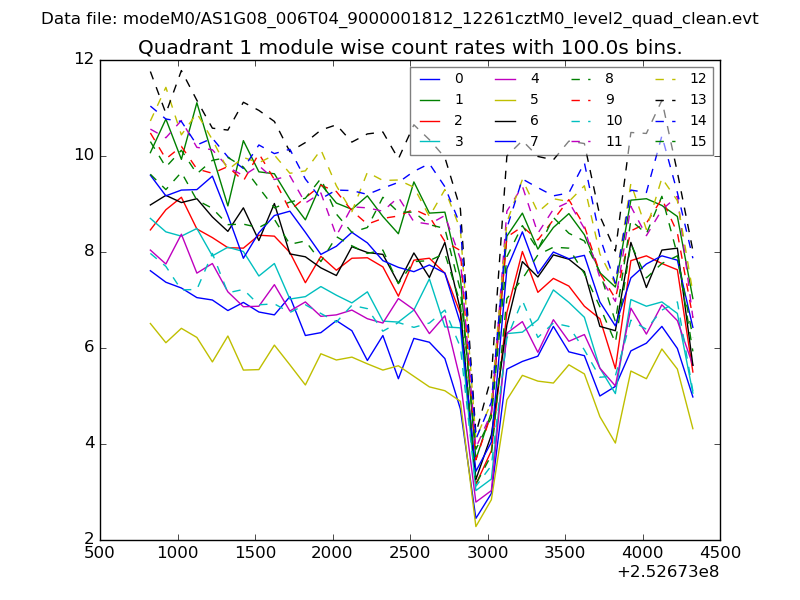 |
 |
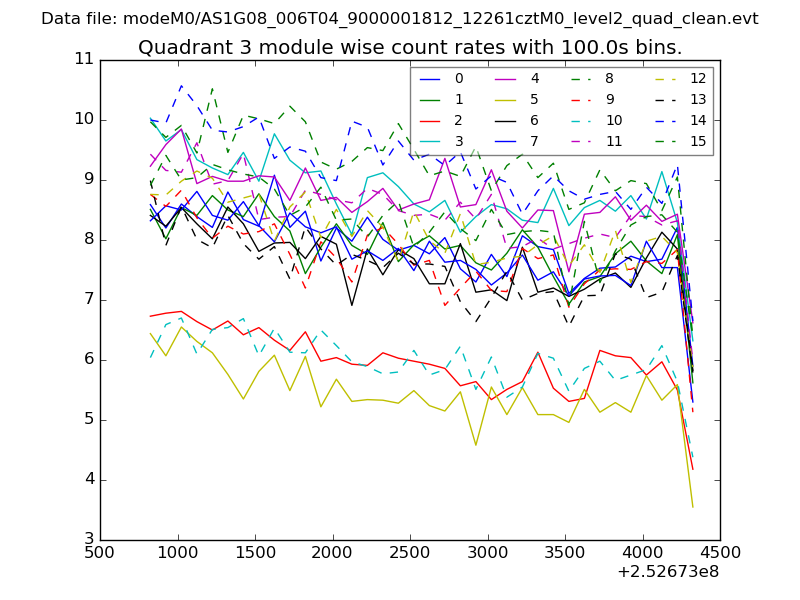
| Module-wise count rates for Quadrant C Data is divided into 100 sec bins |
 |
 |
| Module-wise count rates for Quadrant D Data is divided into 100 sec bins |
 |
 |
| Parameter | Plot |
|---|---|
| CZT HV Monitor | 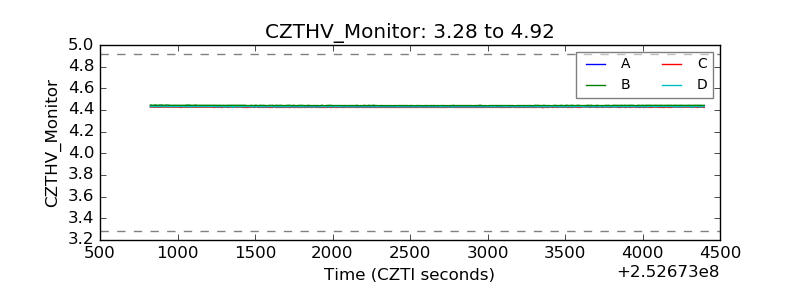 |
| D_VDD | 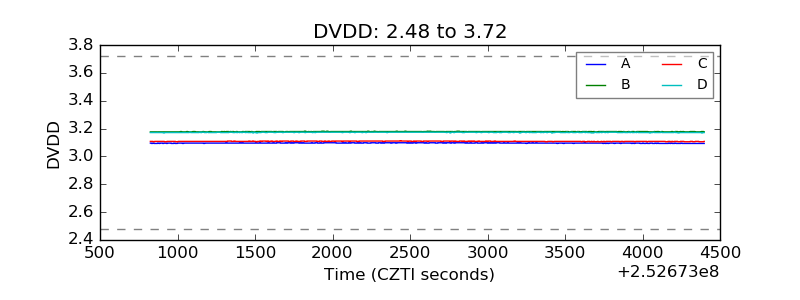 |
| Temperature 1 | 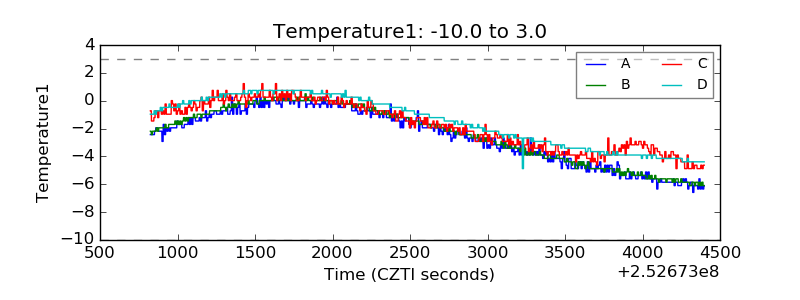 |
| Veto HV Monitor | 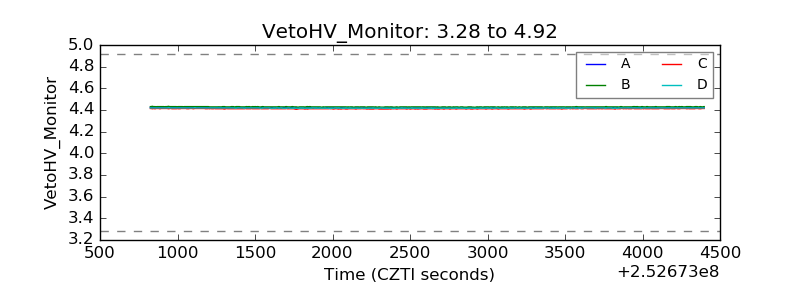 |
| Veto LLD | 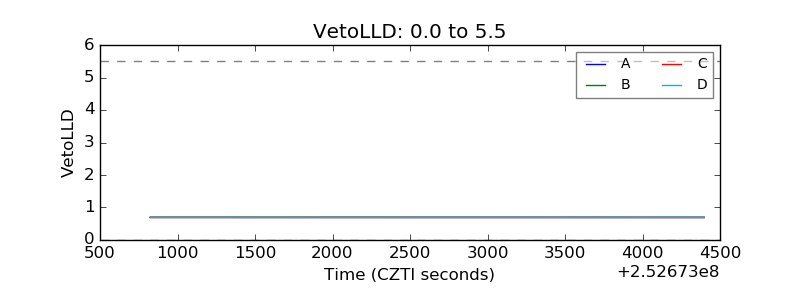 |
| Alpha Counter | 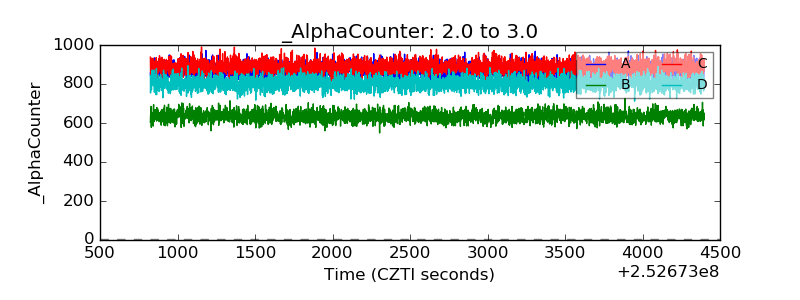 |
| _CPM_Rate | 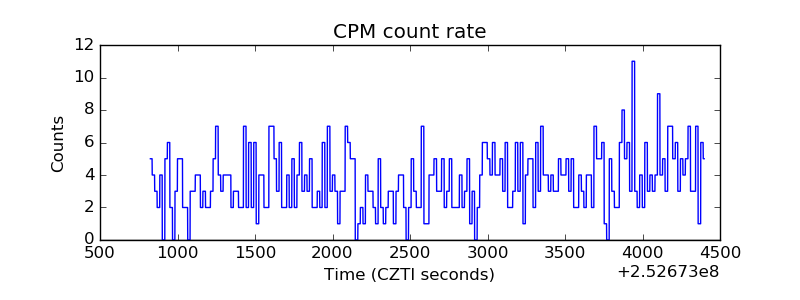 |
| CZT Counter | 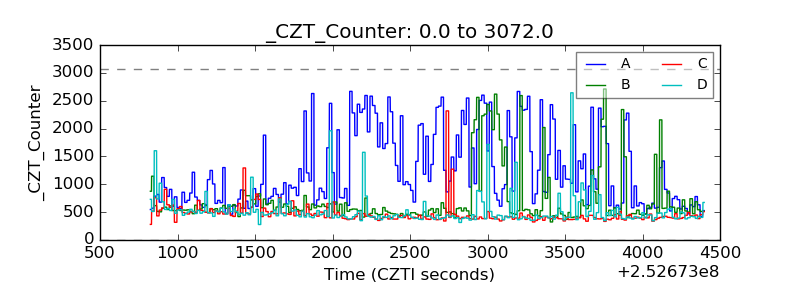 |
| +2.5 Volts monitor |  |
| +5 Volts monitor |  |
| _ROLL_ROT | 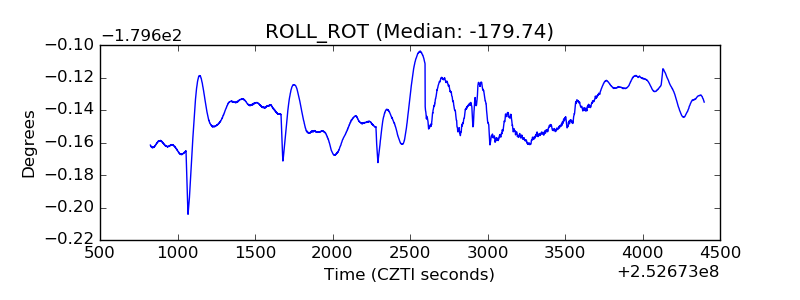 |
| _Roll_DEC | 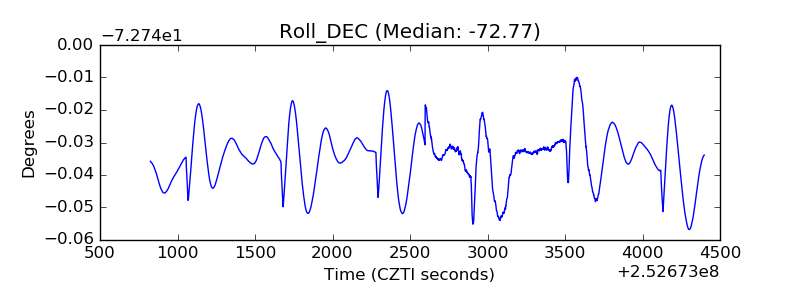 |
| _Roll_RA | 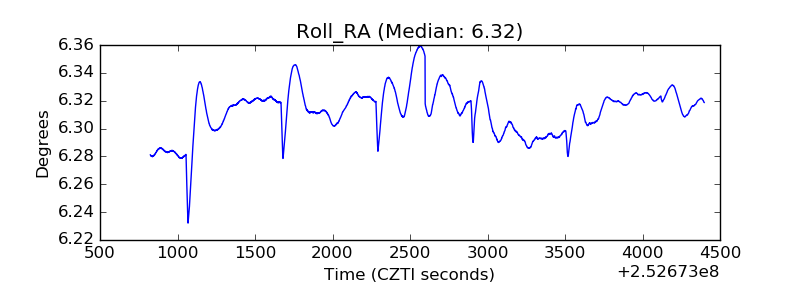 |
| Veto Counter | 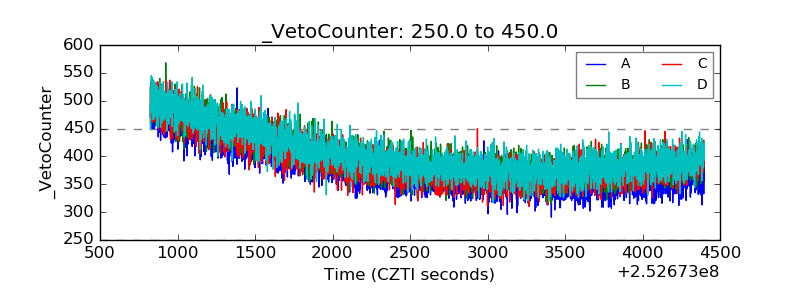 |