| Param | Original file | Final file |
|---|---|---|
| Filename | modeM0/AS1G08_064T01_9000001814_12261cztM0_level2.evt | modeM0/AS1G08_064T01_9000001814_12261cztM0_level2_quad_clean.evt |
| Size (bytes) | 173,761,920 | 12,715,200 |
| Size | 165.7 MB | 12.1 MB |
| Events in quadrant A | 2,168,314 | 64,304 |
| Events in quadrant B | 1,112,521 | 67,791 |
| Events in quadrant C | 821,687 | 68,715 |
| Events in quadrant D | 1,046,528 | 63,126 |
| Mode M9 | |||
|---|---|---|---|
| Quadrant | BADHDUFLAG | Total packets | Discarded packets |
| A | 0 | 7 | 0 |
| B | 0 | 7 | 0 |
| C | 0 | 7 | 0 |
| D | 0 | 7 | 0 |
| Mode SS | |||
|---|---|---|---|
| Quadrant | BADHDUFLAG | Total packets | Discarded packets |
| A | 0 | 32 | 0 |
| B | 0 | 32 | 0 |
| C | 0 | 32 | 0 |
| D | 0 | 32 | 0 |
| Mode M0 | |||
|---|---|---|---|
| Quadrant | BADHDUFLAG | Total packets | Discarded packets |
| A | 0 | 7587 | 2 |
| B | 0 | 4406 | 1 |
| C | 0 | 3409 | 1 |
| D | 0 | 4140 | 1 |
| Quadrant | Total seconds | Saturated seconds | Saturation percentage |
|---|---|---|---|
| A | 1637 | 452 | 27.611484% |
| B | 1637 | 67 | 4.092853% |
| C | 1637 | 11 | 0.671961% |
| D | 1637 | 54 | 3.298717% |
Noise dominated data is calculated using 1-second bins in cleaned event files. If a bin has >2000 counts, and if more than 50% of those come from <1% of pixels, then it is considered to be noise-dominated and hence unusable.
| Quadrant | # 1 sec bins | Bins with >0 counts | Bins with >2000 counts | High rate bins dominated by noise | Noise dominated (total time) | Noise dominated (detector-on time) | Marked lightcurve |
|---|---|---|---|---|---|---|---|
| A | 1638 | 1638 | 294 | 294 | 17.95% | 17.95% | 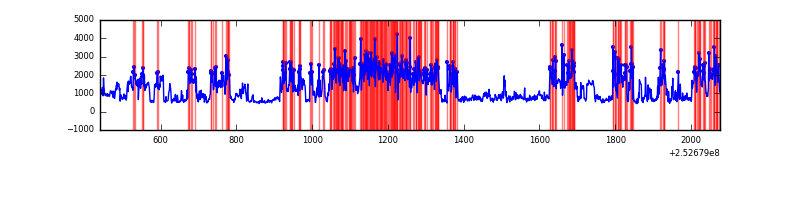 |
| B | 1638 | 1638 | 23 | 23 | 1.40% | 1.40% | 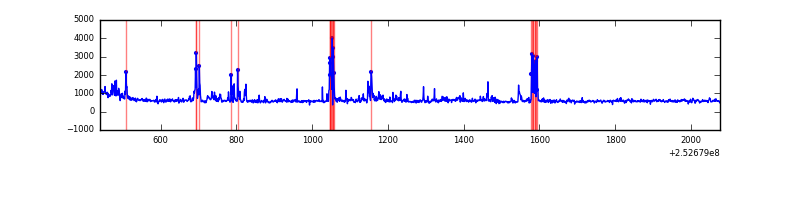 |
| C | 1638 | 1638 | 0 | 0 | 0.00% | 0.00% |  |
| D | 1638 | 1638 | 36 | 36 | 2.20% | 2.20% | 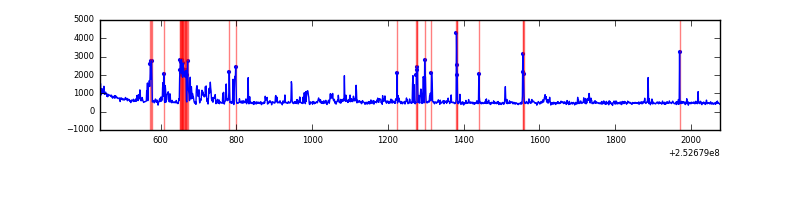 |
Top three noisy pixels from each quadrant. If the there are fewer than three noisy pixels in the level2.evt file, extra rows are filled as -1
| Pixel properties | Quadrant properties | ||||||
|---|---|---|---|---|---|---|---|
| Quadrant | DetID | PixID | Counts | Sigma | Mean | Median | Sigma |
| A | 8 | 15 | 858933 | 20300.22 | 199 | 195 | 42.3 |
| A | 14 | 237 | 324658 | 7670.17 | 199 | 195 | 42.3 |
| A | 13 | 251 | 108701 | 2565.04 | 199 | 195 | 42.3 |
| B | 4 | 239 | 115681 | 2733.31 | 212 | 207 | 42.2 |
| B | 4 | 206 | 72904 | 1720.76 | 212 | 207 | 42.2 |
| B | 3 | 64 | 34226 | 805.24 | 212 | 207 | 42.2 |
| C | 4 | 175 | 8280 | 164.52 | 207 | 208 | 49.1 |
| C | 0 | 207 | 1860 | 33.67 | 207 | 208 | 49.1 |
| C | 13 | 61 | 1606 | 28.49 | 207 | 208 | 49.1 |
| D | 1 | 52 | 187048 | 3632.68 | 207 | 201 | 51.4 |
| D | 10 | 199 | 32149 | 621.13 | 207 | 201 | 51.4 |
| D | 7 | 71 | 8826 | 167.69 | 207 | 201 | 51.4 |
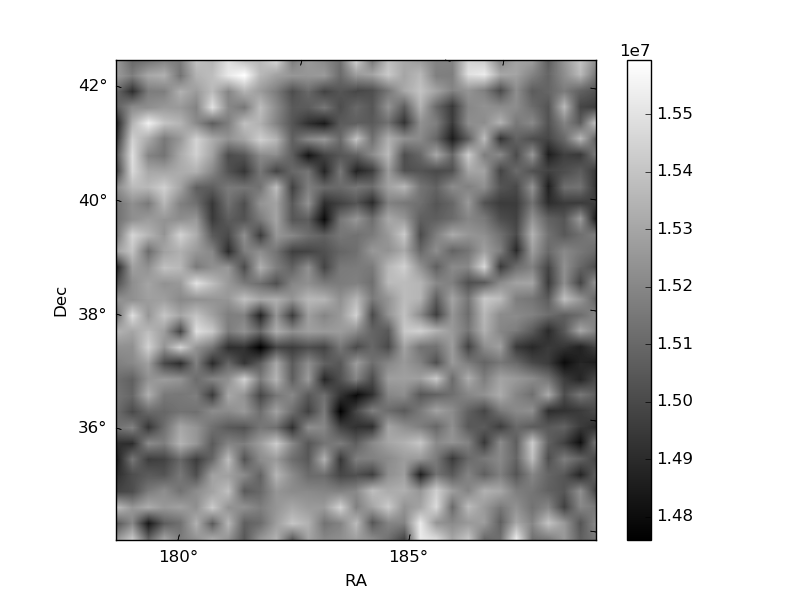
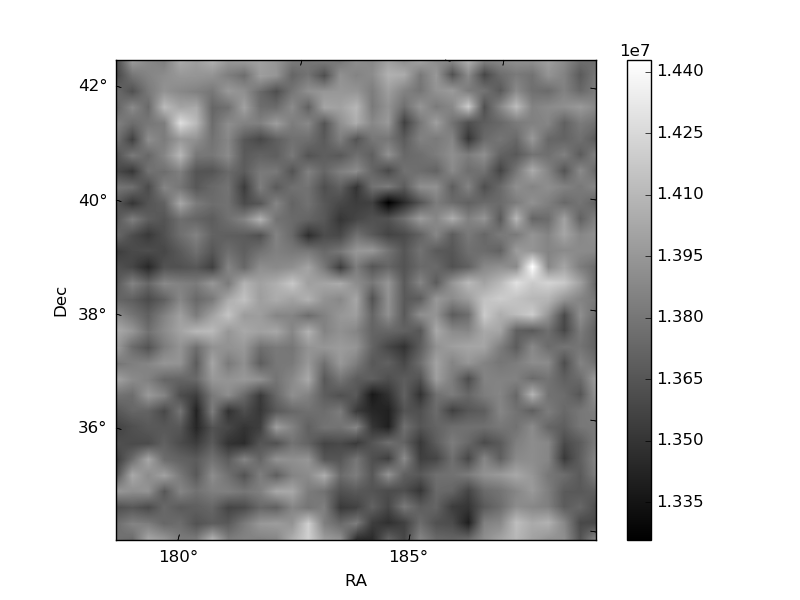
Histogram calculated using DETX and DETY for each event in the final _common_clean file
| Quadrant A | 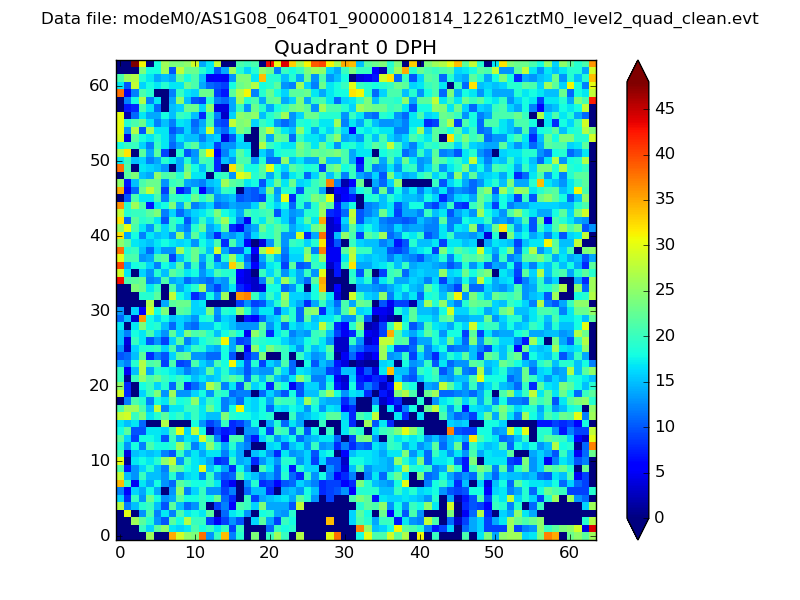 |
 |
Quadrant B |
|---|---|---|---|
| Quadrant D |  |
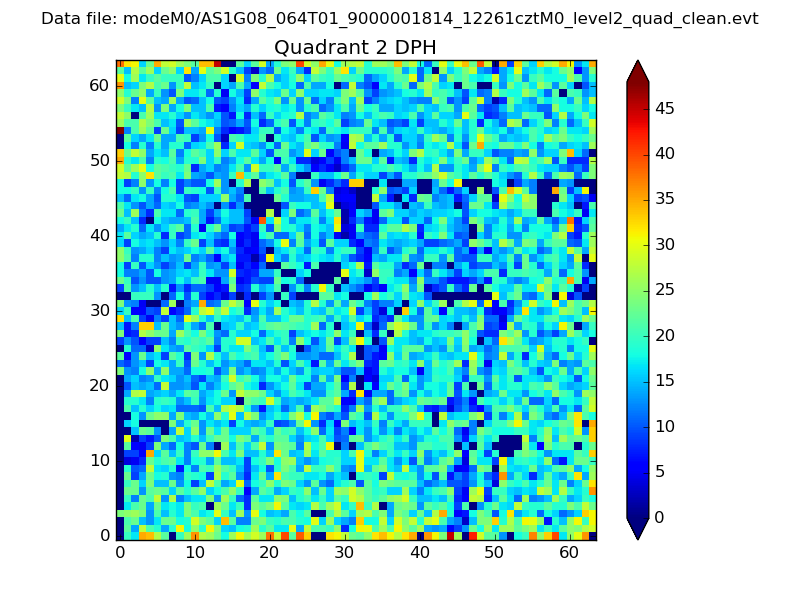 |
Quadrant C |
| Plot type | Count rate plots | Images |
|---|---|---|
| Comparison with Poisson distribution Blue bars denote a histogram of data divided into 1 sec bins. Red curve is a Poisson curve with rate = median count rate of data. |
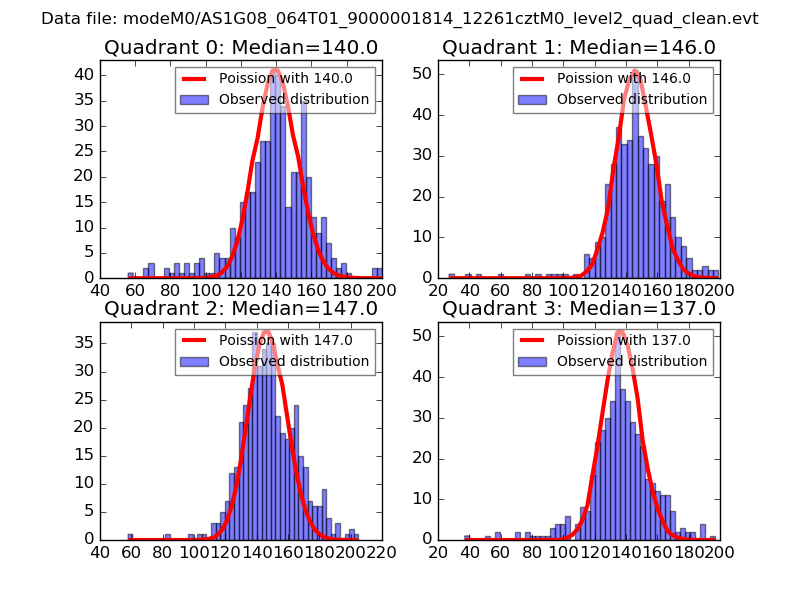 |
 |
| Quadrant-wise count rates Data is divided into 100 sec bins |
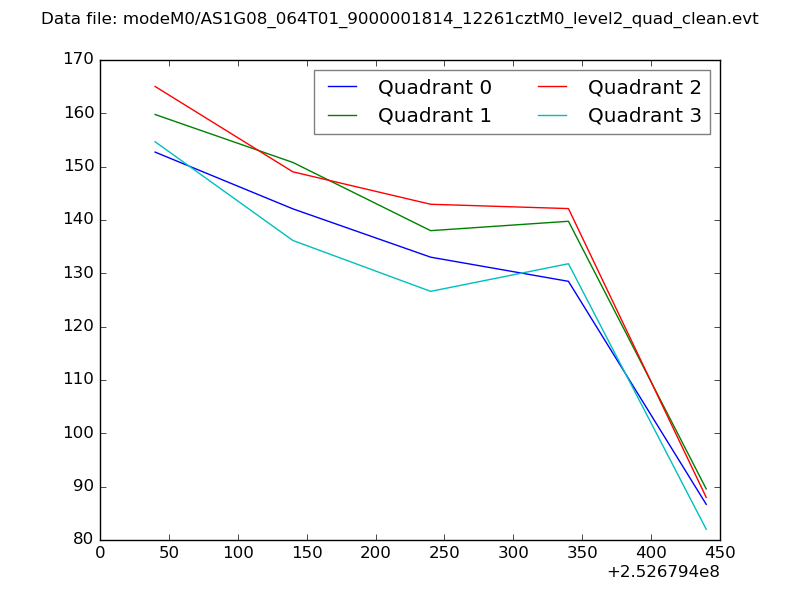 |
|
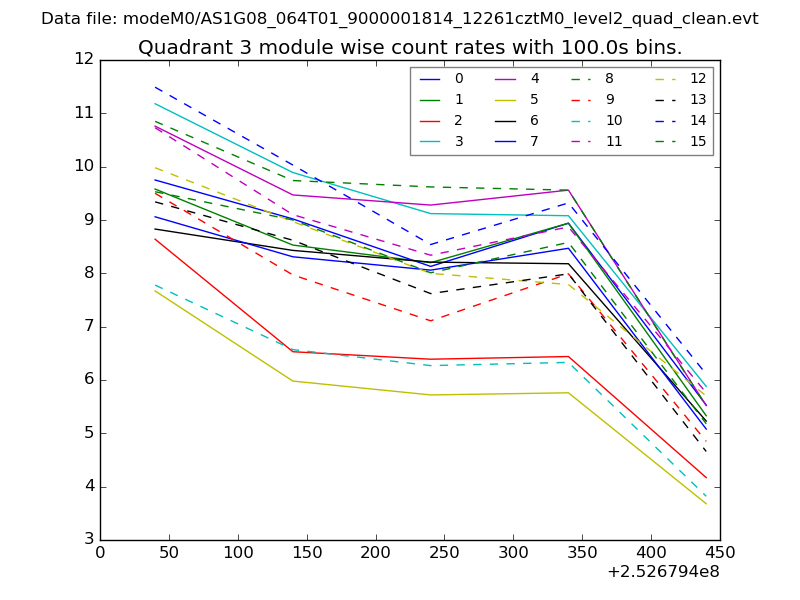
| Module-wise count rates for Quadrant A Data is divided into 100 sec bins |
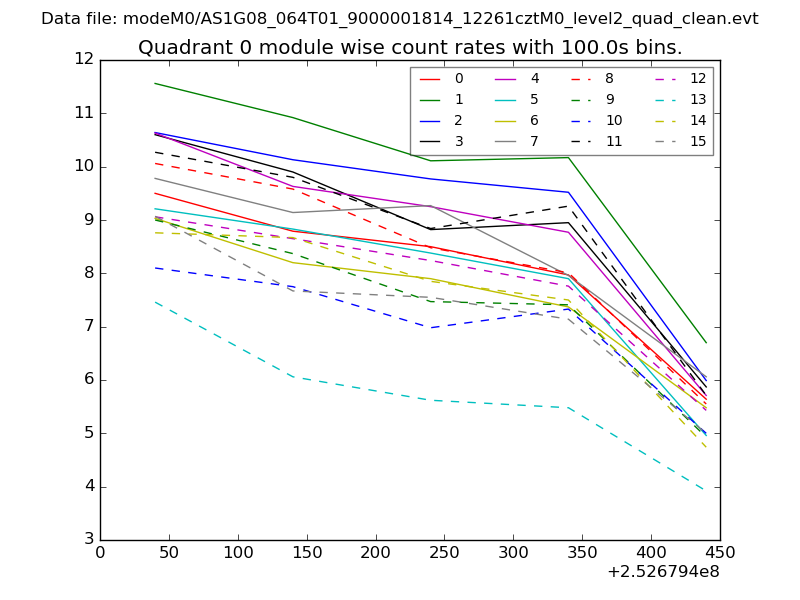 |
 |
| Module-wise count rates for Quadrant B Data is divided into 100 sec bins |
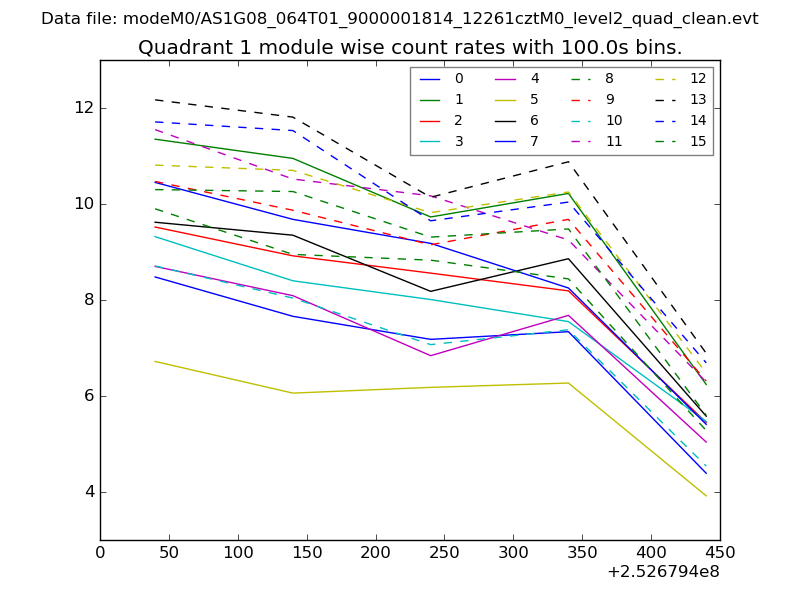 |
 |
| Module-wise count rates for Quadrant C Data is divided into 100 sec bins |
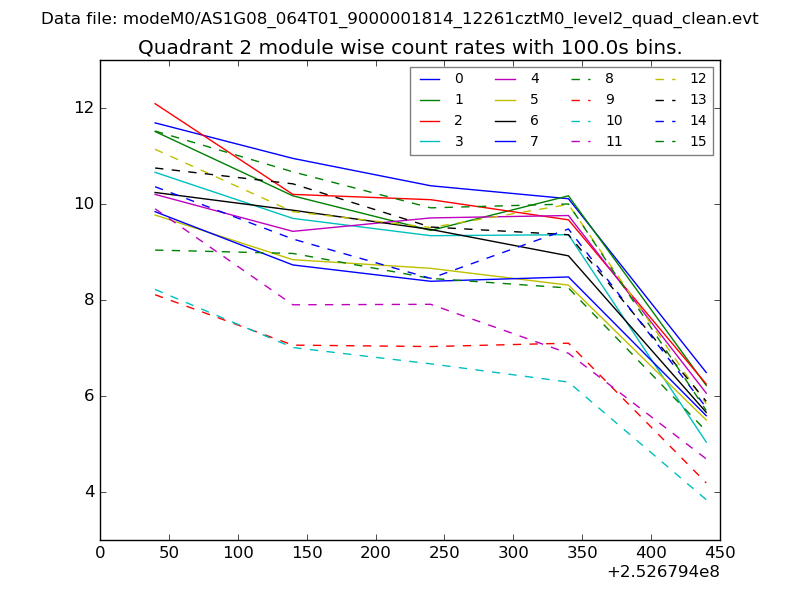 |
 |
| Module-wise count rates for Quadrant D Data is divided into 100 sec bins |
 |
 |
| Parameter | Plot |
|---|---|
| CZT HV Monitor | 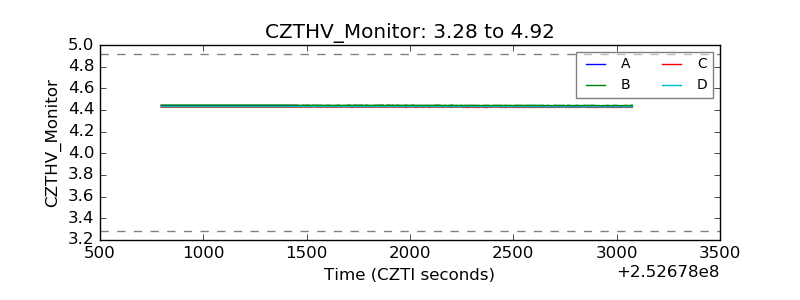 |
| D_VDD | 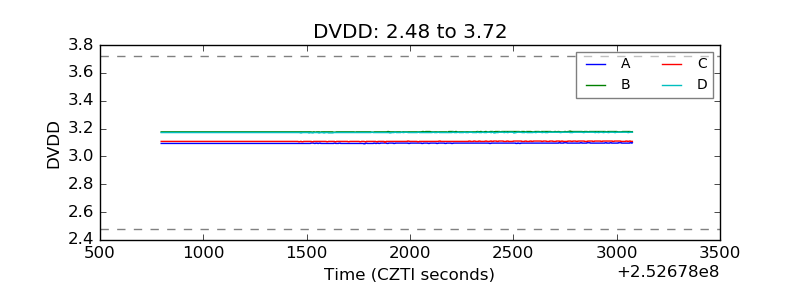 |
| Temperature 1 | 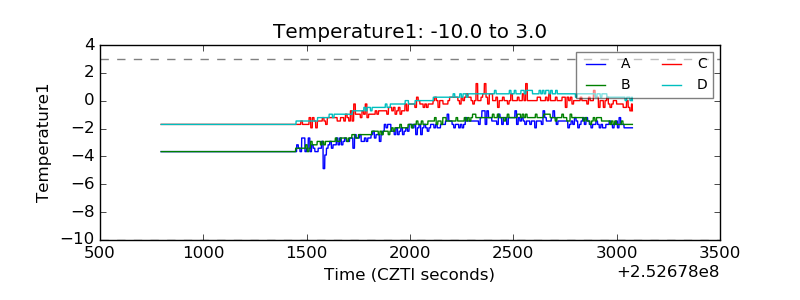 |
| Veto HV Monitor | 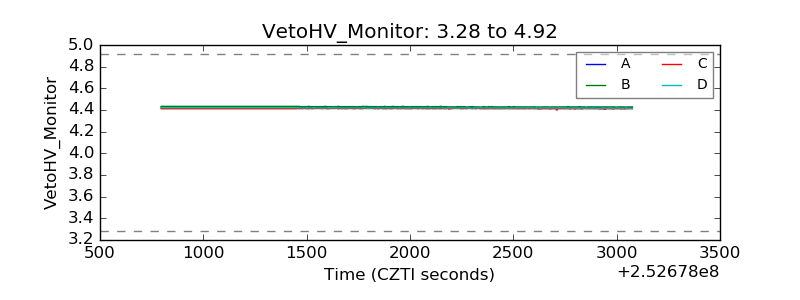 |
| Veto LLD | 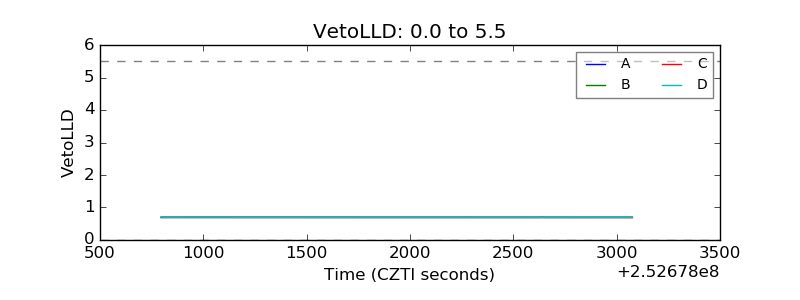 |
| Alpha Counter | 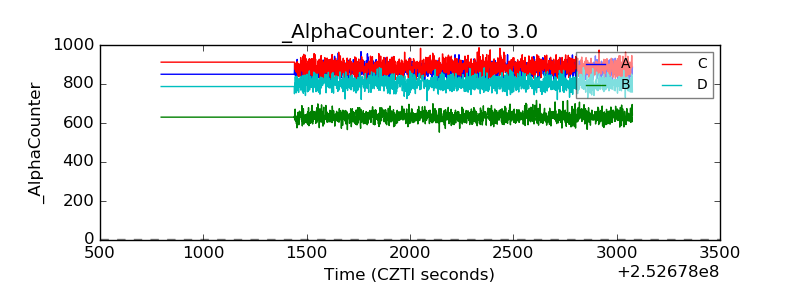 |
| _CPM_Rate | 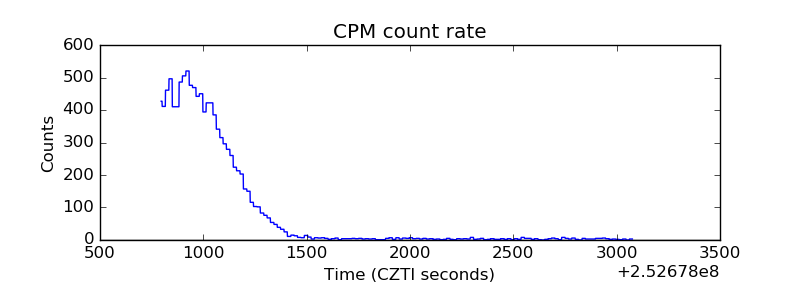 |
| CZT Counter | 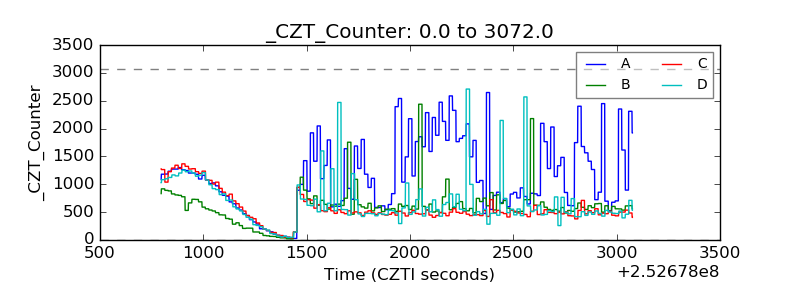 |
| +2.5 Volts monitor |  |
| +5 Volts monitor |  |
| _ROLL_ROT | 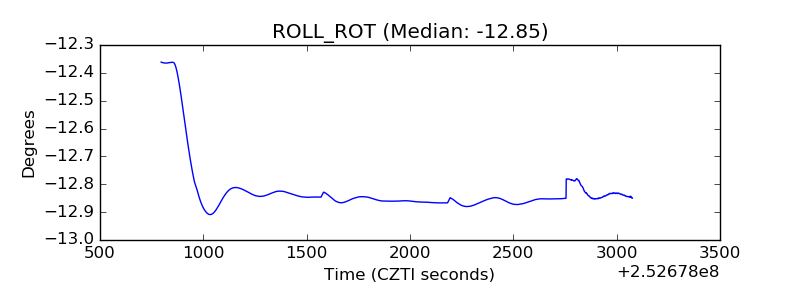 |
| _Roll_DEC | 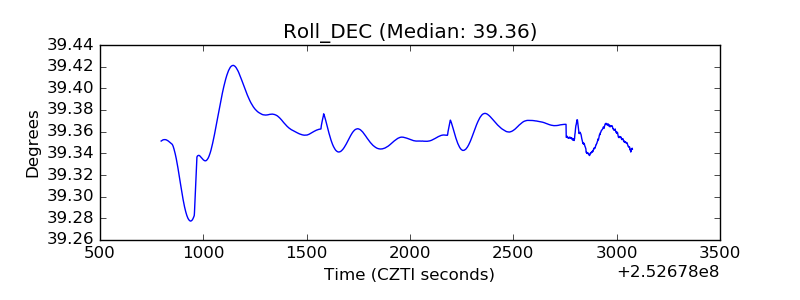 |
| _Roll_RA |  |
| Veto Counter | 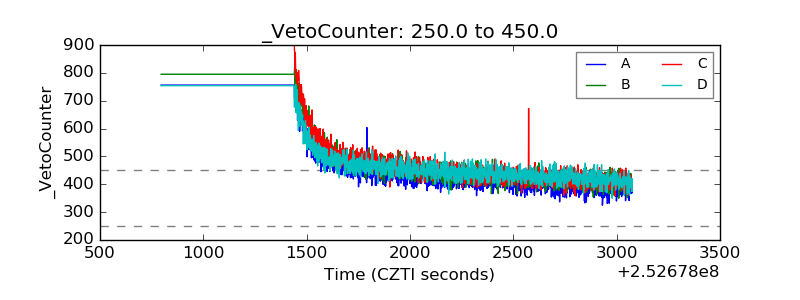 |