| Param | Original file | Final file |
|---|---|---|
| Filename | modeM0/AS1G08_064T01_9000001814_12262cztM0_level2.evt | modeM0/AS1G08_064T01_9000001814_12262cztM0_level2_quad_clean.evt |
| Size (bytes) | 690,819,840 | 68,921,280 |
| Size | 658.8 MB | 65.7 MB |
| Events in quadrant A | 7,836,367 | 382,463 |
| Events in quadrant B | 4,628,228 | 414,350 |
| Events in quadrant C | 3,220,563 | 422,494 |
| Events in quadrant D | 4,779,807 | 396,005 |
| Mode M9 | |||
|---|---|---|---|
| Quadrant | BADHDUFLAG | Total packets | Discarded packets |
| A | 0 | 8 | 0 |
| B | 0 | 8 | 0 |
| C | 0 | 8 | 0 |
| D | 0 | 8 | 0 |
| Mode SS | |||
|---|---|---|---|
| Quadrant | BADHDUFLAG | Total packets | Discarded packets |
| A | 0 | 138 | 0 |
| B | 0 | 138 | 0 |
| C | 0 | 138 | 0 |
| D | 0 | 138 | 0 |
| Mode M0 | |||
|---|---|---|---|
| Quadrant | BADHDUFLAG | Total packets | Discarded packets |
| A | 0 | 28016 | 2 |
| B | 0 | 18092 | 1 |
| C | 0 | 13971 | 1 |
| D | 0 | 18571 | 1 |
| Quadrant | Total seconds | Saturated seconds | Saturation percentage |
|---|---|---|---|
| A | 6754 | 1351 | 20.002961% |
| B | 6754 | 399 | 5.907610% |
| C | 6754 | 82 | 1.214095% |
| D | 6754 | 281 | 4.160497% |
Noise dominated data is calculated using 1-second bins in cleaned event files. If a bin has >2000 counts, and if more than 50% of those come from <1% of pixels, then it is considered to be noise-dominated and hence unusable.
| Quadrant | # 1 sec bins | Bins with >0 counts | Bins with >2000 counts | High rate bins dominated by noise | Noise dominated (total time) | Noise dominated (detector-on time) | Marked lightcurve |
|---|---|---|---|---|---|---|---|
| A | 7615 | 6756 | 900 | 900 | 11.82% | 13.32% | 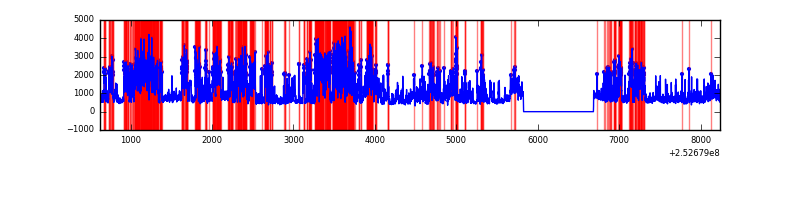 |
| B | 7615 | 6756 | 176 | 176 | 2.31% | 2.61% | 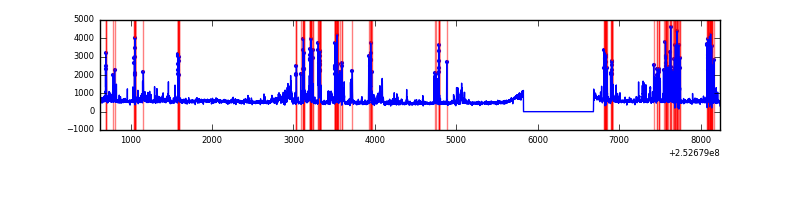 |
| C | 7615 | 6756 | 6 | 6 | 0.08% | 0.09% | 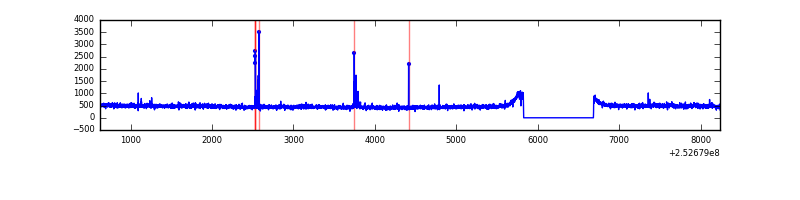 |
| D | 7615 | 6756 | 209 | 209 | 2.74% | 3.09% |  |
Top three noisy pixels from each quadrant. If the there are fewer than three noisy pixels in the level2.evt file, extra rows are filled as -1
| Pixel properties | Quadrant properties | ||||||
|---|---|---|---|---|---|---|---|
| Quadrant | DetID | PixID | Counts | Sigma | Mean | Median | Sigma |
| A | 8 | 15 | 2406112 | 15233.76 | 776 | 763 | 157.9 |
| A | 14 | 237 | 1220596 | 7725.55 | 776 | 763 | 157.9 |
| A | 13 | 251 | 771114 | 4878.85 | 776 | 763 | 157.9 |
| B | 4 | 239 | 947898 | 6218.86 | 807 | 789 | 152.3 |
| B | 4 | 206 | 243442 | 1593.3 | 807 | 789 | 152.3 |
| B | 3 | 64 | 92373 | 601.35 | 807 | 789 | 152.3 |
| C | 4 | 175 | 43780 | 233.01 | 800 | 804 | 184.4 |
| C | 15 | 208 | 26008 | 136.65 | 800 | 804 | 184.4 |
| C | 0 | 207 | 23737 | 124.34 | 800 | 804 | 184.4 |
| D | 12 | 221 | 988813 | 5142.59 | 794 | 770 | 192.1 |
| D | 1 | 52 | 447732 | 2326.36 | 794 | 770 | 192.1 |
| D | 10 | 199 | 123536 | 638.98 | 794 | 770 | 192.1 |
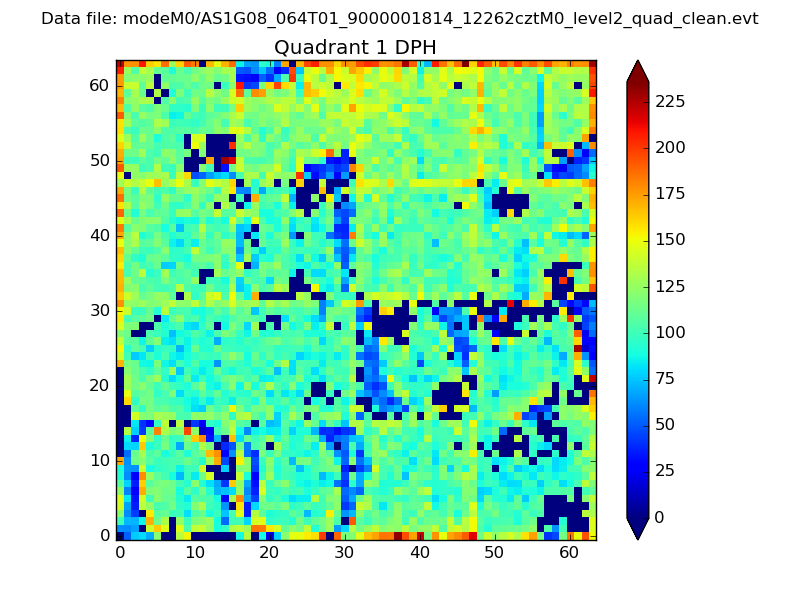
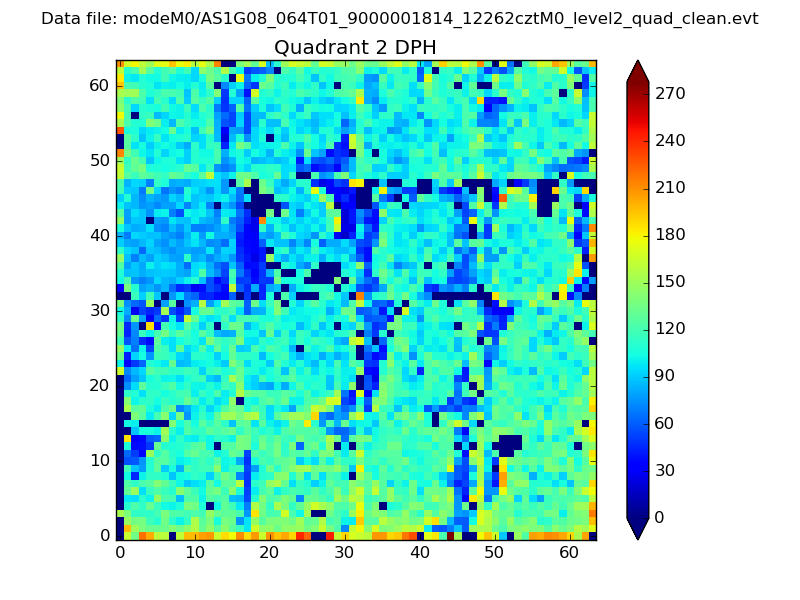
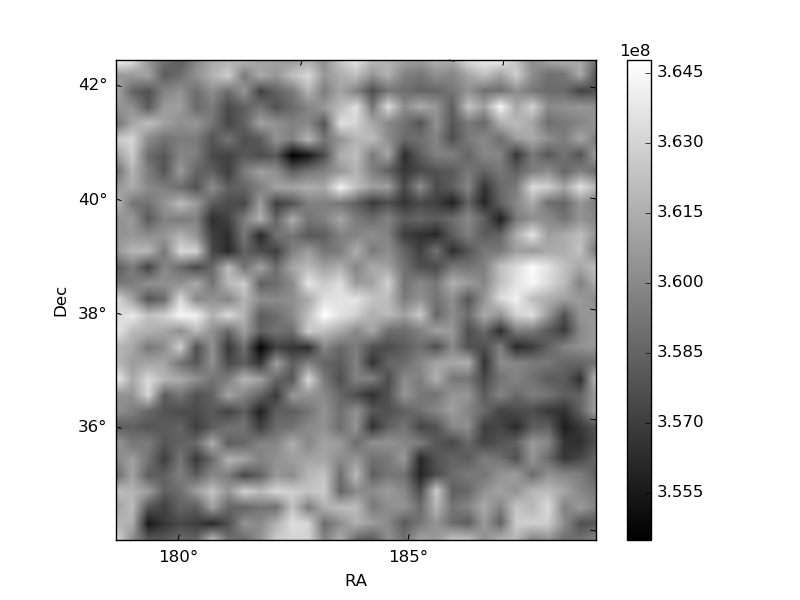
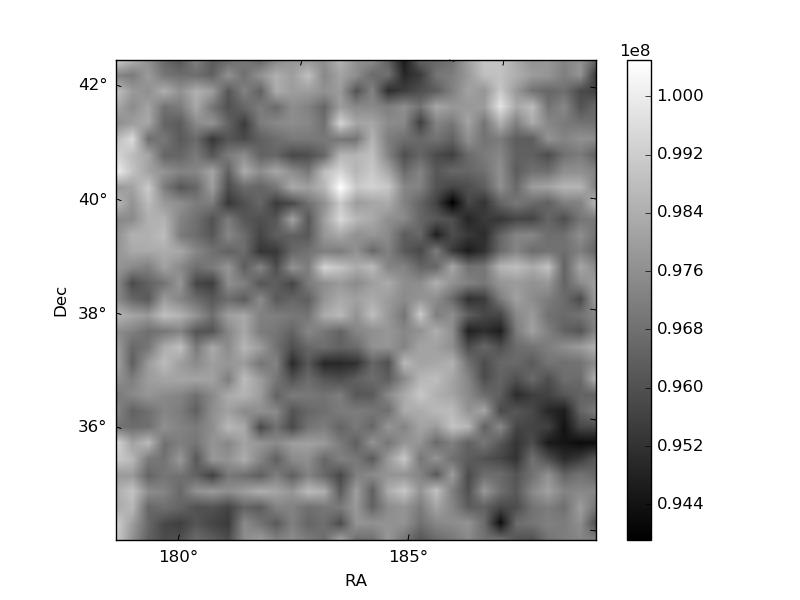
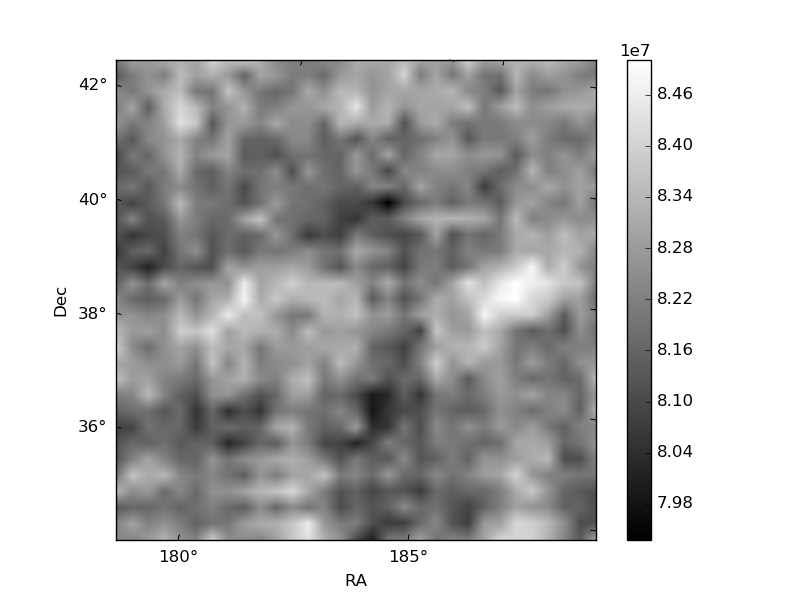
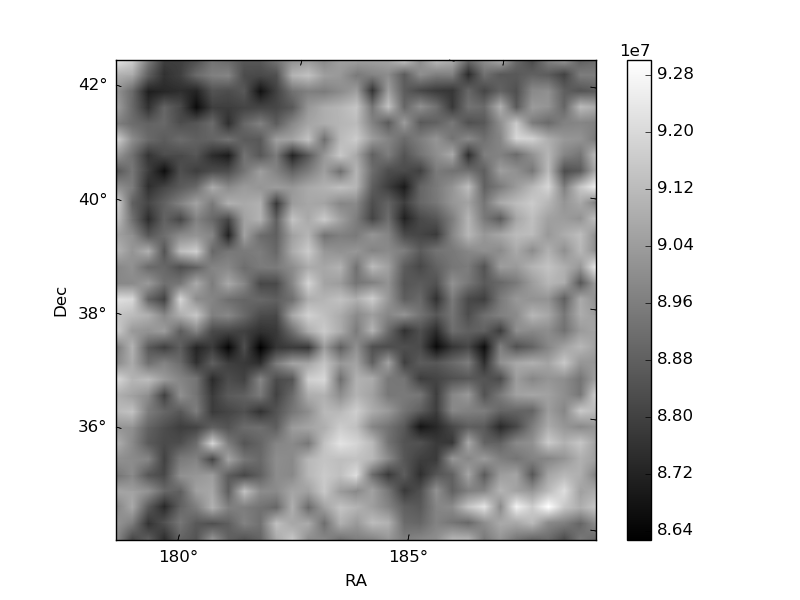
Histogram calculated using DETX and DETY for each event in the final _common_clean file
| Quadrant A | 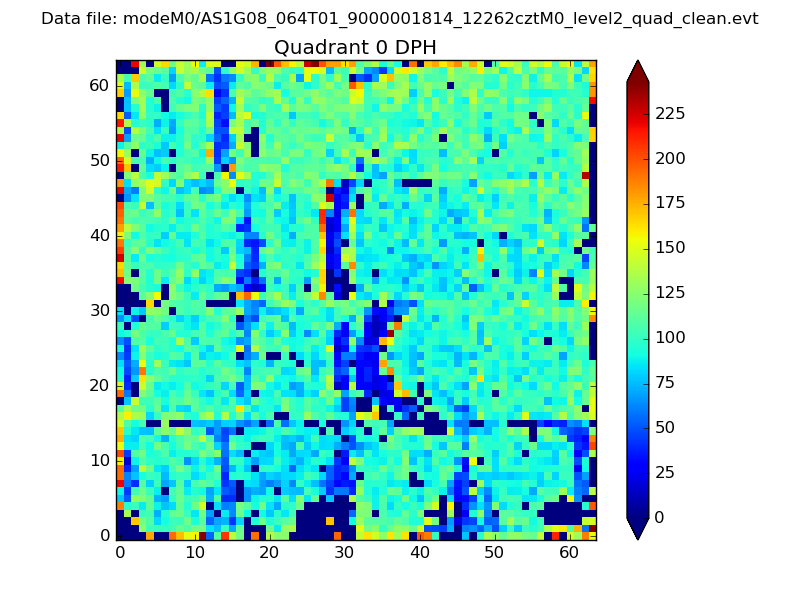 |
 |
Quadrant B |
|---|---|---|---|
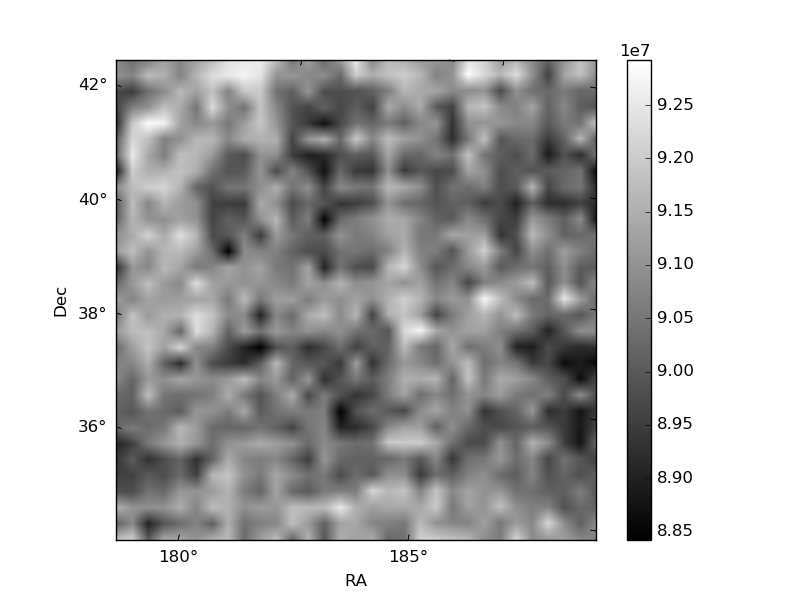
| Quadrant D | 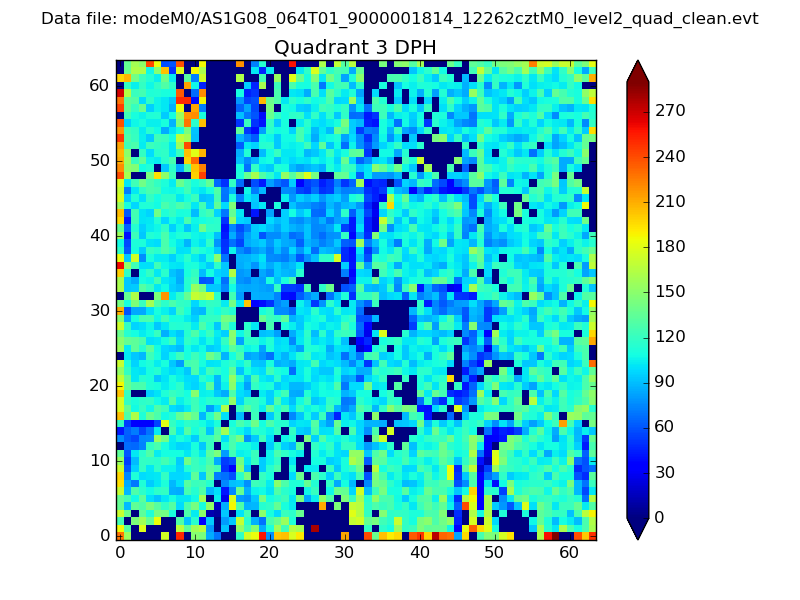 |
 |
Quadrant C |
| Plot type | Count rate plots | Images |
|---|---|---|
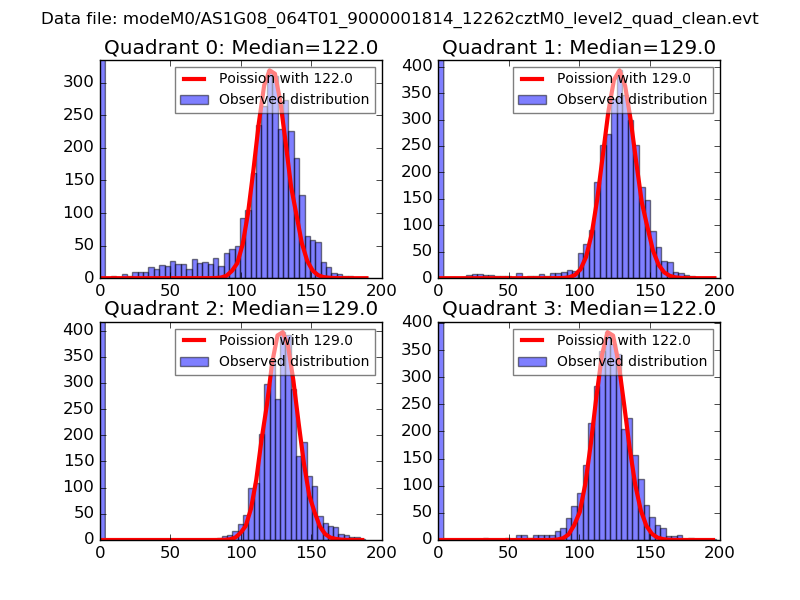
| Comparison with Poisson distribution Blue bars denote a histogram of data divided into 1 sec bins. Red curve is a Poisson curve with rate = median count rate of data. |
 |
 |
| Quadrant-wise count rates Data is divided into 100 sec bins |
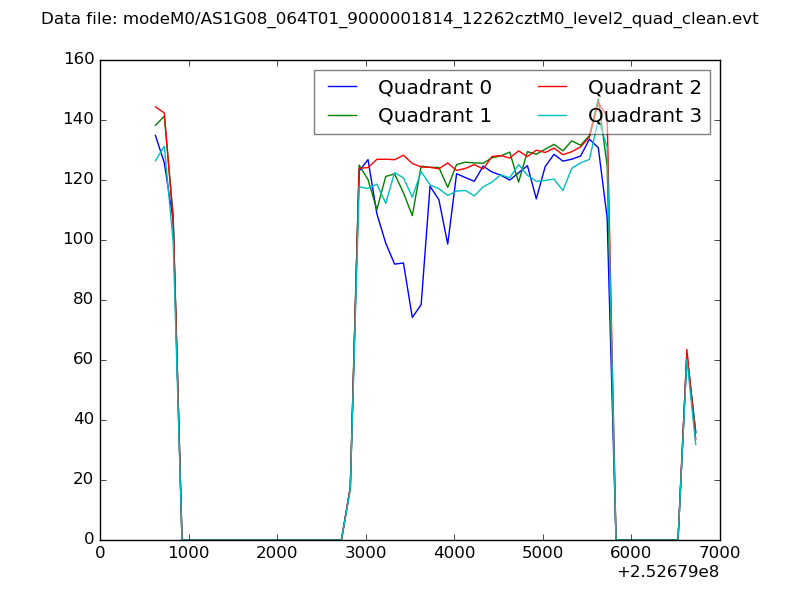 |
|
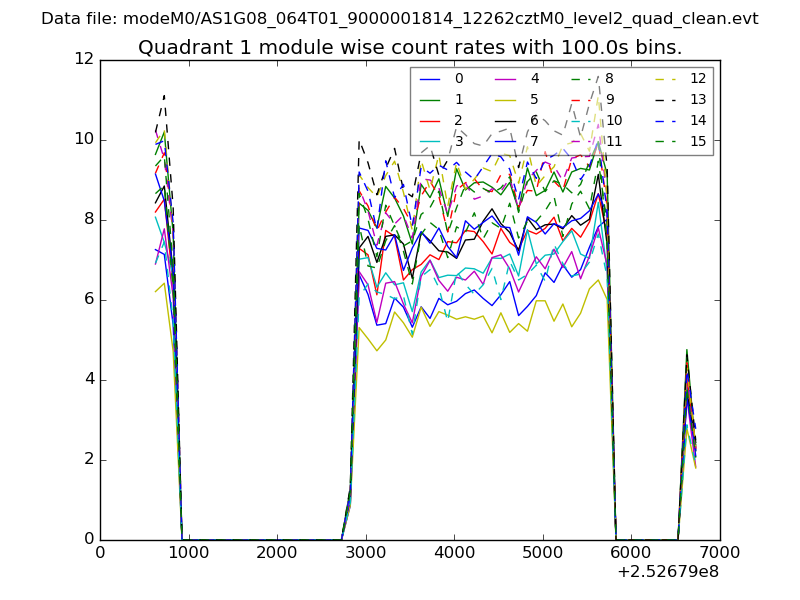
| Module-wise count rates for Quadrant A Data is divided into 100 sec bins |
 |
 |
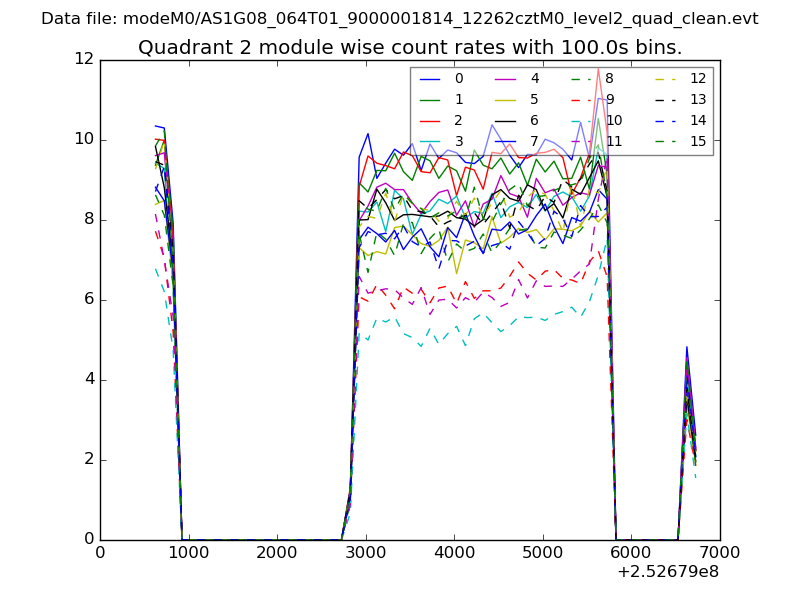
| Module-wise count rates for Quadrant B Data is divided into 100 sec bins |
 |
 |
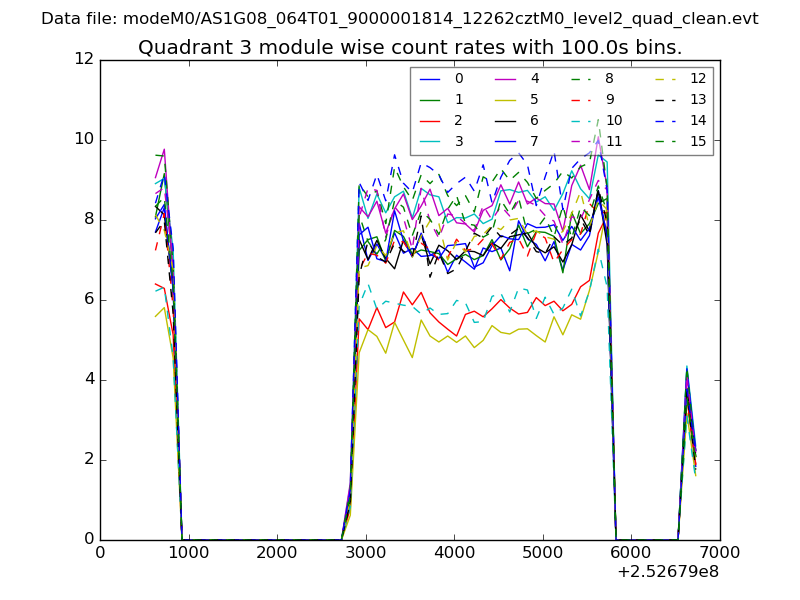
| Module-wise count rates for Quadrant C Data is divided into 100 sec bins |
 |
 |
| Module-wise count rates for Quadrant D Data is divided into 100 sec bins |
 |
 |
| Parameter | Plot |
|---|---|
| CZT HV Monitor | 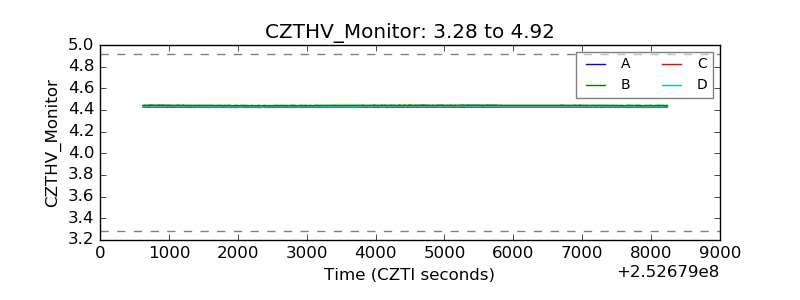 |
| D_VDD | 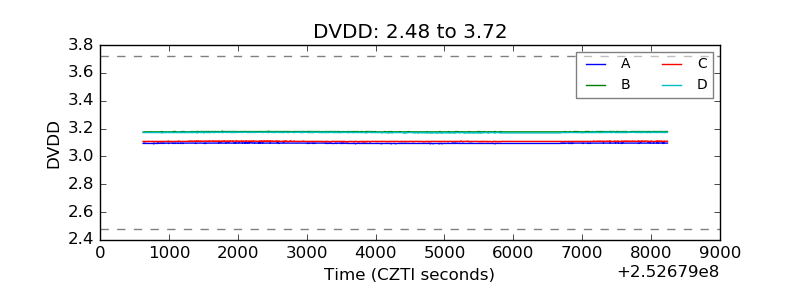 |
| Temperature 1 |  |
| Veto HV Monitor | 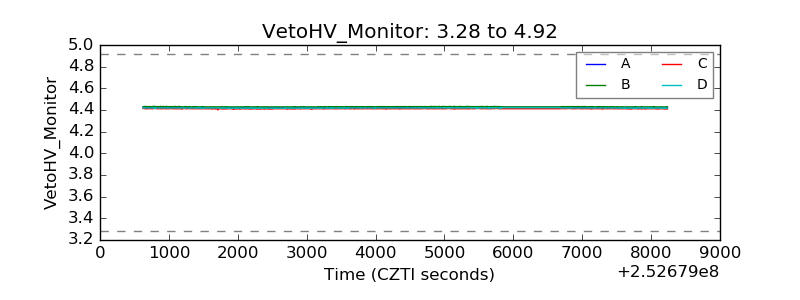 |
| Veto LLD | 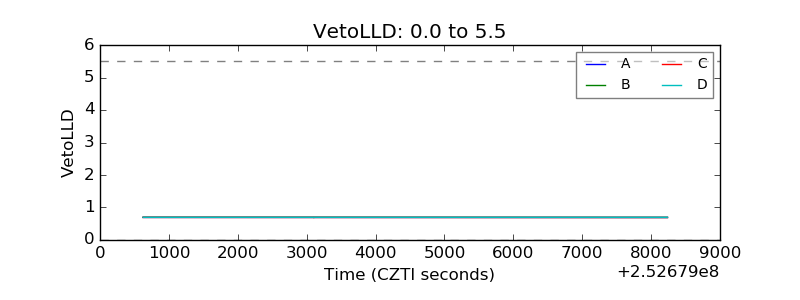 |
| Alpha Counter | 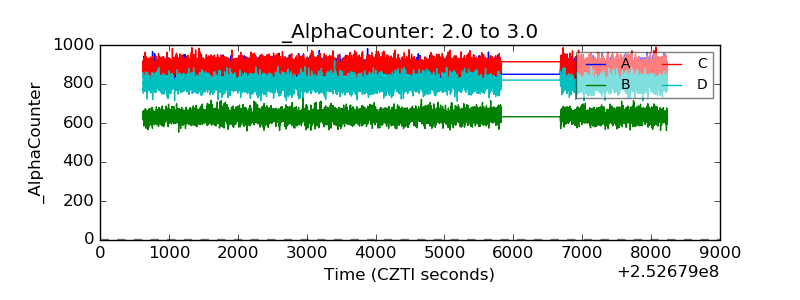 |
| _CPM_Rate | 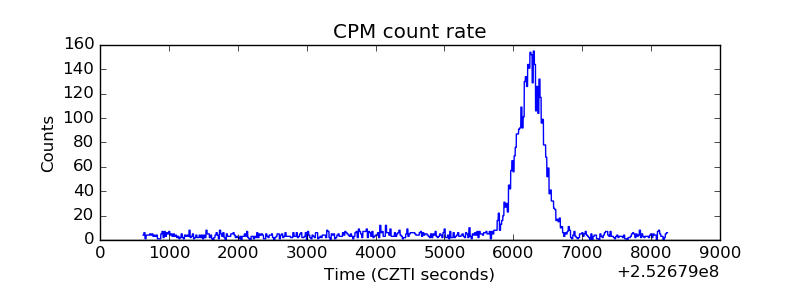 |
| CZT Counter | 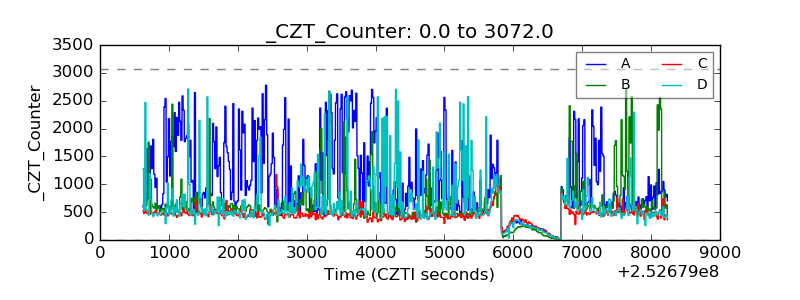 |
| +2.5 Volts monitor |  |
| +5 Volts monitor |  |
| _ROLL_ROT | 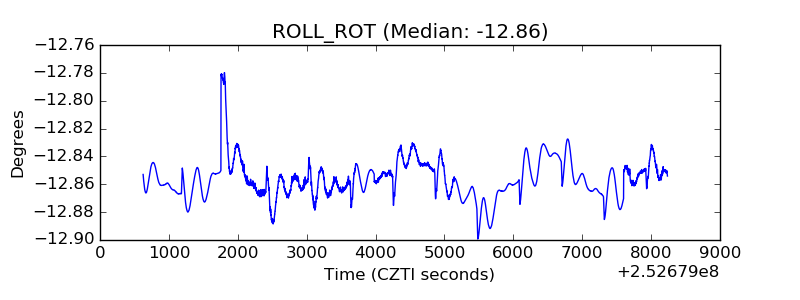 |
| _Roll_DEC | 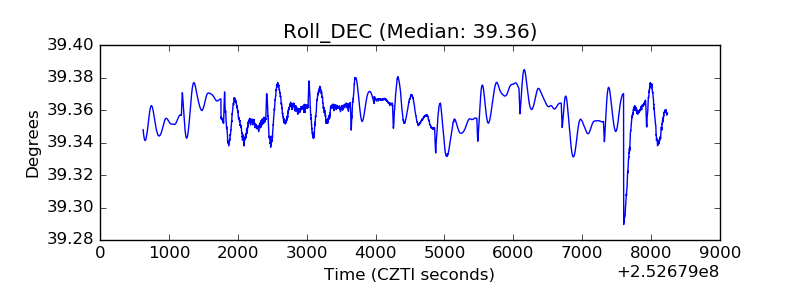 |
| _Roll_RA | 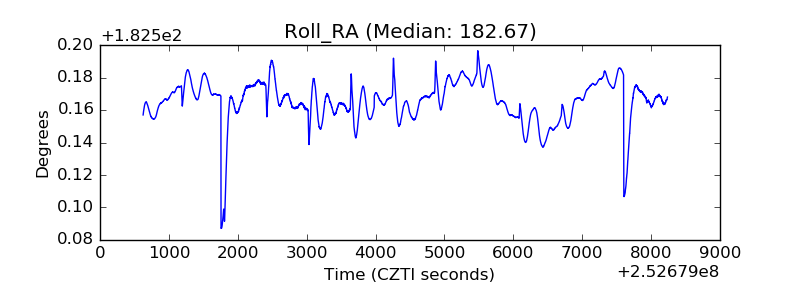 |
| Veto Counter | 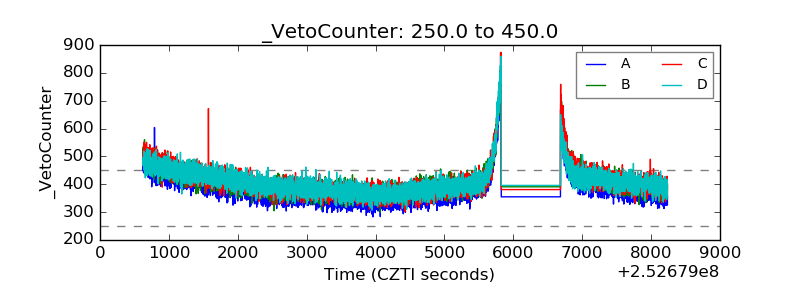 |