| Param | Original file | Final file |
|---|---|---|
| Filename | modeM0/AS1G08_064T01_9000001814_12263cztM0_level2.evt | modeM0/AS1G08_064T01_9000001814_12263cztM0_level2_quad_clean.evt |
| Size (bytes) | 633,015,360 | 75,516,480 |
| Size | 603.7 MB | 72.0 MB |
| Events in quadrant A | 6,241,198 | 440,458 |
| Events in quadrant B | 5,071,160 | 446,666 |
| Events in quadrant C | 3,387,610 | 457,050 |
| Events in quadrant D | 3,981,232 | 438,639 |
| Mode M9 | |||
|---|---|---|---|
| Quadrant | BADHDUFLAG | Total packets | Discarded packets |
| A | 0 | 4 | 0 |
| B | 0 | 4 | 0 |
| C | 0 | 4 | 0 |
| D | 0 | 4 | 0 |
| Mode SS | |||
|---|---|---|---|
| Quadrant | BADHDUFLAG | Total packets | Discarded packets |
| A | 0 | 148 | 0 |
| B | 0 | 148 | 0 |
| C | 0 | 148 | 0 |
| D | 0 | 148 | 0 |
| Mode M0 | |||
|---|---|---|---|
| Quadrant | BADHDUFLAG | Total packets | Discarded packets |
| A | 0 | 23701 | 2 |
| B | 0 | 19775 | 1 |
| C | 0 | 14932 | 1 |
| D | 0 | 16734 | 1 |
| Quadrant | Total seconds | Saturated seconds | Saturation percentage |
|---|---|---|---|
| A | 7226 | 511 | 7.071686% |
| B | 7226 | 634 | 8.773872% |
| C | 7226 | 92 | 1.273180% |
| D | 7226 | 176 | 2.435649% |
Noise dominated data is calculated using 1-second bins in cleaned event files. If a bin has >2000 counts, and if more than 50% of those come from <1% of pixels, then it is considered to be noise-dominated and hence unusable.
| Quadrant | # 1 sec bins | Bins with >0 counts | Bins with >2000 counts | High rate bins dominated by noise | Noise dominated (total time) | Noise dominated (detector-on time) | Marked lightcurve |
|---|---|---|---|---|---|---|---|
| A | 7681 | 7227 | 209 | 209 | 2.72% | 2.89% | 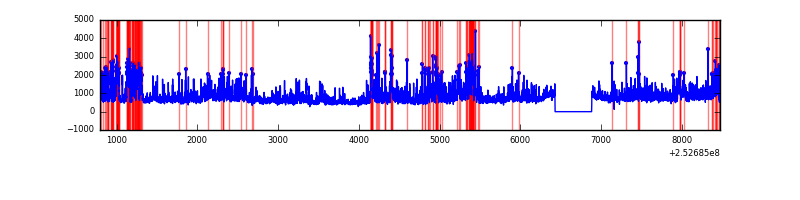 |
| B | 7682 | 7228 | 313 | 313 | 4.07% | 4.33% | 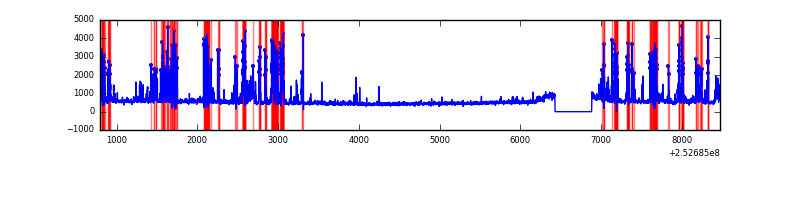 |
| C | 7681 | 7227 | 0 | 0 | 0.00% | 0.00% | 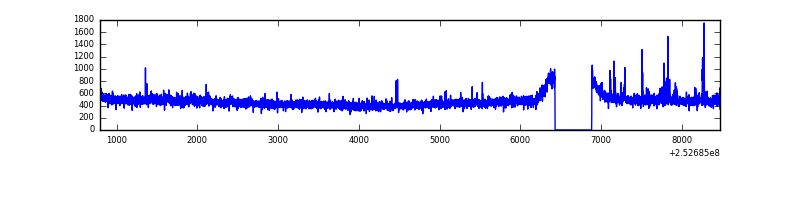 |
| D | 7681 | 7227 | 65 | 65 | 0.85% | 0.90% | 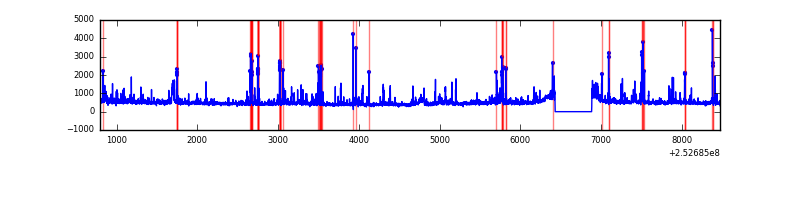 |
Top three noisy pixels from each quadrant. If the there are fewer than three noisy pixels in the level2.evt file, extra rows are filled as -1
| Pixel properties | Quadrant properties | ||||||
|---|---|---|---|---|---|---|---|
| Quadrant | DetID | PixID | Counts | Sigma | Mean | Median | Sigma |
| A | 13 | 251 | 1483309 | 8450.34 | 855 | 837 | 175.4 |
| A | 8 | 15 | 394771 | 2245.49 | 855 | 837 | 175.4 |
| A | 14 | 237 | 362014 | 2058.77 | 855 | 837 | 175.4 |
| B | 4 | 239 | 1394034 | 8723.9 | 837 | 816 | 159.7 |
| B | 4 | 206 | 173885 | 1083.7 | 837 | 816 | 159.7 |
| B | 3 | 64 | 68594 | 424.4 | 837 | 816 | 159.7 |
| C | 4 | 175 | 34654 | 174.3 | 844 | 849 | 193.9 |
| C | 15 | 208 | 21258 | 105.23 | 844 | 849 | 193.9 |
| C | 3 | 233 | 18567 | 91.36 | 844 | 849 | 193.9 |
| D | 1 | 52 | 246136 | 1200.23 | 843 | 819 | 204.4 |
| D | 10 | 199 | 143379 | 697.49 | 843 | 819 | 204.4 |
| D | 13 | 104 | 100169 | 486.08 | 843 | 819 | 204.4 |
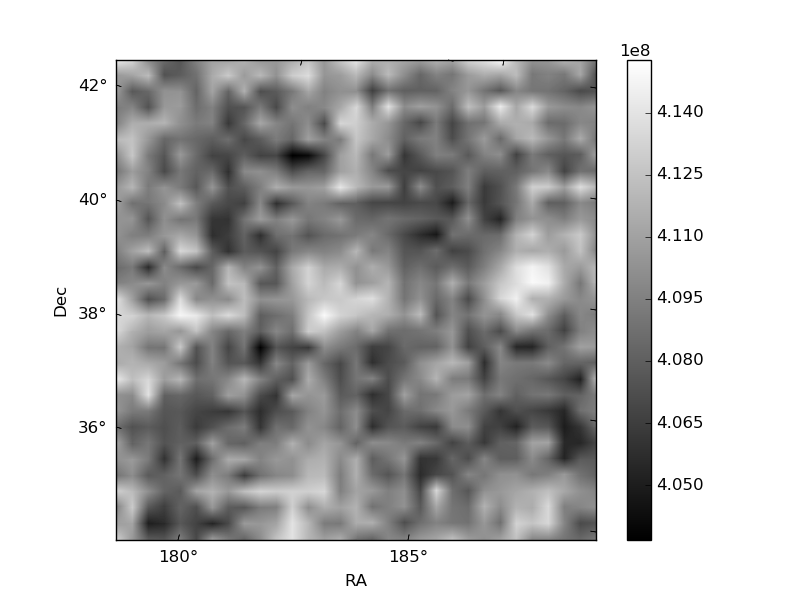
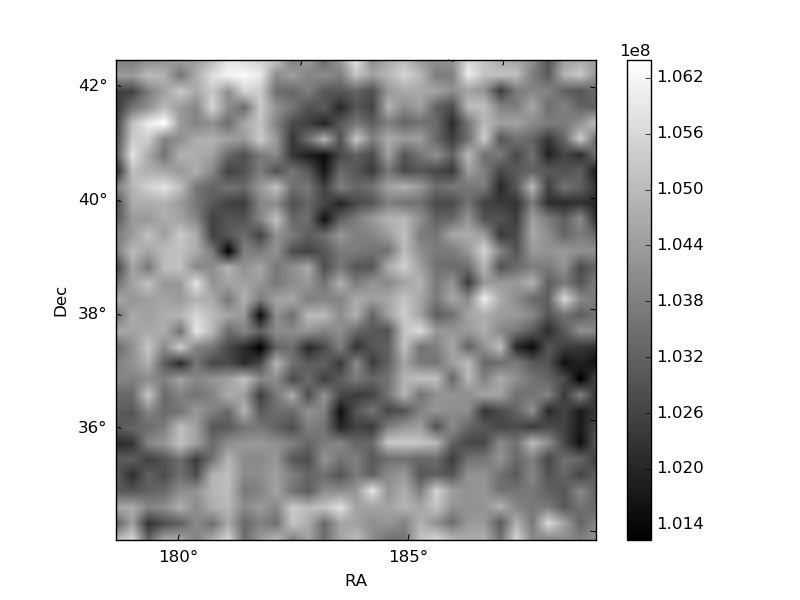
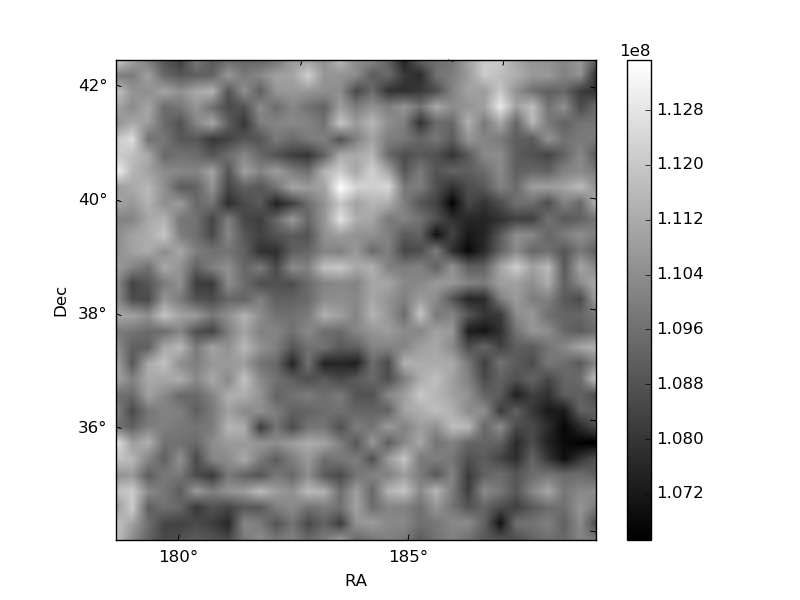
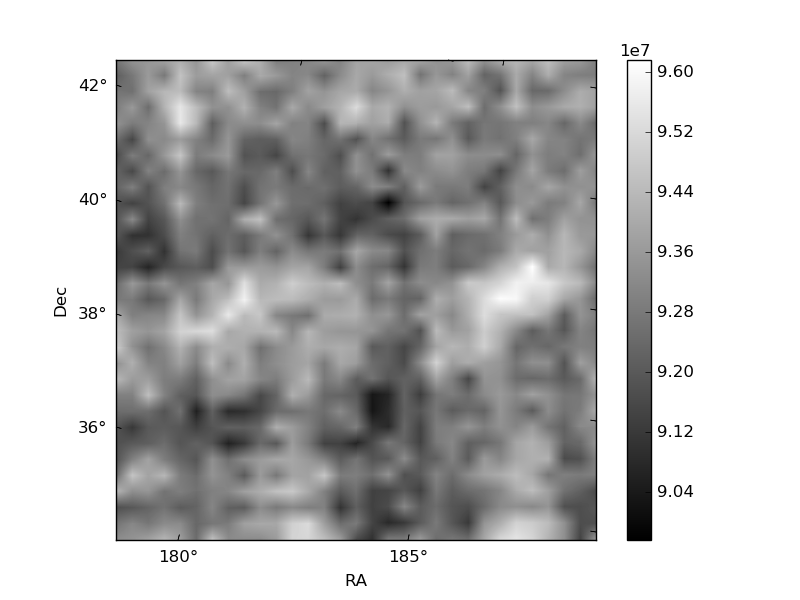
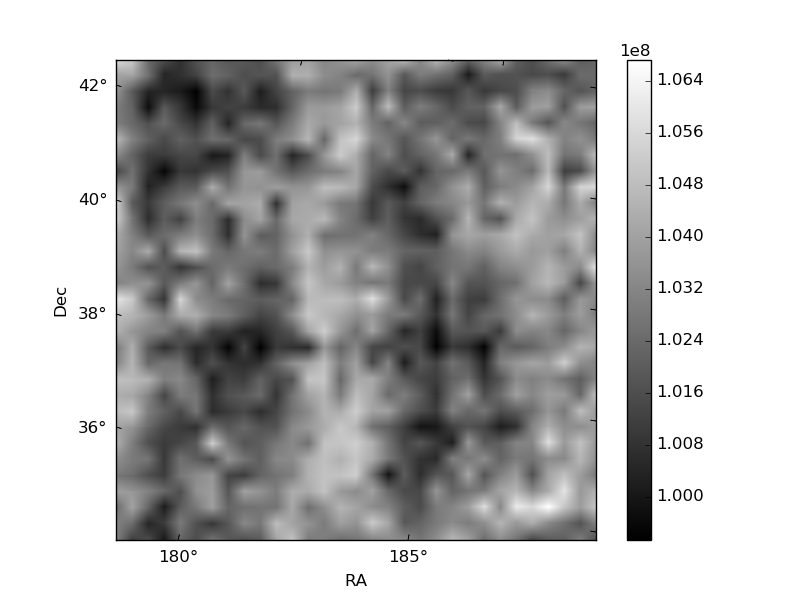
Histogram calculated using DETX and DETY for each event in the final _common_clean file
| Quadrant A | 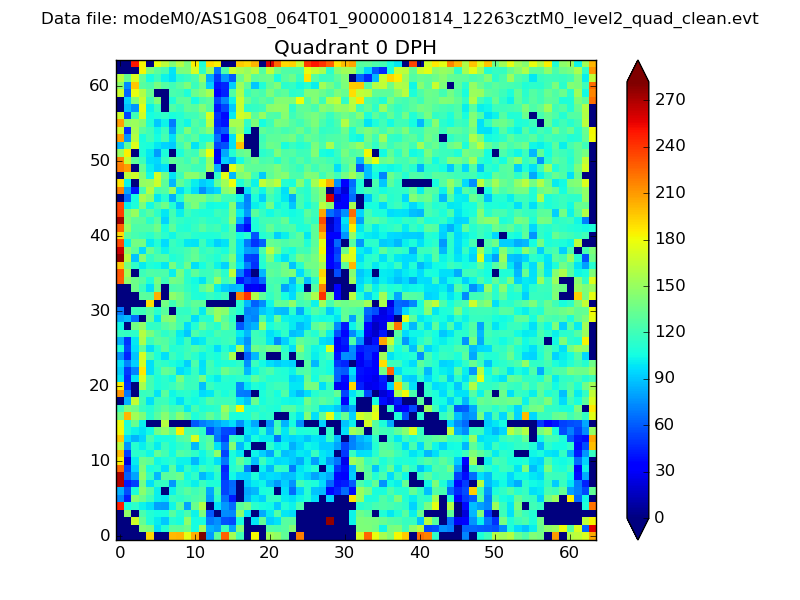 |
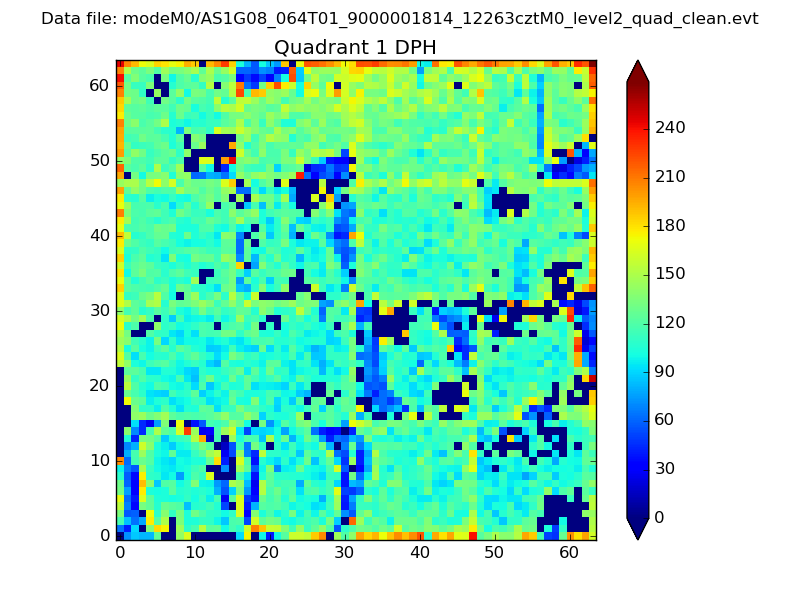 |
Quadrant B |
|---|---|---|---|
| Quadrant D | 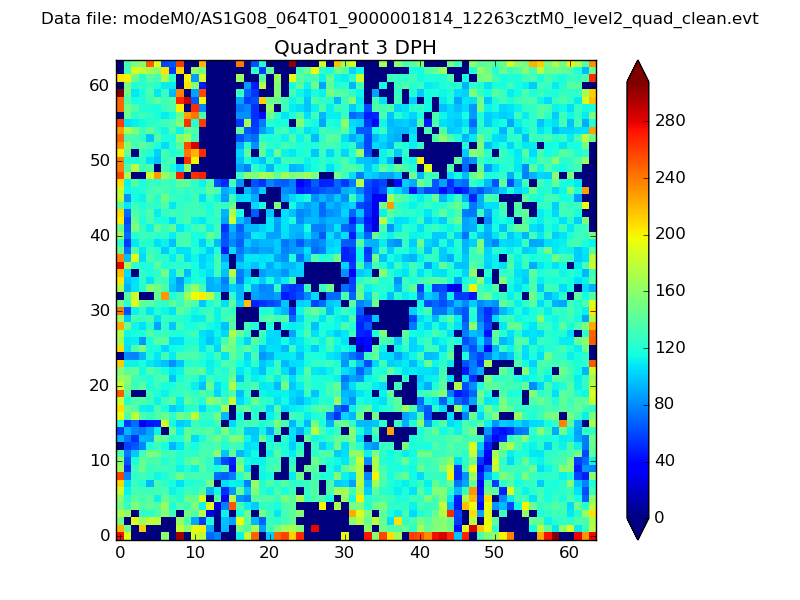 |
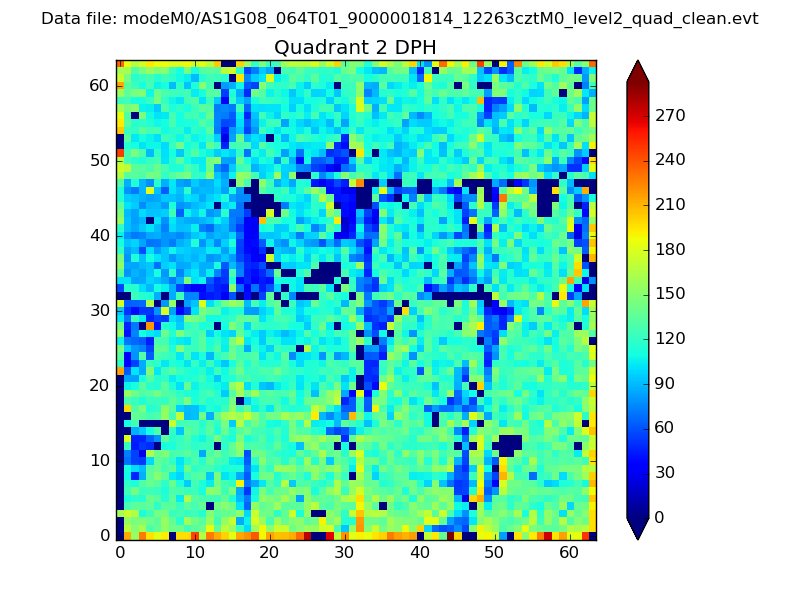 |
Quadrant C |
| Plot type | Count rate plots | Images |
|---|---|---|
| Comparison with Poisson distribution Blue bars denote a histogram of data divided into 1 sec bins. Red curve is a Poisson curve with rate = median count rate of data. |
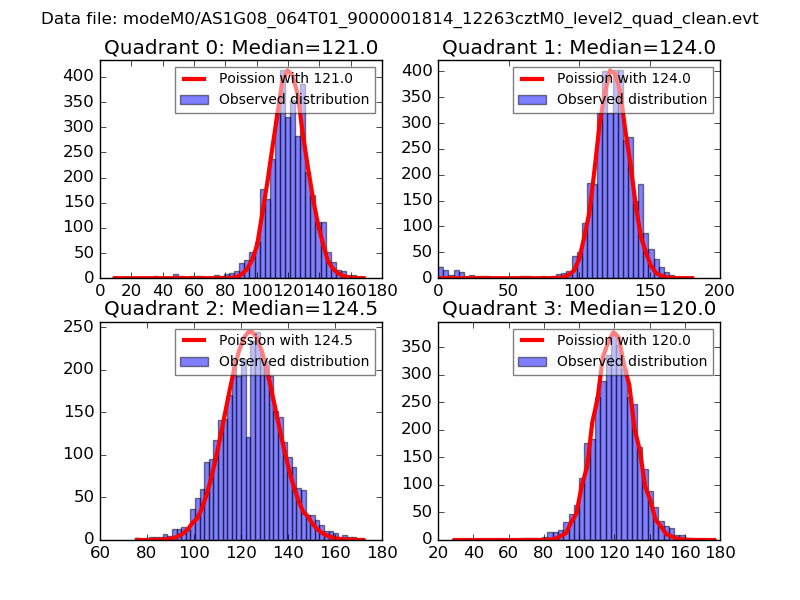 |
 |
| Quadrant-wise count rates Data is divided into 100 sec bins |
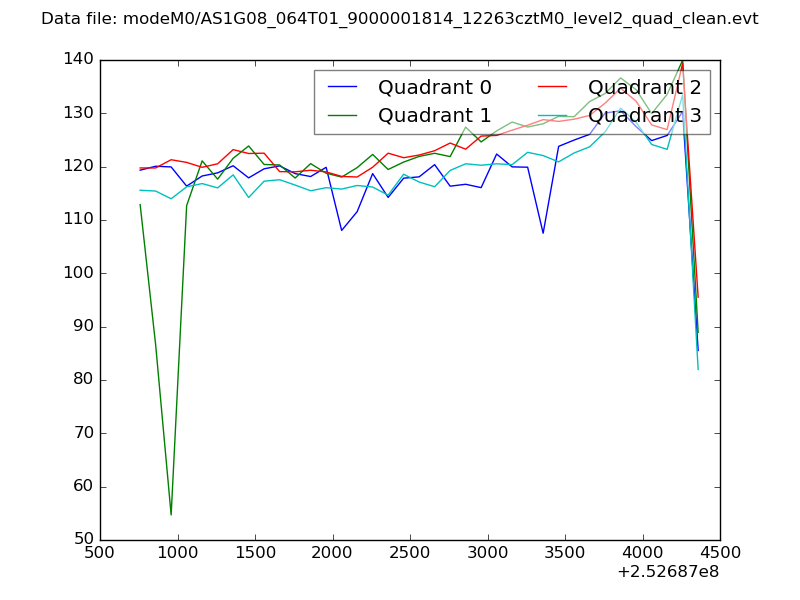 |
|
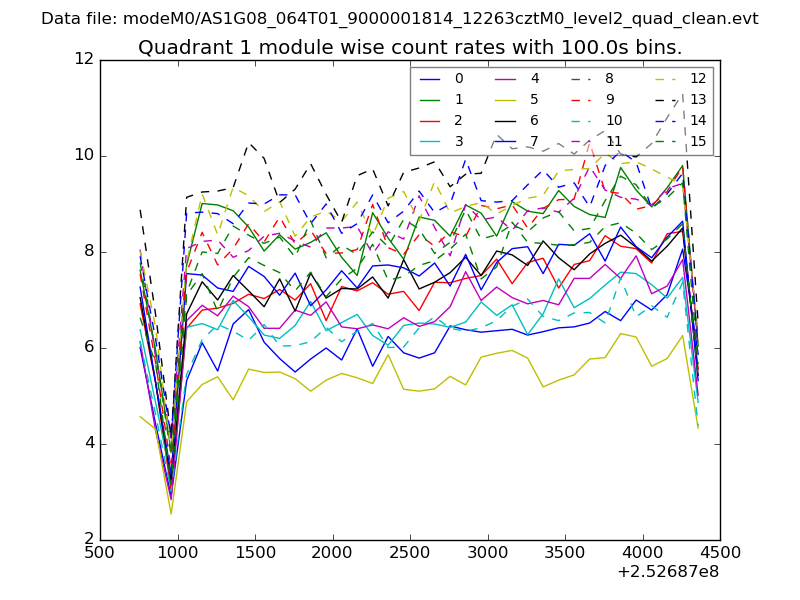
| Module-wise count rates for Quadrant A Data is divided into 100 sec bins |
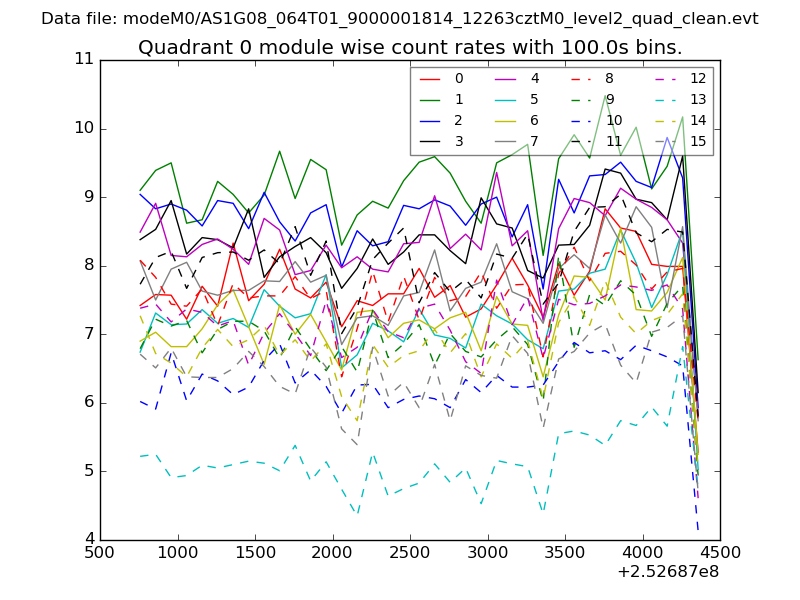 |
 |
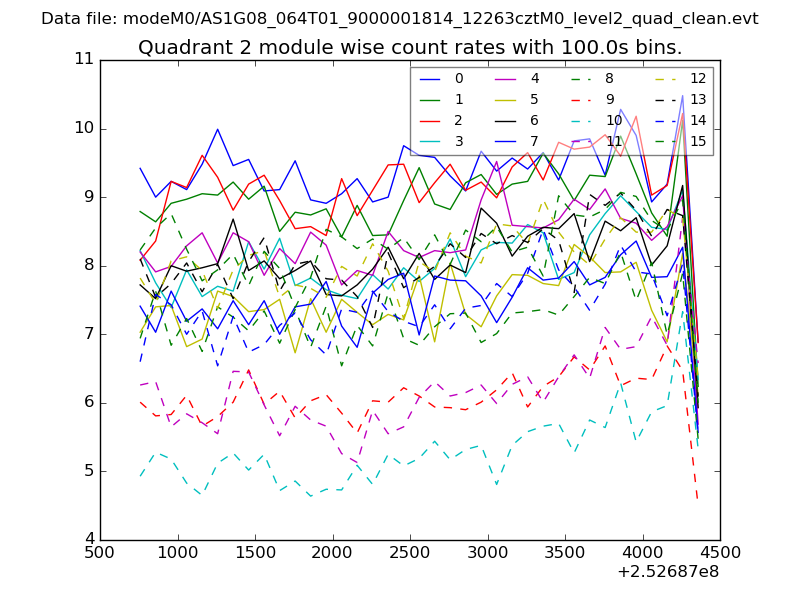
| Module-wise count rates for Quadrant B Data is divided into 100 sec bins |
 |
 |
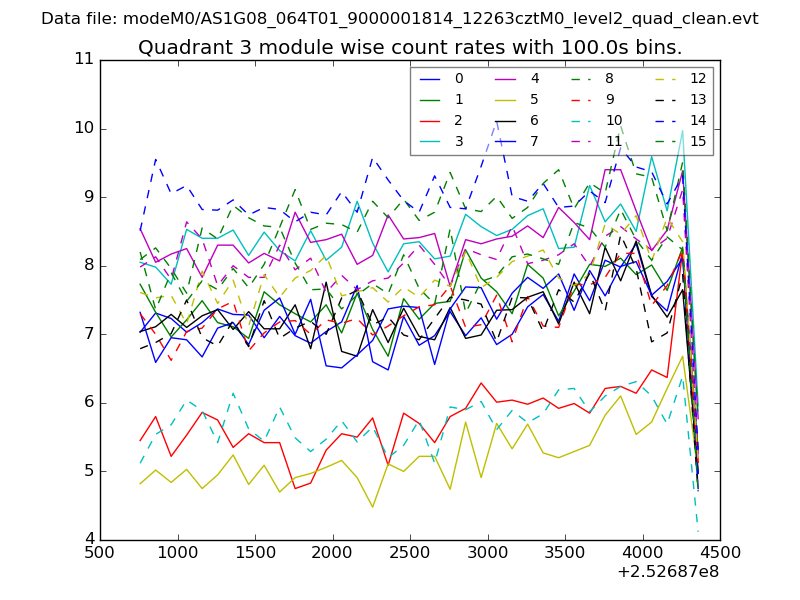
| Module-wise count rates for Quadrant C Data is divided into 100 sec bins |
 |
 |
| Module-wise count rates for Quadrant D Data is divided into 100 sec bins |
 |
 |
| Parameter | Plot |
|---|---|
| CZT HV Monitor | 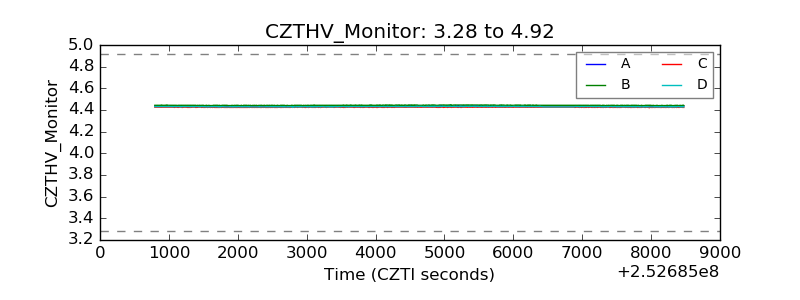 |
| D_VDD | 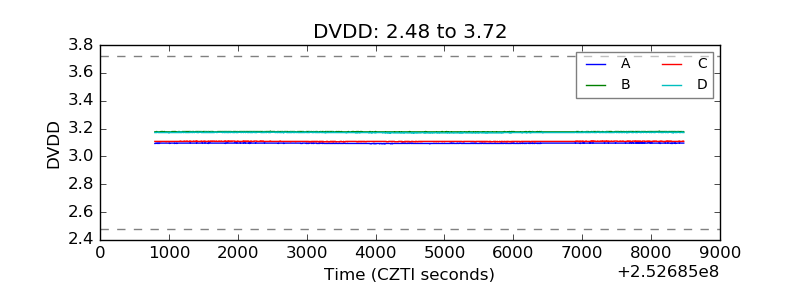 |
| Temperature 1 | 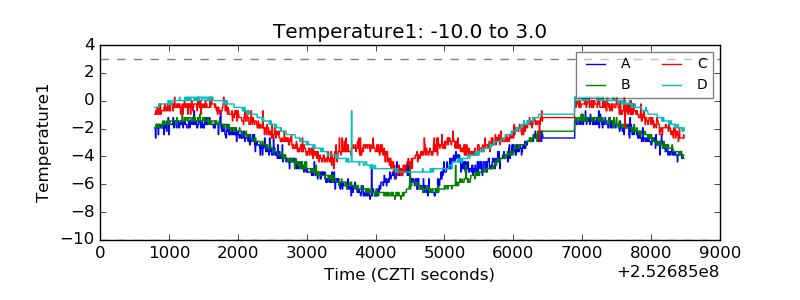 |
| Veto HV Monitor | 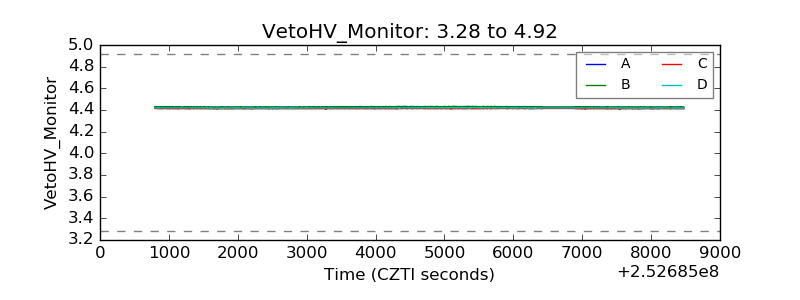 |
| Veto LLD | 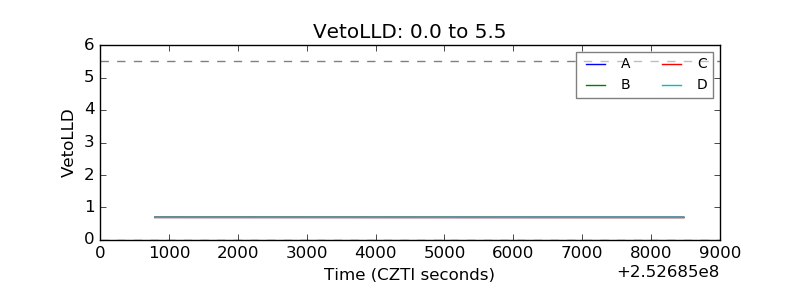 |
| Alpha Counter | 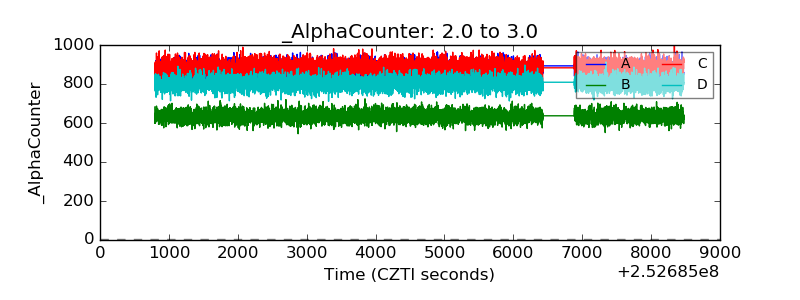 |
| _CPM_Rate | 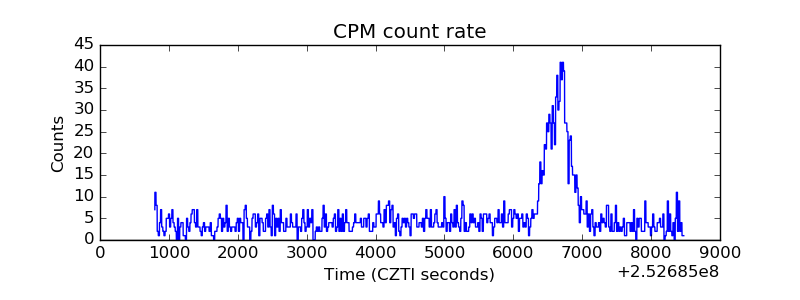 |
| CZT Counter | 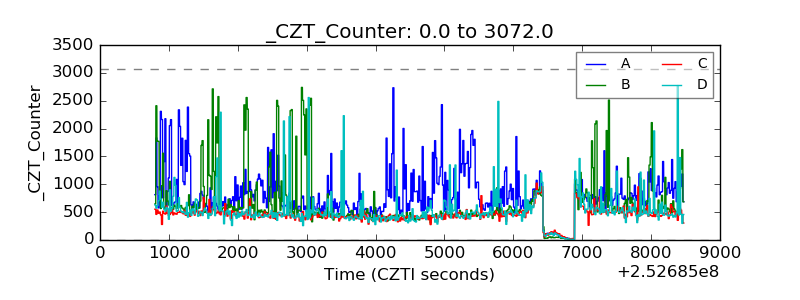 |
| +2.5 Volts monitor |  |
| +5 Volts monitor |  |
| _ROLL_ROT | 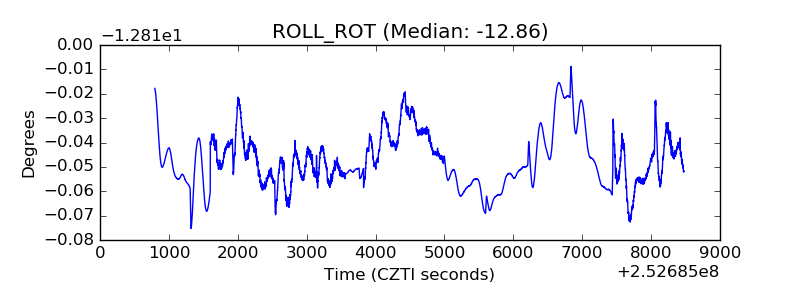 |
| _Roll_DEC | 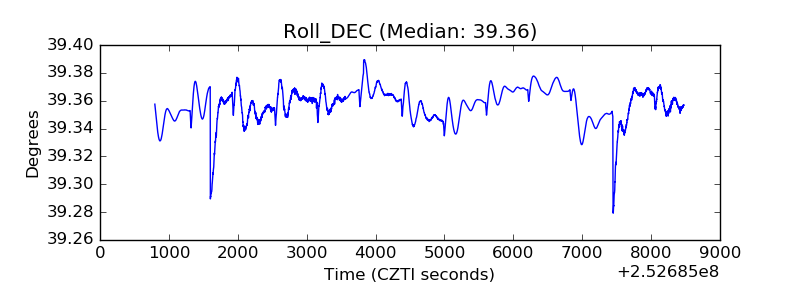 |
| _Roll_RA | 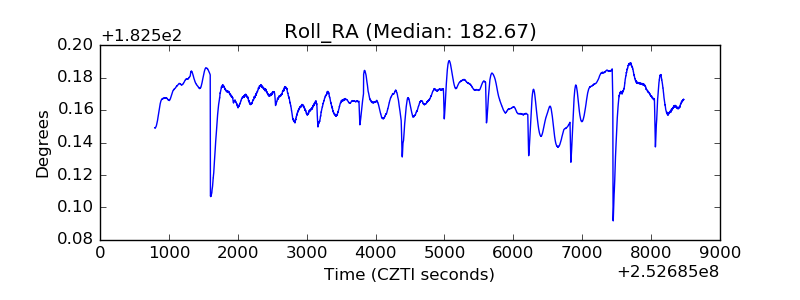 |
| Veto Counter | 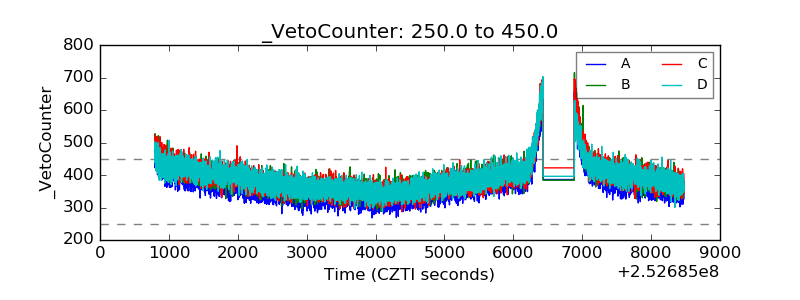 |