| Param | Original file | Final file |
|---|---|---|
| Filename | modeM0/AS1G08_064T01_9000001814_12264cztM0_level2.evt | modeM0/AS1G08_064T01_9000001814_12264cztM0_level2_quad_clean.evt |
| Size (bytes) | 618,042,240 | 80,654,400 |
| Size | 589.4 MB | 76.9 MB |
| Events in quadrant A | 5,415,403 | 494,972 |
| Events in quadrant B | 5,300,822 | 481,041 |
| Events in quadrant C | 3,330,455 | 499,991 |
| Events in quadrant D | 4,197,022 | 478,835 |
| Mode M9 | |||
|---|---|---|---|
| Quadrant | BADHDUFLAG | Total packets | Discarded packets |
| A | 0 | 3 | 0 |
| B | 0 | 3 | 0 |
| C | 0 | 3 | 0 |
| D | 0 | 3 | 0 |
| Mode SS | |||
|---|---|---|---|
| Quadrant | BADHDUFLAG | Total packets | Discarded packets |
| A | 0 | 140 | 0 |
| B | 0 | 140 | 0 |
| C | 0 | 140 | 0 |
| D | 0 | 140 | 0 |
| Mode M0 | |||
|---|---|---|---|
| Quadrant | BADHDUFLAG | Total packets | Discarded packets |
| A | 0 | 21048 | 2 |
| B | 0 | 20419 | 1 |
| C | 0 | 14607 | 1 |
| D | 0 | 17278 | 1 |
| Quadrant | Total seconds | Saturated seconds | Saturation percentage |
|---|---|---|---|
| A | 7004 | 333 | 4.754426% |
| B | 7004 | 813 | 11.607653% |
| C | 7004 | 62 | 0.885208% |
| D | 7004 | 201 | 2.869789% |
Noise dominated data is calculated using 1-second bins in cleaned event files. If a bin has >2000 counts, and if more than 50% of those come from <1% of pixels, then it is considered to be noise-dominated and hence unusable.
| Quadrant | # 1 sec bins | Bins with >0 counts | Bins with >2000 counts | High rate bins dominated by noise | Noise dominated (total time) | Noise dominated (detector-on time) | Marked lightcurve |
|---|---|---|---|---|---|---|---|
| A | 7230 | 7006 | 80 | 80 | 1.11% | 1.14% | 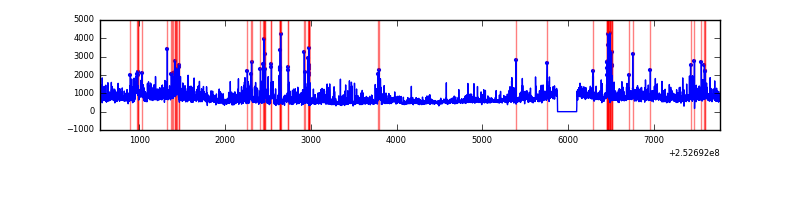 |
| B | 7230 | 7006 | 432 | 432 | 5.98% | 6.17% | 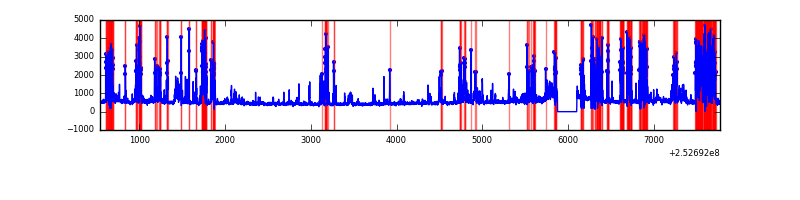 |
| C | 7230 | 7006 | 1 | 1 | 0.01% | 0.01% | 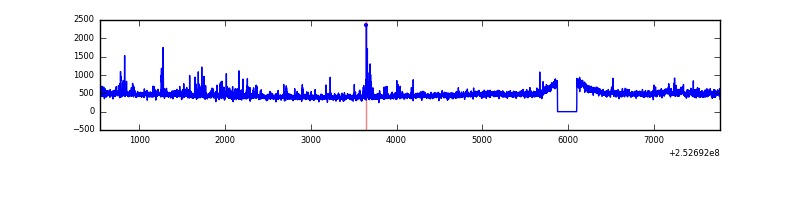 |
| D | 7230 | 7006 | 125 | 125 | 1.73% | 1.78% |  |
Top three noisy pixels from each quadrant. If the there are fewer than three noisy pixels in the level2.evt file, extra rows are filled as -1
| Pixel properties | Quadrant properties | ||||||
|---|---|---|---|---|---|---|---|
| Quadrant | DetID | PixID | Counts | Sigma | Mean | Median | Sigma |
| A | 13 | 251 | 1353689 | 8059.75 | 819 | 801 | 167.9 |
| A | 5 | 16 | 197420 | 1171.35 | 819 | 801 | 167.9 |
| A | 1 | 162 | 161348 | 956.45 | 819 | 801 | 167.9 |
| B | 4 | 239 | 1926052 | 12891.77 | 779 | 762 | 149.3 |
| B | 4 | 206 | 121859 | 810.87 | 779 | 762 | 149.3 |
| B | 11 | 51 | 85558 | 567.8 | 779 | 762 | 149.3 |
| C | 3 | 233 | 103618 | 555.99 | 805 | 808 | 184.9 |
| C | 15 | 208 | 51313 | 273.13 | 805 | 808 | 184.9 |
| C | 4 | 175 | 21601 | 112.45 | 805 | 808 | 184.9 |
| D | 1 | 52 | 451280 | 2312.99 | 803 | 777 | 194.8 |
| D | 10 | 199 | 183213 | 936.67 | 803 | 777 | 194.8 |
| D | 10 | 157 | 166236 | 849.5 | 803 | 777 | 194.8 |
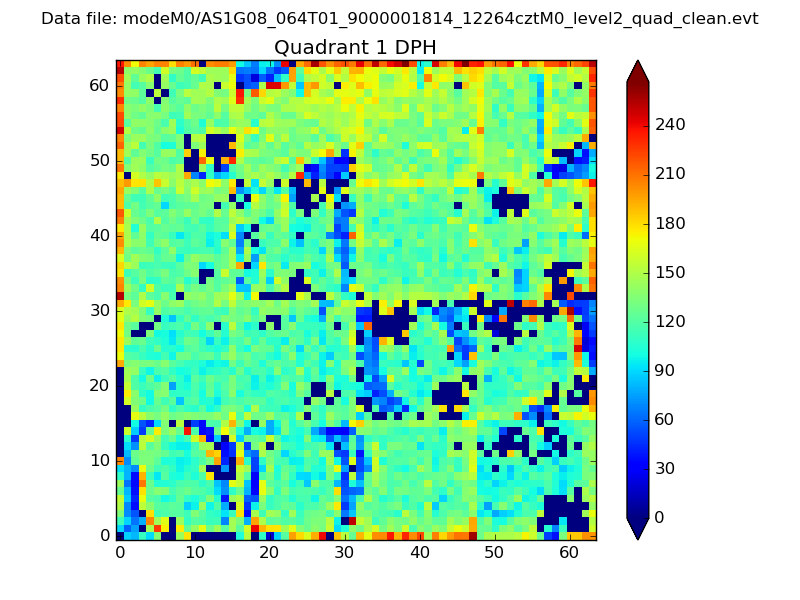
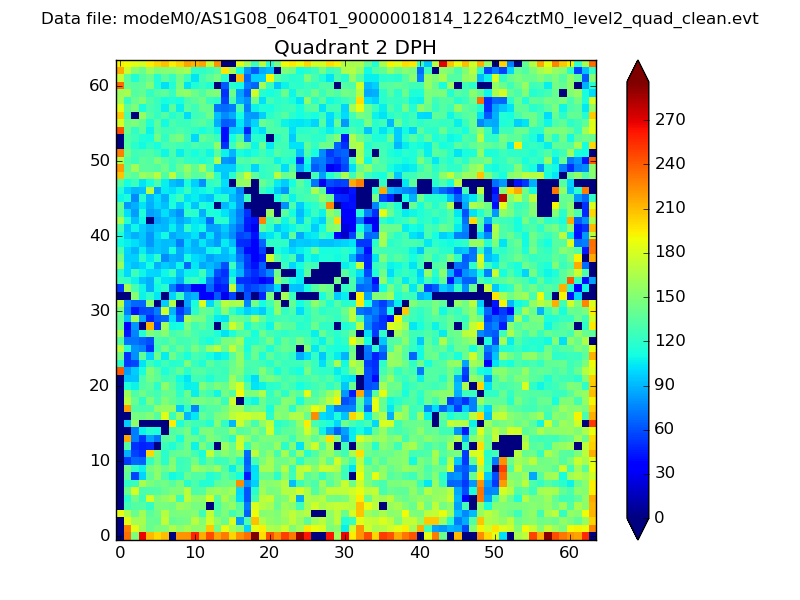
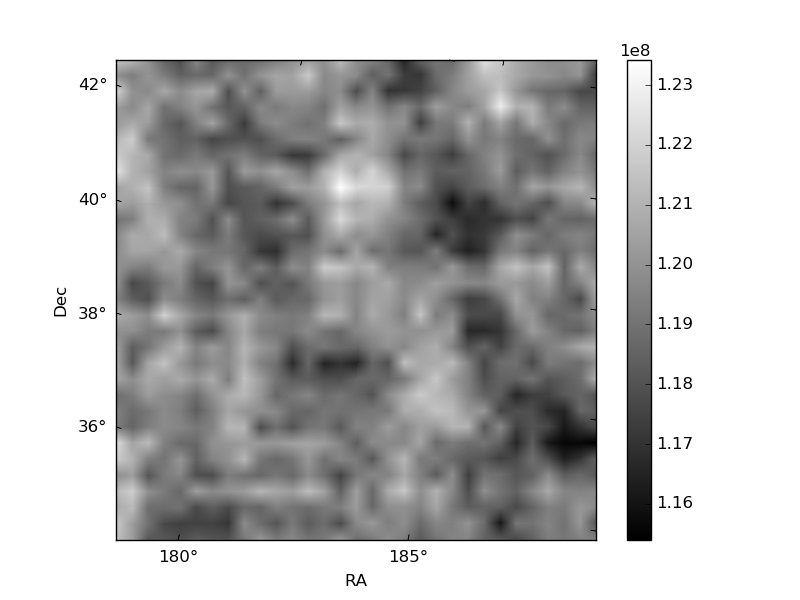
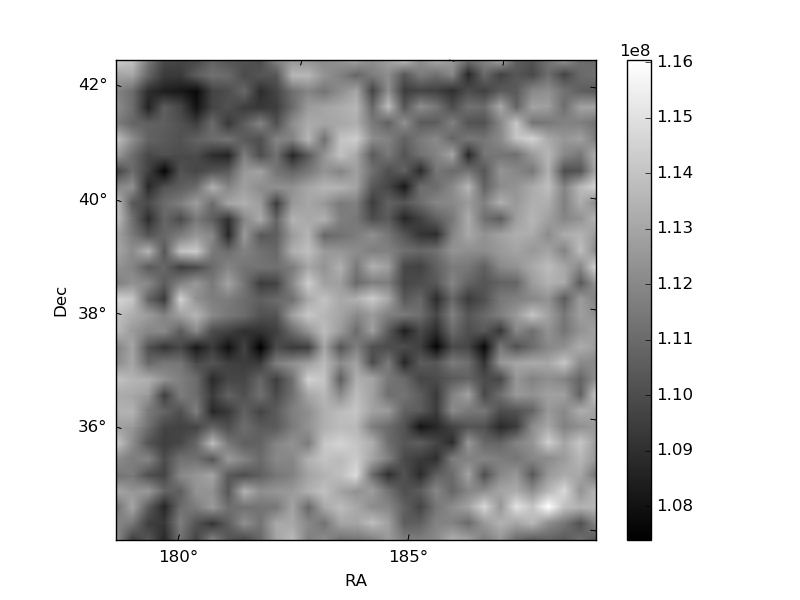
Histogram calculated using DETX and DETY for each event in the final _common_clean file
| Quadrant A | 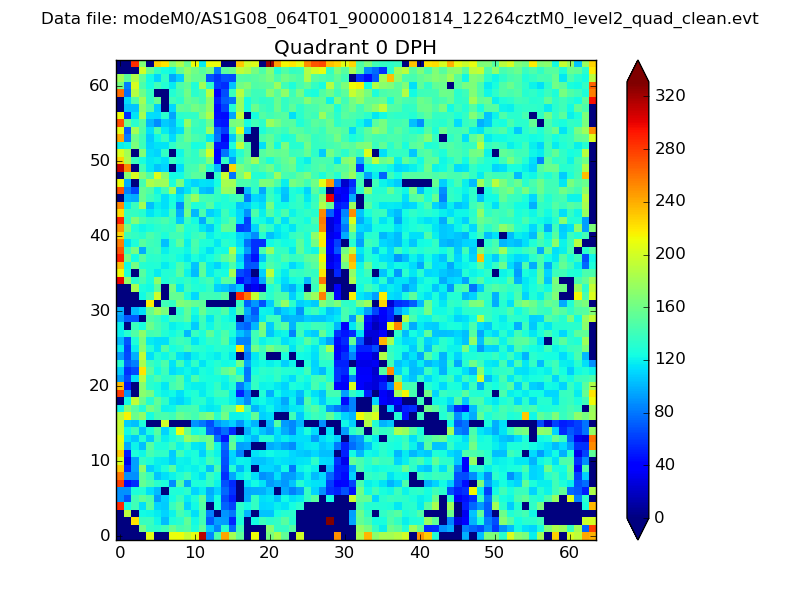 |
 |
Quadrant B |
|---|---|---|---|
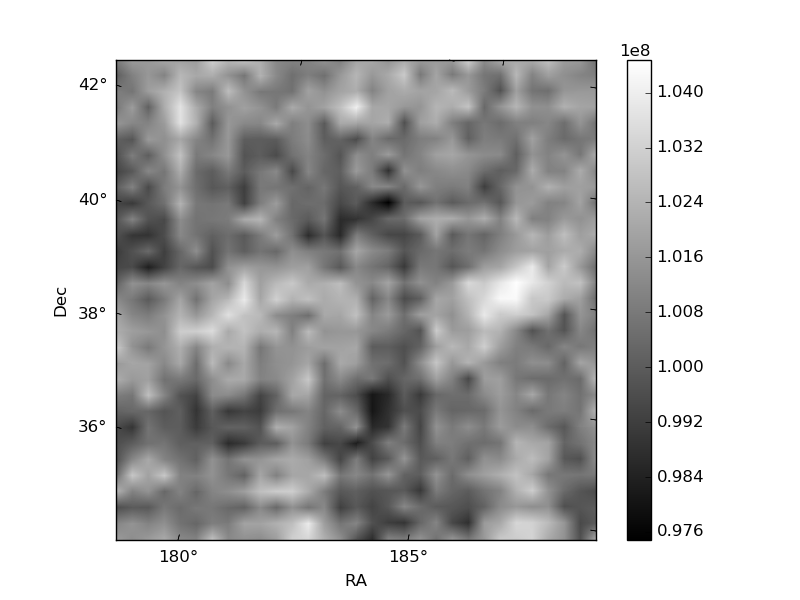
| Quadrant D |  |
 |
Quadrant C |
| Plot type | Count rate plots | Images |
|---|---|---|
| Comparison with Poisson distribution Blue bars denote a histogram of data divided into 1 sec bins. Red curve is a Poisson curve with rate = median count rate of data. |
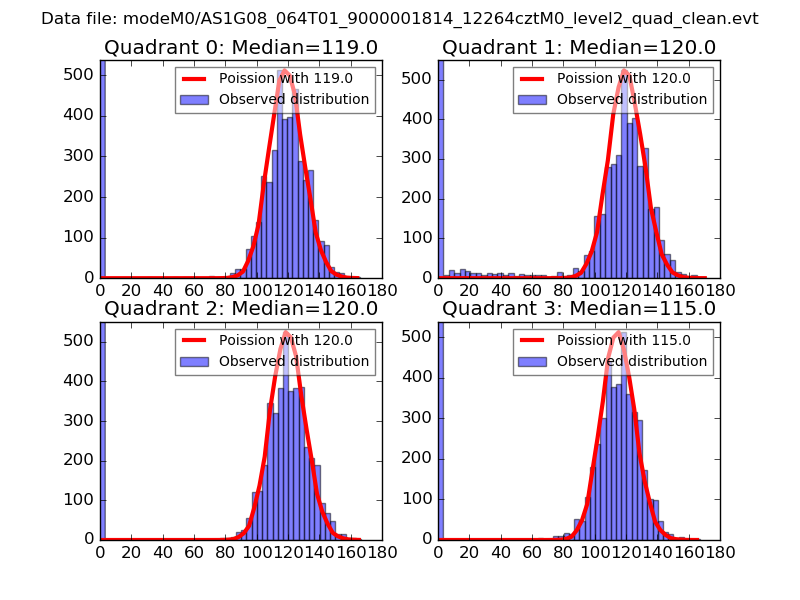 |
 |
| Quadrant-wise count rates Data is divided into 100 sec bins |
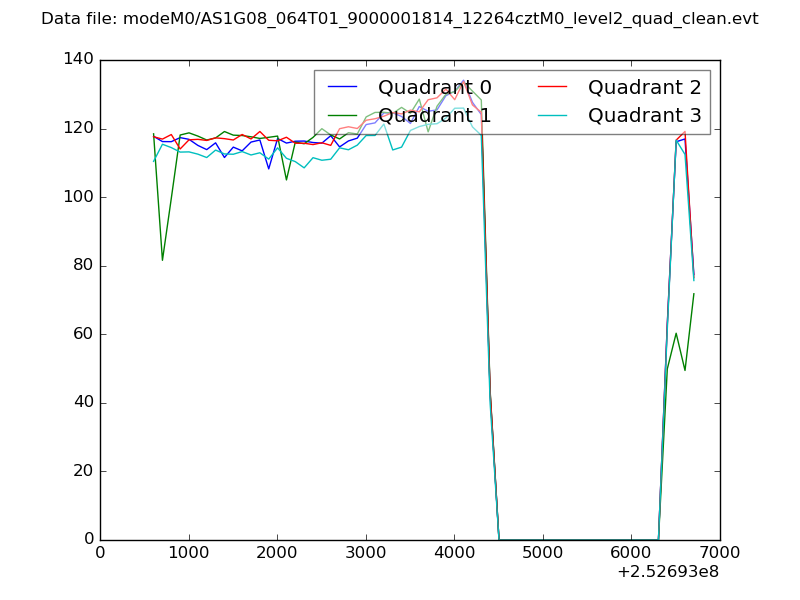 |
|
| Module-wise count rates for Quadrant A Data is divided into 100 sec bins |
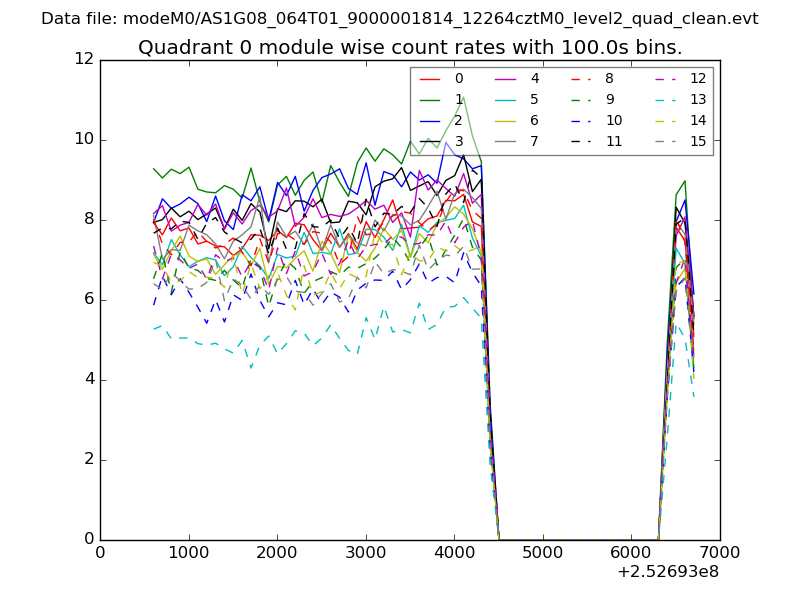 |
 |
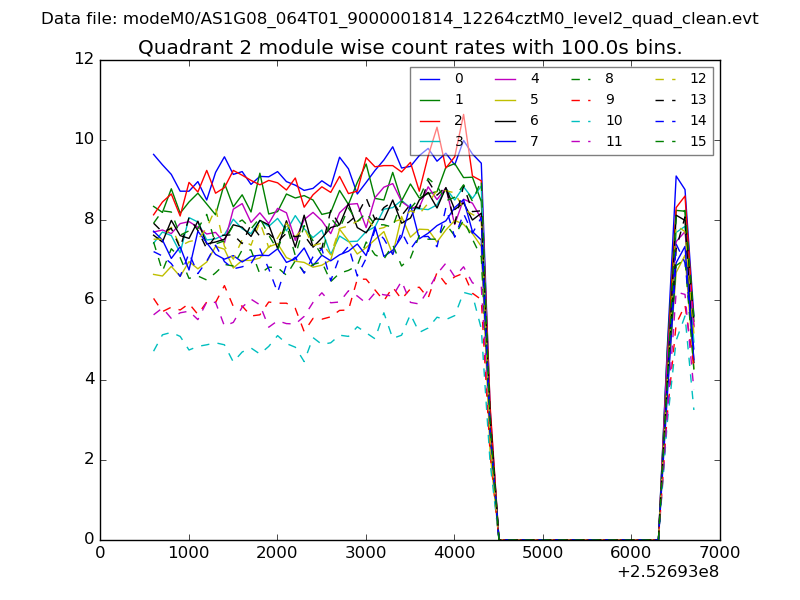
| Module-wise count rates for Quadrant B Data is divided into 100 sec bins |
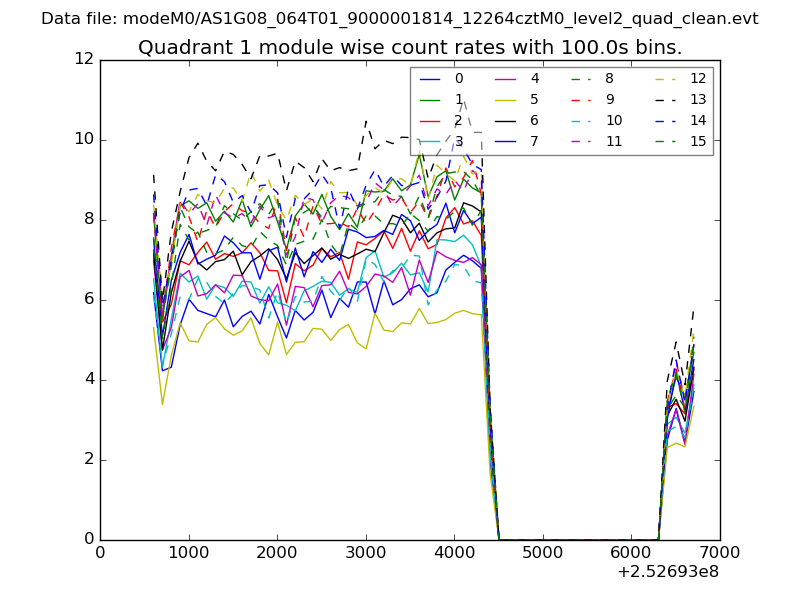 |
 |
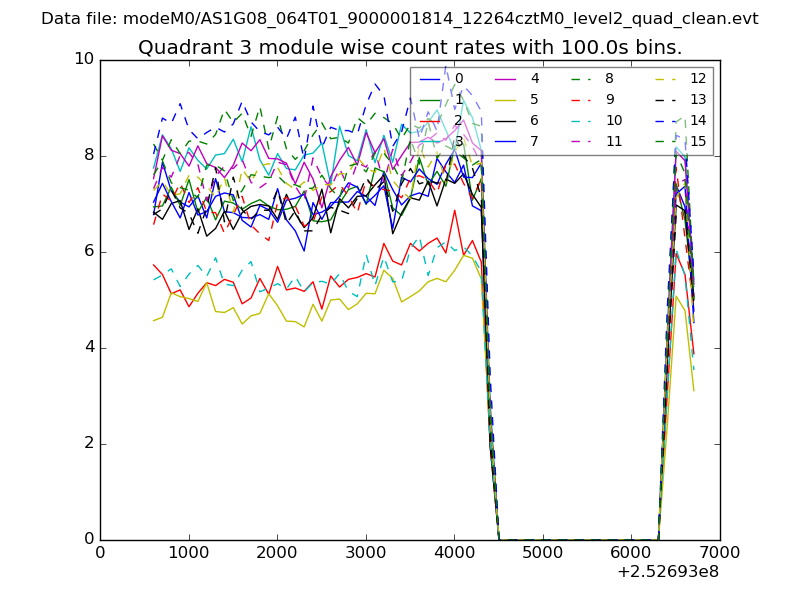
| Module-wise count rates for Quadrant C Data is divided into 100 sec bins |
 |
 |
| Module-wise count rates for Quadrant D Data is divided into 100 sec bins |
 |
 |
| Parameter | Plot |
|---|---|
| CZT HV Monitor | 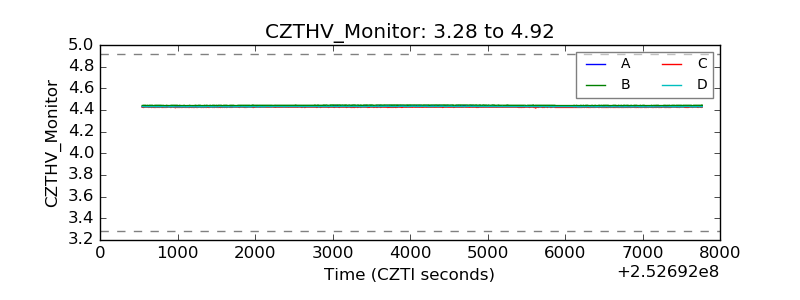 |
| D_VDD | 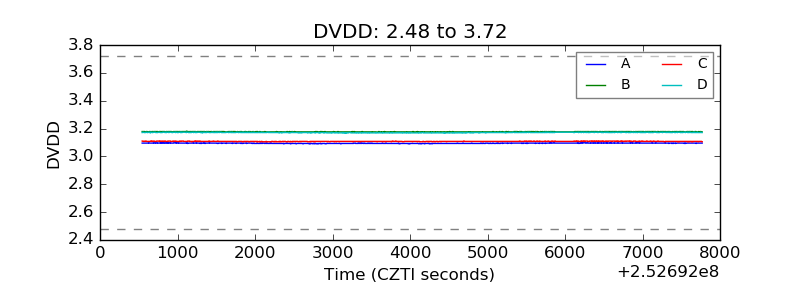 |
| Temperature 1 | 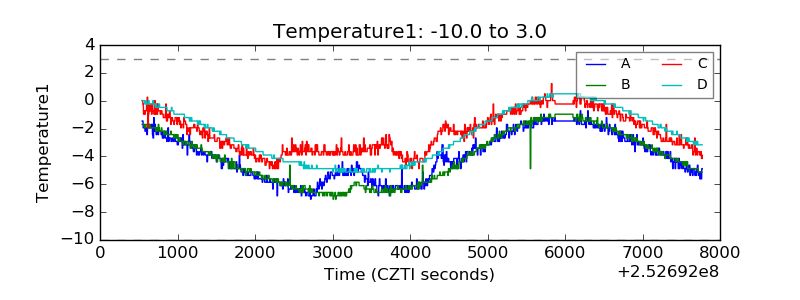 |
| Veto HV Monitor | 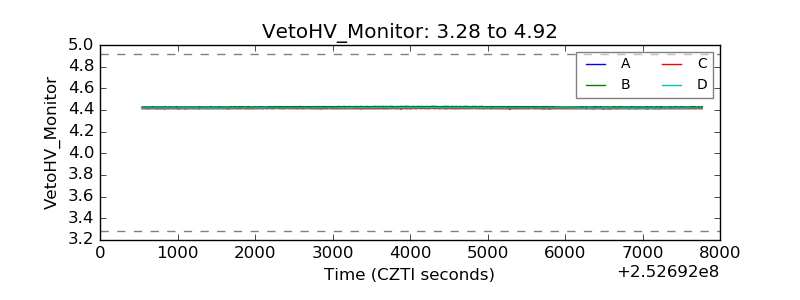 |
| Veto LLD | 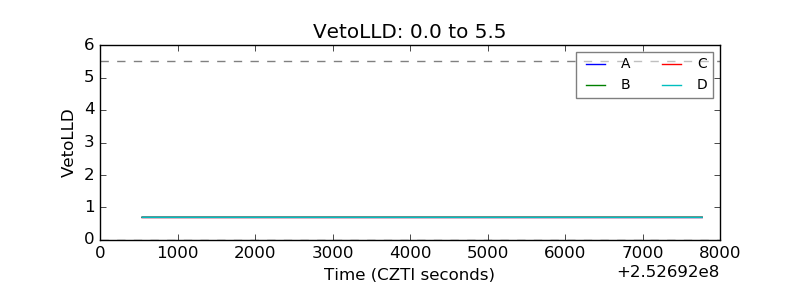 |
| Alpha Counter | 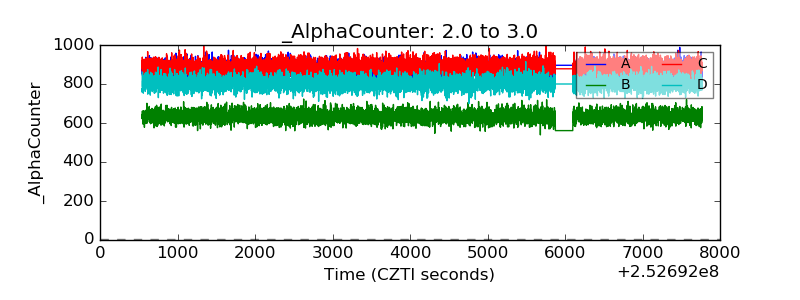 |
| _CPM_Rate | 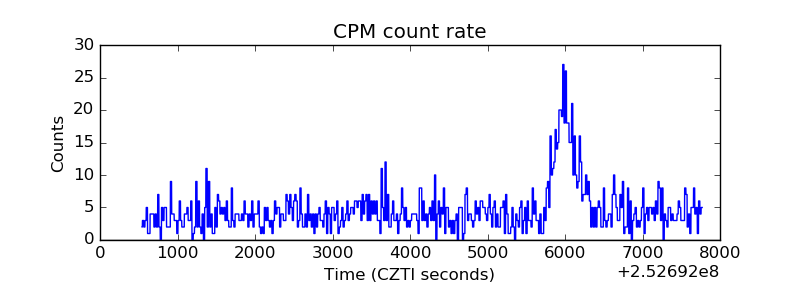 |
| CZT Counter | 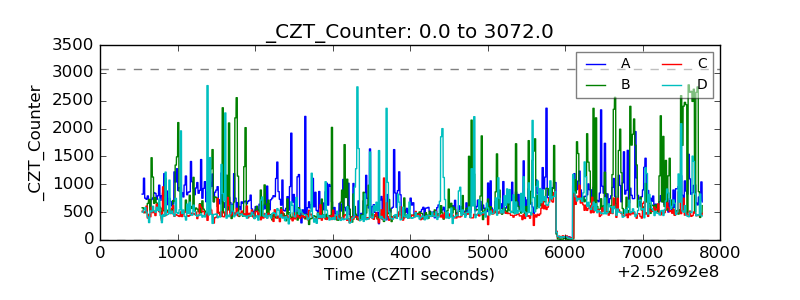 |
| +2.5 Volts monitor | 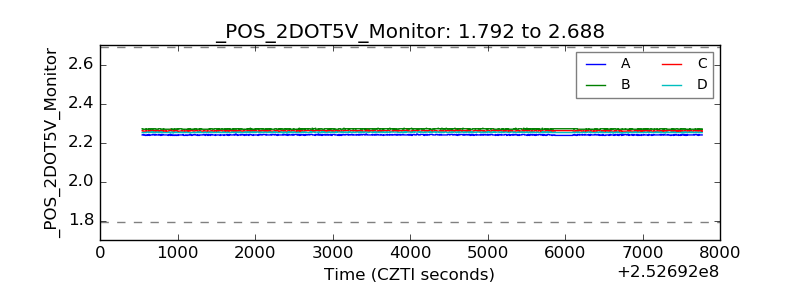 |
| +5 Volts monitor |  |
| _ROLL_ROT | 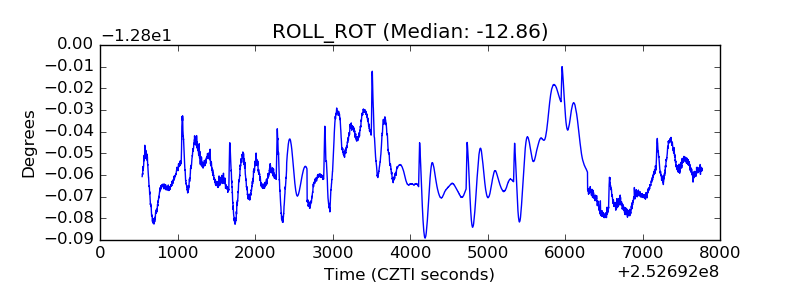 |
| _Roll_DEC | 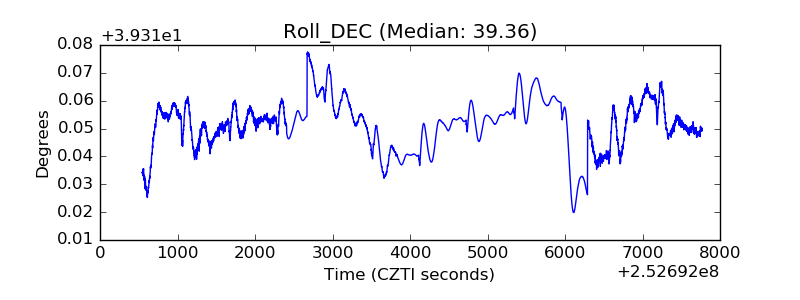 |
| _Roll_RA | 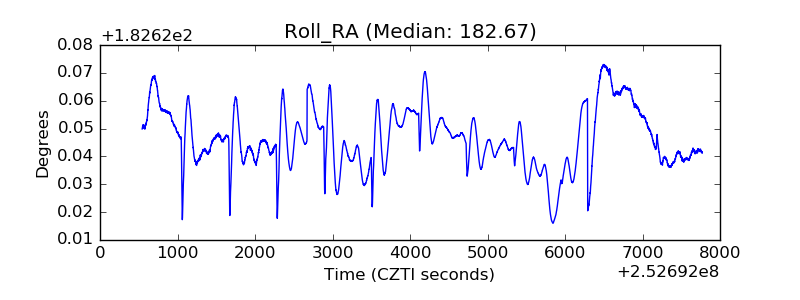 |
| Veto Counter | 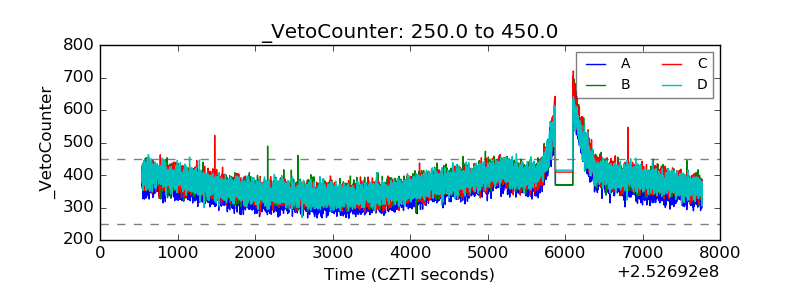 |