| Param | Original file | Final file |
|---|---|---|
| Filename | modeM0/AS1G08_064T01_9000001814_12265cztM0_level2.evt | modeM0/AS1G08_064T01_9000001814_12265cztM0_level2_quad_clean.evt |
| Size (bytes) | 646,139,520 | 83,736,000 |
| Size | 616.2 MB | 79.9 MB |
| Events in quadrant A | 5,372,340 | 528,224 |
| Events in quadrant B | 6,127,270 | 482,040 |
| Events in quadrant C | 3,759,409 | 534,282 |
| Events in quadrant D | 3,847,175 | 514,937 |
| Mode M9 | |||
|---|---|---|---|
| Quadrant | BADHDUFLAG | Total packets | Discarded packets |
| A | 0 | 3 | 0 |
| B | 0 | 3 | 0 |
| C | 0 | 3 | 0 |
| D | 0 | 3 | 0 |
| Mode SS | |||
|---|---|---|---|
| Quadrant | BADHDUFLAG | Total packets | Discarded packets |
| A | 0 | 140 | 0 |
| B | 0 | 140 | 0 |
| C | 0 | 140 | 0 |
| D | 0 | 140 | 0 |
| Mode M0 | |||
|---|---|---|---|
| Quadrant | BADHDUFLAG | Total packets | Discarded packets |
| A | 0 | 20806 | 2 |
| B | 0 | 22918 | 1 |
| C | 0 | 15595 | 1 |
| D | 0 | 16150 | 1 |
| Quadrant | Total seconds | Saturated seconds | Saturation percentage |
|---|---|---|---|
| A | 6824 | 321 | 4.703986% |
| B | 6824 | 1106 | 16.207503% |
| C | 6824 | 68 | 0.996483% |
| D | 6824 | 163 | 2.388628% |
Noise dominated data is calculated using 1-second bins in cleaned event files. If a bin has >2000 counts, and if more than 50% of those come from <1% of pixels, then it is considered to be noise-dominated and hence unusable.
| Quadrant | # 1 sec bins | Bins with >0 counts | Bins with >2000 counts | High rate bins dominated by noise | Noise dominated (total time) | Noise dominated (detector-on time) | Marked lightcurve |
|---|---|---|---|---|---|---|---|
| A | 7185 | 6826 | 97 | 97 | 1.35% | 1.42% | 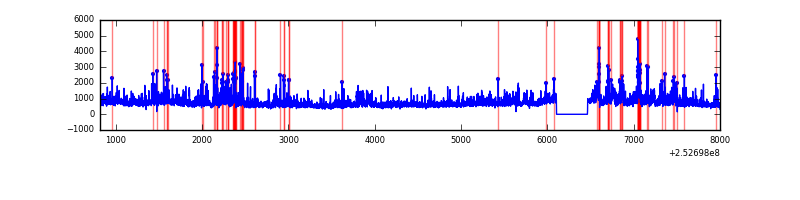 |
| B | 7185 | 6824 | 673 | 673 | 9.37% | 9.86% | 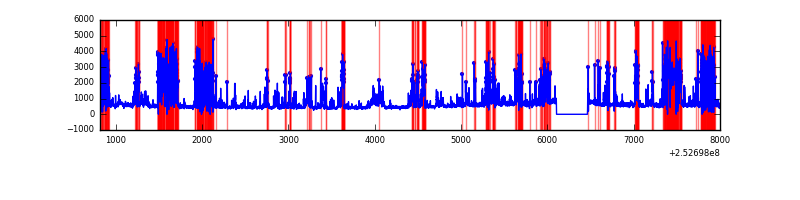 |
| C | 7185 | 6826 | 47 | 47 | 0.65% | 0.69% | 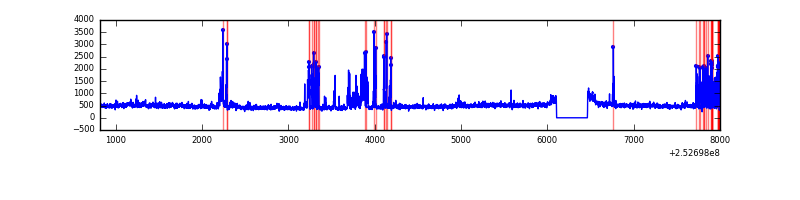 |
| D | 7185 | 6826 | 144 | 144 | 2.00% | 2.11% | 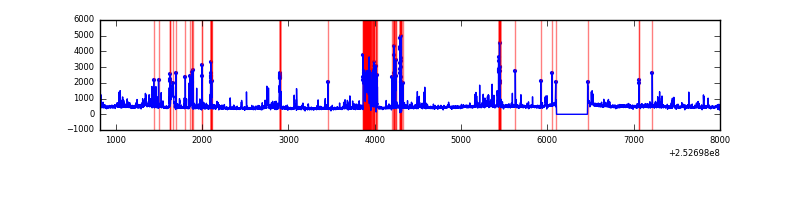 |
Top three noisy pixels from each quadrant. If the there are fewer than three noisy pixels in the level2.evt file, extra rows are filled as -1
| Pixel properties | Quadrant properties | ||||||
|---|---|---|---|---|---|---|---|
| Quadrant | DetID | PixID | Counts | Sigma | Mean | Median | Sigma |
| A | 13 | 251 | 1367467 | 8583.36 | 783 | 767 | 159.2 |
| A | 5 | 16 | 375405 | 2352.86 | 783 | 767 | 159.2 |
| A | 1 | 162 | 180184 | 1126.8 | 783 | 767 | 159.2 |
| B | 4 | 239 | 2876262 | 20763.14 | 727 | 708 | 138.5 |
| B | 11 | 51 | 138916 | 997.94 | 727 | 708 | 138.5 |
| B | 4 | 206 | 115424 | 828.31 | 727 | 708 | 138.5 |
| C | 15 | 208 | 387730 | 2146.48 | 773 | 775 | 180.3 |
| C | 3 | 233 | 287302 | 1589.4 | 773 | 775 | 180.3 |
| C | 4 | 175 | 40525 | 220.5 | 773 | 775 | 180.3 |
| D | 1 | 52 | 392307 | 2106.22 | 765 | 742 | 185.9 |
| D | 2 | 33 | 121885 | 651.62 | 765 | 742 | 185.9 |
| D | 10 | 199 | 84949 | 452.95 | 765 | 742 | 185.9 |
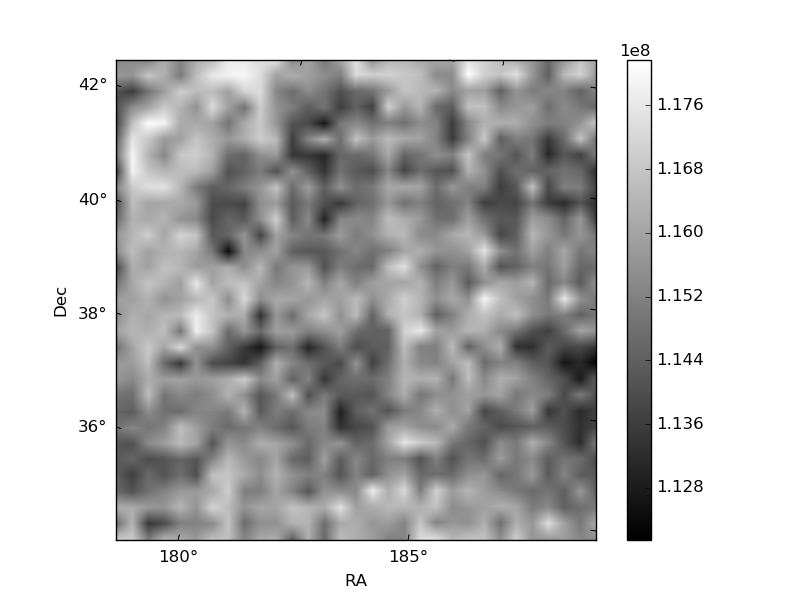
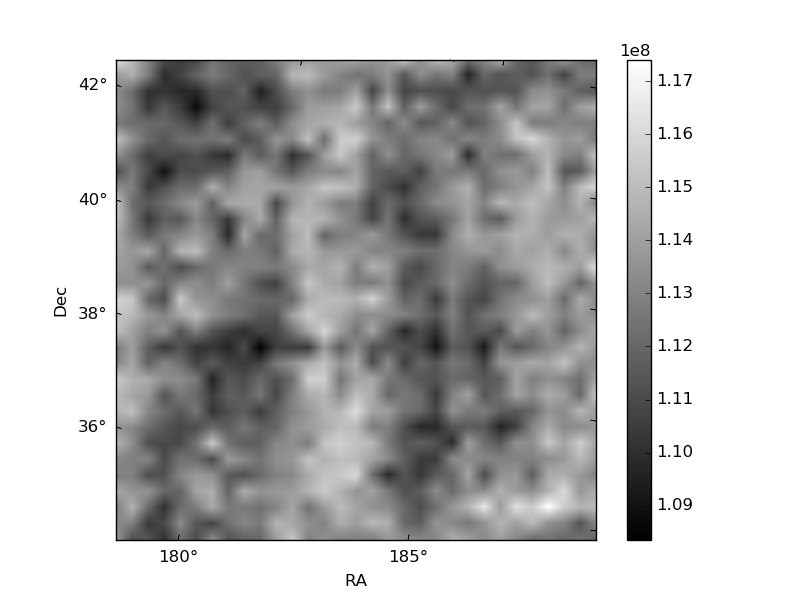
Histogram calculated using DETX and DETY for each event in the final _common_clean file
| Quadrant A |  |
 |
Quadrant B |
|---|---|---|---|
| Quadrant D | 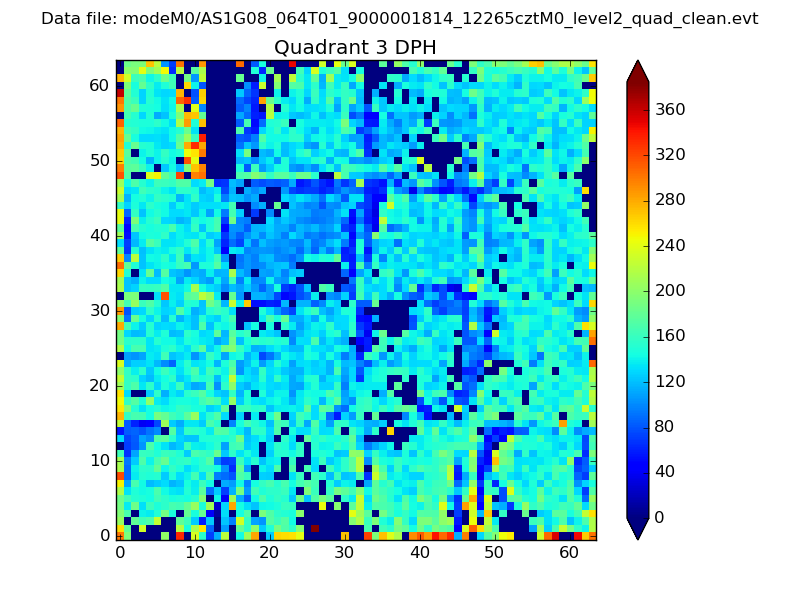 |
 |
Quadrant C |
| Plot type | Count rate plots | Images |
|---|---|---|
| Comparison with Poisson distribution Blue bars denote a histogram of data divided into 1 sec bins. Red curve is a Poisson curve with rate = median count rate of data. |
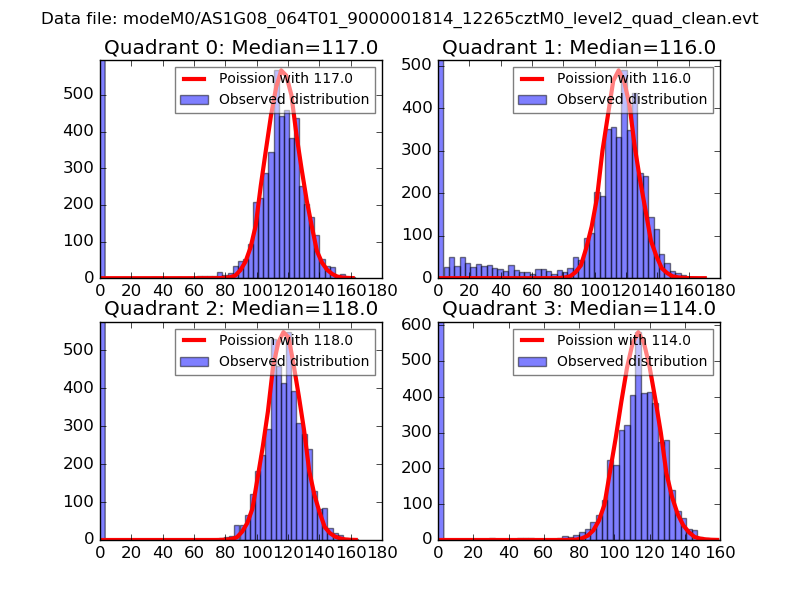 |
 |
| Quadrant-wise count rates Data is divided into 100 sec bins |
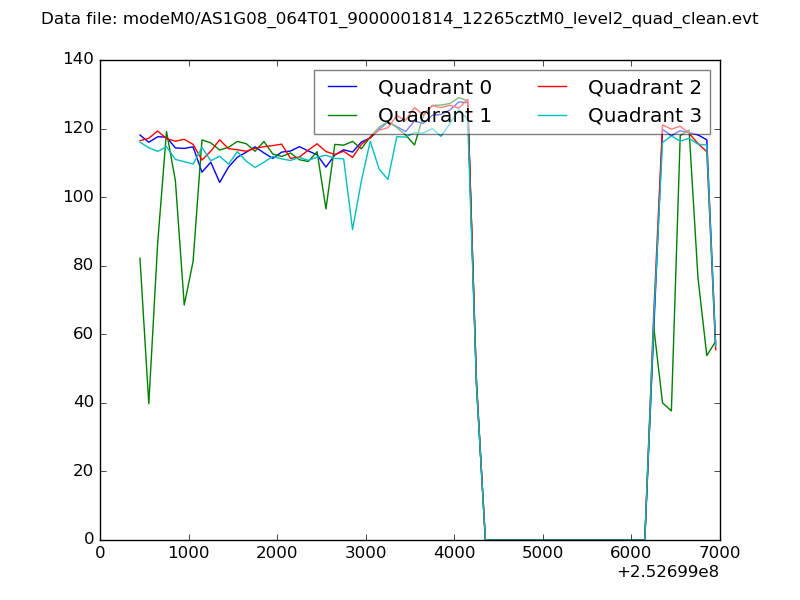 |
|
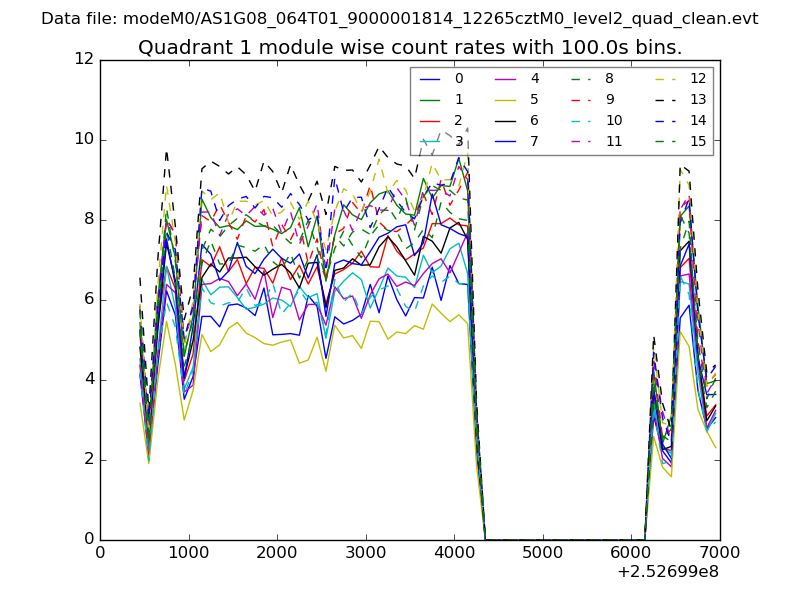
| Module-wise count rates for Quadrant A Data is divided into 100 sec bins |
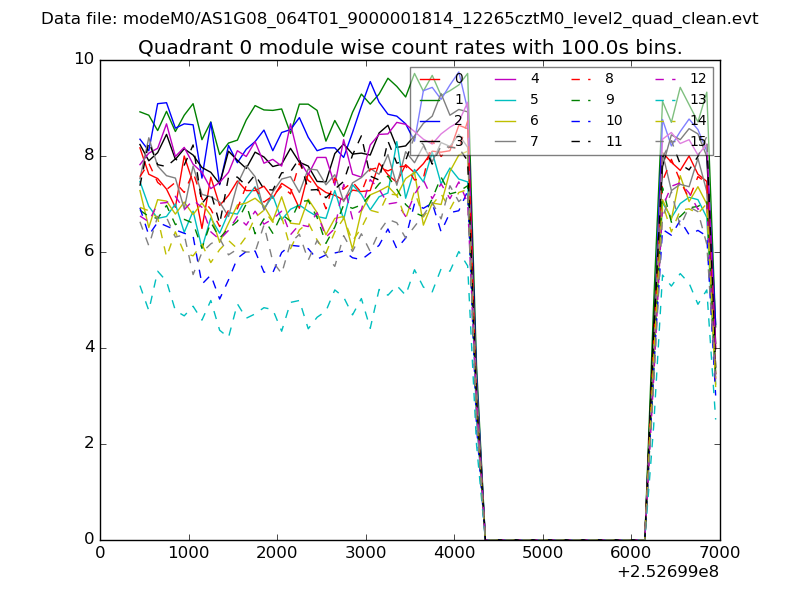 |
 |
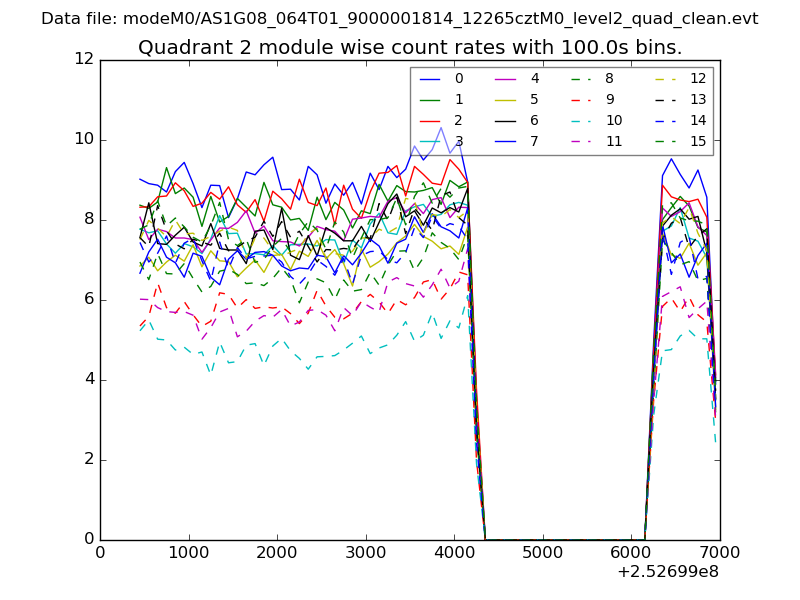
| Module-wise count rates for Quadrant B Data is divided into 100 sec bins |
 |
 |
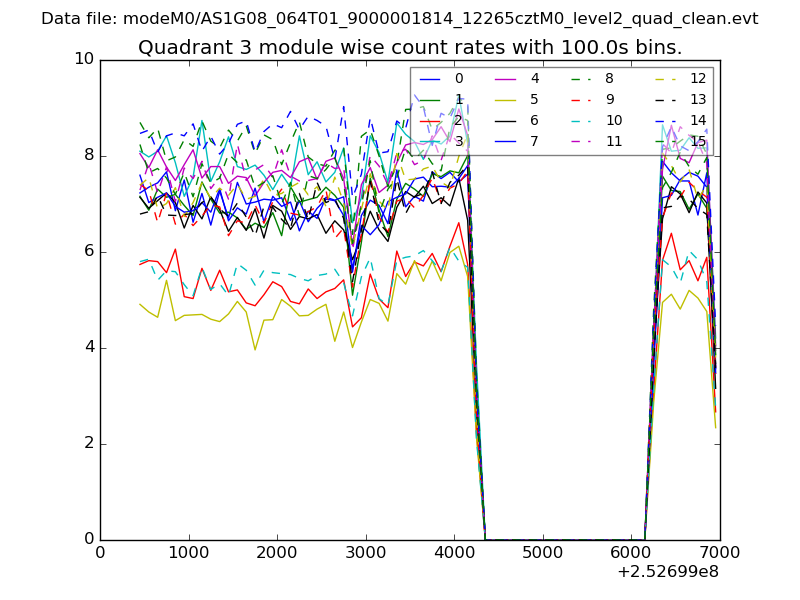
| Module-wise count rates for Quadrant C Data is divided into 100 sec bins |
 |
 |
| Module-wise count rates for Quadrant D Data is divided into 100 sec bins |
 |
 |
| Parameter | Plot |
|---|---|
| CZT HV Monitor | 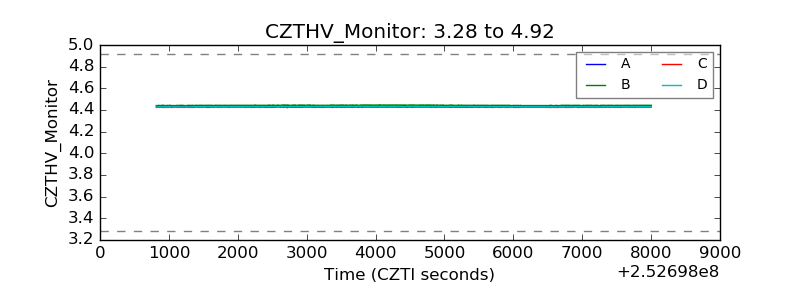 |
| D_VDD | 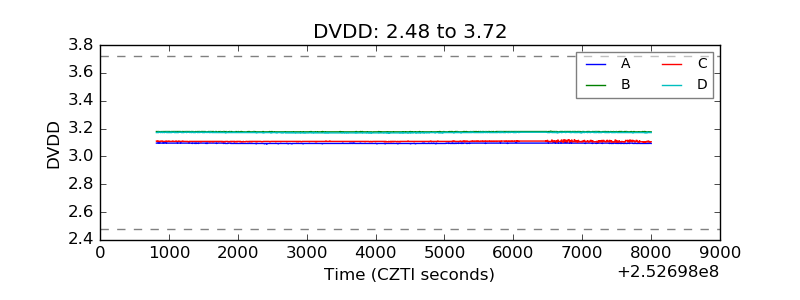 |
| Temperature 1 | 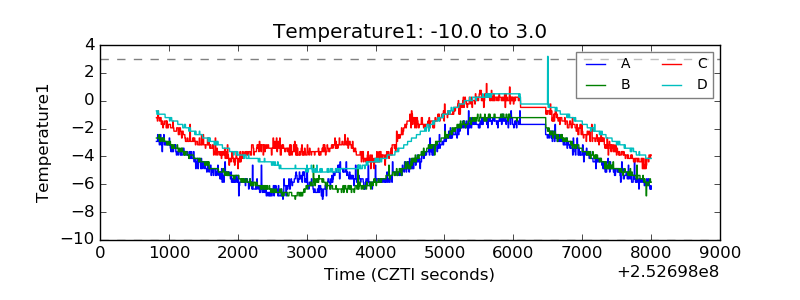 |
| Veto HV Monitor | 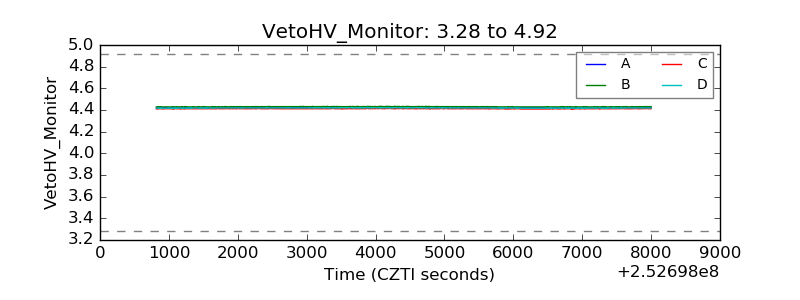 |
| Veto LLD | 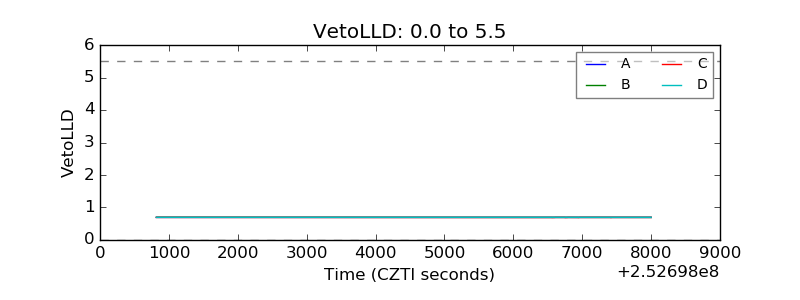 |
| Alpha Counter | 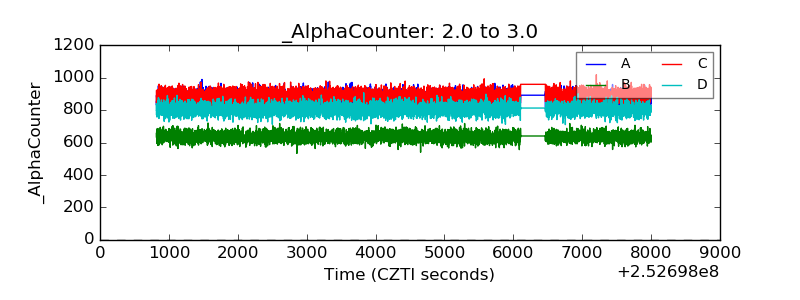 |
| _CPM_Rate | 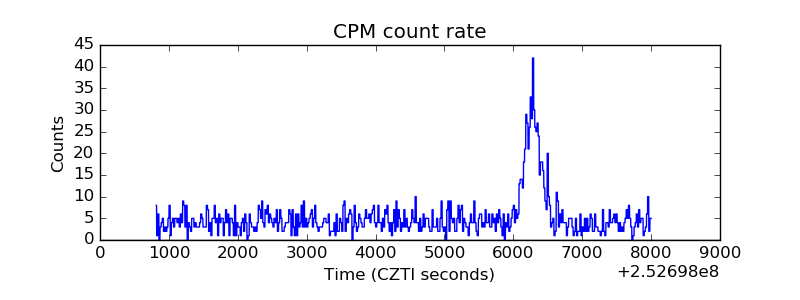 |
| CZT Counter |  |
| +2.5 Volts monitor |  |
| +5 Volts monitor | 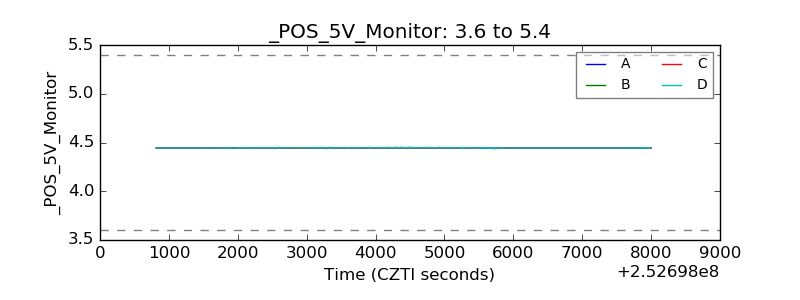 |
| _ROLL_ROT | 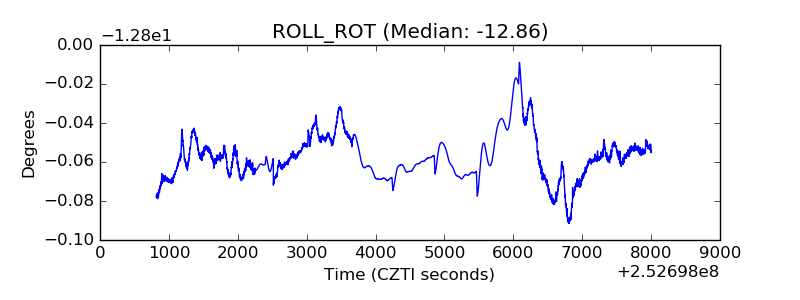 |
| _Roll_DEC | 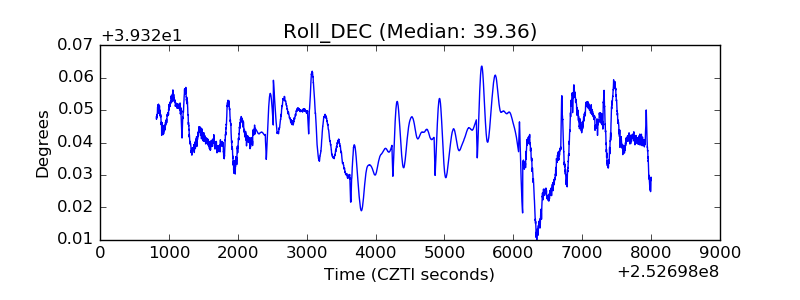 |
| _Roll_RA | 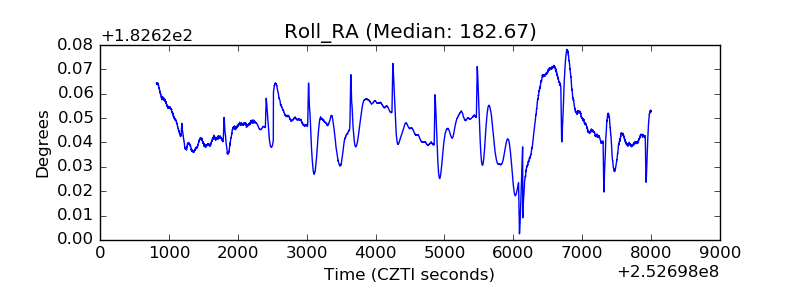 |
| Veto Counter | 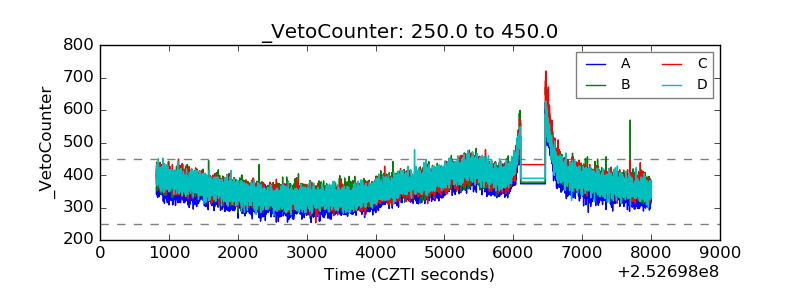 |