| Param | Original file | Final file |
|---|---|---|
| Filename | modeM0/AS1G08_064T01_9000001814_12268cztM0_level2.evt | modeM0/AS1G08_064T01_9000001814_12268cztM0_level2_quad_clean.evt |
| Size (bytes) | 674,622,720 | 99,397,440 |
| Size | 643.4 MB | 94.8 MB |
| Events in quadrant A | 5,128,528 | 618,577 |
| Events in quadrant B | 5,467,634 | 628,062 |
| Events in quadrant C | 4,175,259 | 625,147 |
| Events in quadrant D | 5,121,992 | 586,146 |
| Mode M9 | |||
|---|---|---|---|
| Quadrant | BADHDUFLAG | Total packets | Discarded packets |
| A | 0 | 17 | 3 |
| B | 0 | 15 | 1 |
| C | 0 | 17 | 3 |
| D | 0 | 16 | 2 |
| Mode SS | |||
|---|---|---|---|
| Quadrant | BADHDUFLAG | Total packets | Discarded packets |
| A | 0 | 182 | 18 |
| B | 0 | 176 | 8 |
| C | 0 | 178 | 10 |
| D | 0 | 182 | 18 |
| Mode M0 | |||
|---|---|---|---|
| Quadrant | BADHDUFLAG | Total packets | Discarded packets |
| A | 0 | 22825 | 2316 |
| B | 0 | 23859 | 2109 |
| C | 0 | 19163 | 1246 |
| D | 0 | 22681 | 1763 |
| Quadrant | Total seconds | Saturated seconds | Saturation percentage |
|---|---|---|---|
| A | 7892 | 150 | 1.900659% |
| B | 7925 | 695 | 8.769716% |
| C | 7967 | 124 | 1.556420% |
| D | 7930 | 314 | 3.959647% |
Noise dominated data is calculated using 1-second bins in cleaned event files. If a bin has >2000 counts, and if more than 50% of those come from <1% of pixels, then it is considered to be noise-dominated and hence unusable.
| Quadrant | # 1 sec bins | Bins with >0 counts | Bins with >2000 counts | High rate bins dominated by noise | Noise dominated (total time) | Noise dominated (detector-on time) | Marked lightcurve |
|---|---|---|---|---|---|---|---|
| A | 9607 | 7974 | 46 | 46 | 0.48% | 0.58% | 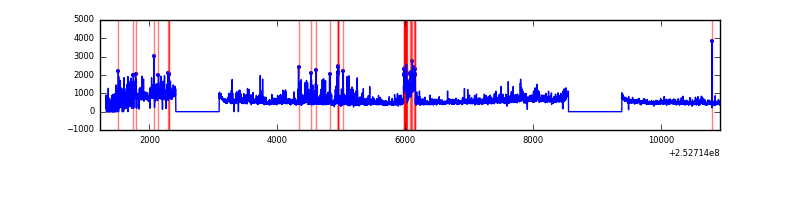 |
| B | 9689 | 7996 | 382 | 382 | 3.94% | 4.78% | 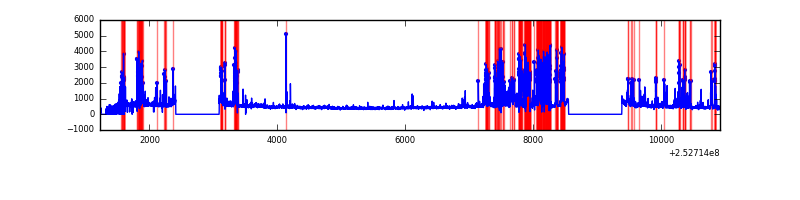 |
| C | 9667 | 8041 | 62 | 62 | 0.64% | 0.77% |  |
| D | 9702 | 8013 | 230 | 230 | 2.37% | 2.87% | 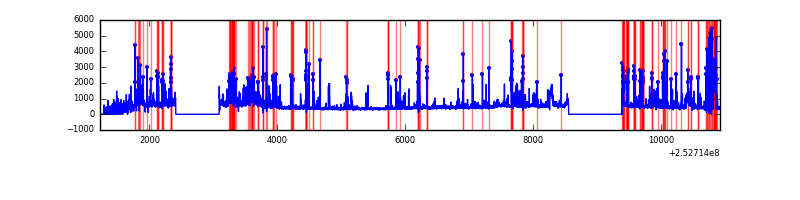 |
Top three noisy pixels from each quadrant. If the there are fewer than three noisy pixels in the level2.evt file, extra rows are filled as -1
| Pixel properties | Quadrant properties | ||||||
|---|---|---|---|---|---|---|---|
| Quadrant | DetID | PixID | Counts | Sigma | Mean | Median | Sigma |
| A | 13 | 251 | 1062525 | 5720.09 | 918 | 897 | 185.6 |
| A | 5 | 16 | 192493 | 1032.33 | 918 | 897 | 185.6 |
| A | 1 | 162 | 99239 | 529.87 | 918 | 897 | 185.6 |
| B | 4 | 239 | 1492407 | 8780.87 | 890 | 867 | 169.9 |
| B | 0 | 85 | 180290 | 1056.28 | 890 | 867 | 169.9 |
| B | 11 | 51 | 118609 | 693.16 | 890 | 867 | 169.9 |
| C | 15 | 208 | 535536 | 2528.78 | 906 | 910 | 211.4 |
| C | 3 | 233 | 76511 | 357.59 | 906 | 910 | 211.4 |
| C | 4 | 175 | 24838 | 113.18 | 906 | 910 | 211.4 |
| D | 1 | 52 | 1379325 | 6518.98 | 884 | 858 | 211.5 |
| D | 10 | 199 | 102435 | 480.37 | 884 | 858 | 211.5 |
| D | 10 | 253 | 62839 | 293.12 | 884 | 858 | 211.5 |
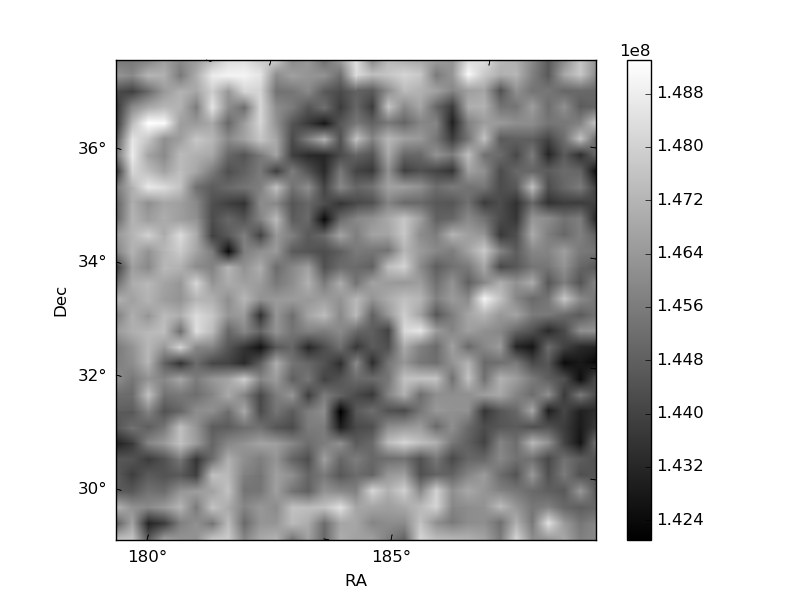
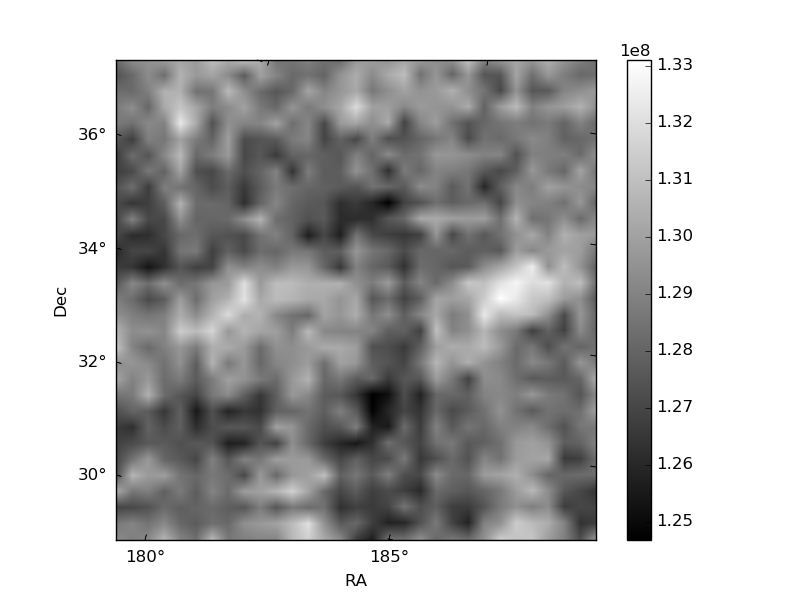
Histogram calculated using DETX and DETY for each event in the final _common_clean file
| Quadrant A | 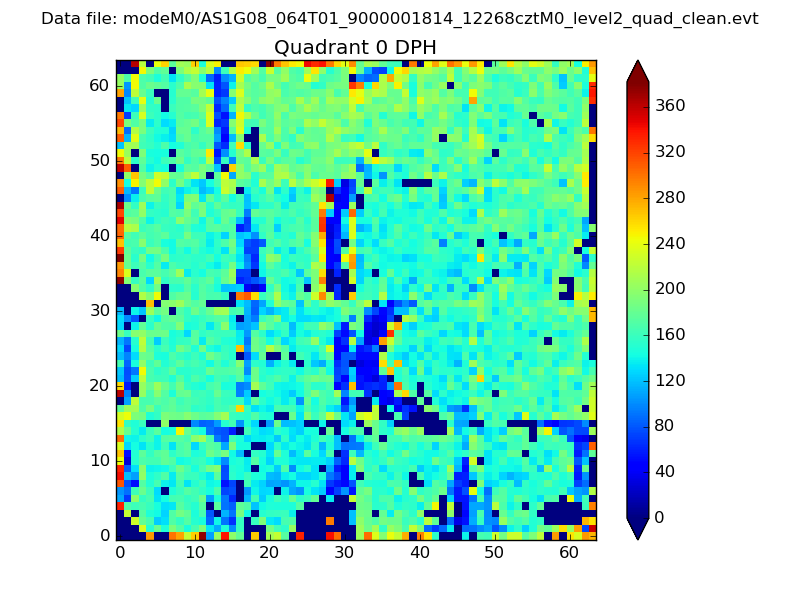 |
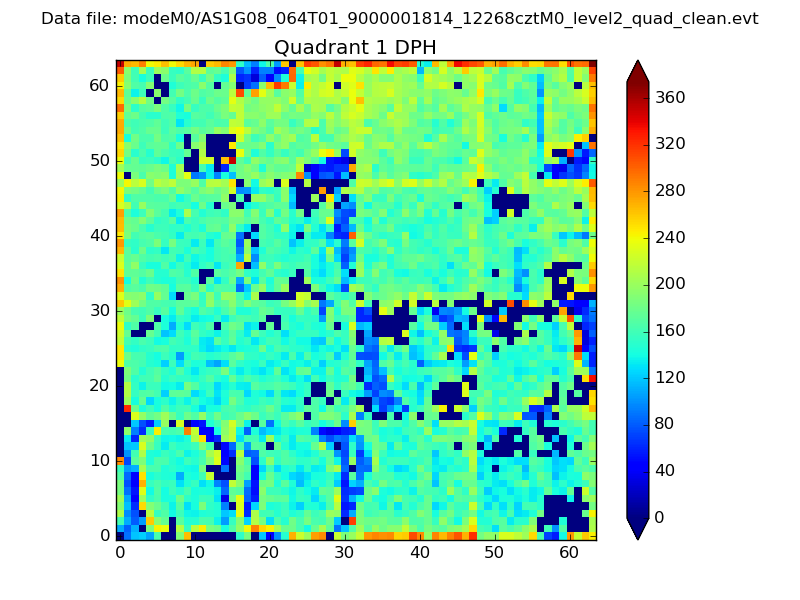 |
Quadrant B |
|---|---|---|---|
| Quadrant D |  |
 |
Quadrant C |
| Plot type | Count rate plots | Images |
|---|---|---|
| Comparison with Poisson distribution Blue bars denote a histogram of data divided into 1 sec bins. Red curve is a Poisson curve with rate = median count rate of data. |
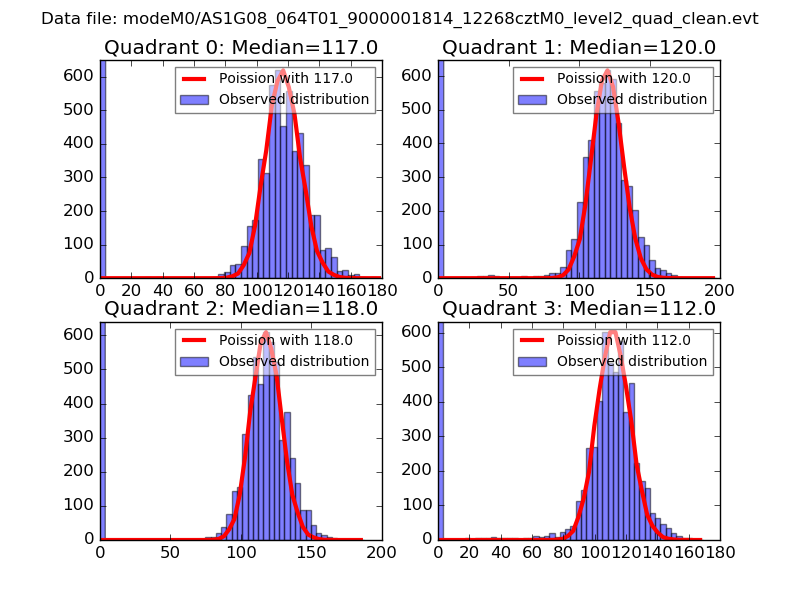 |
 |
| Quadrant-wise count rates Data is divided into 100 sec bins |
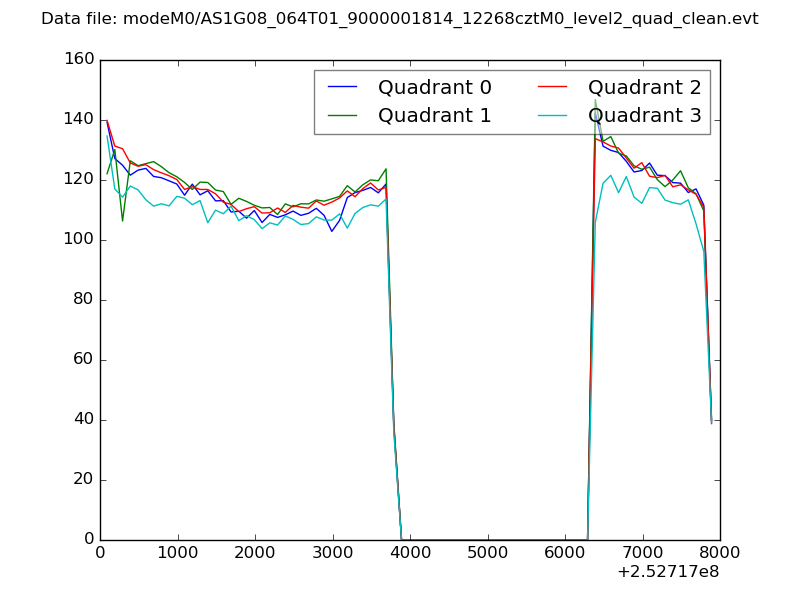 |
|
| Module-wise count rates for Quadrant A Data is divided into 100 sec bins |
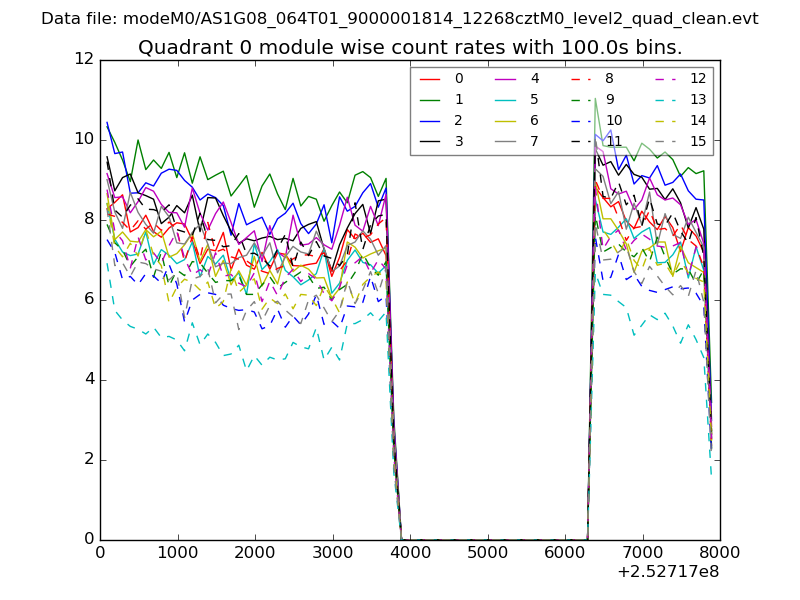 |
 |
| Module-wise count rates for Quadrant B Data is divided into 100 sec bins |
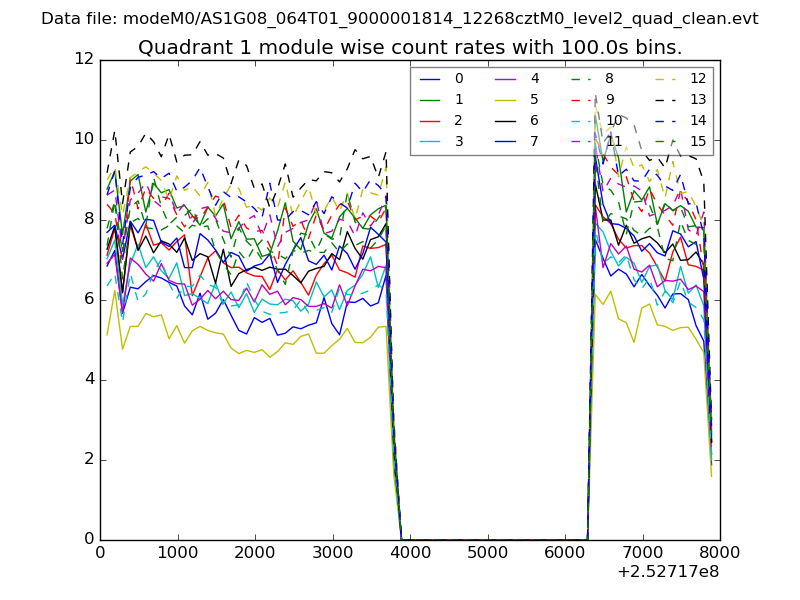 |
 |
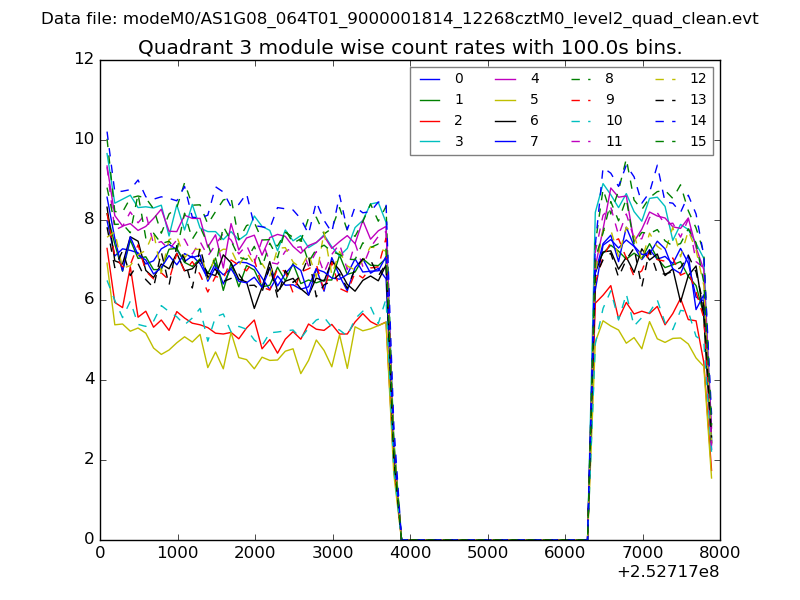
| Module-wise count rates for Quadrant C Data is divided into 100 sec bins |
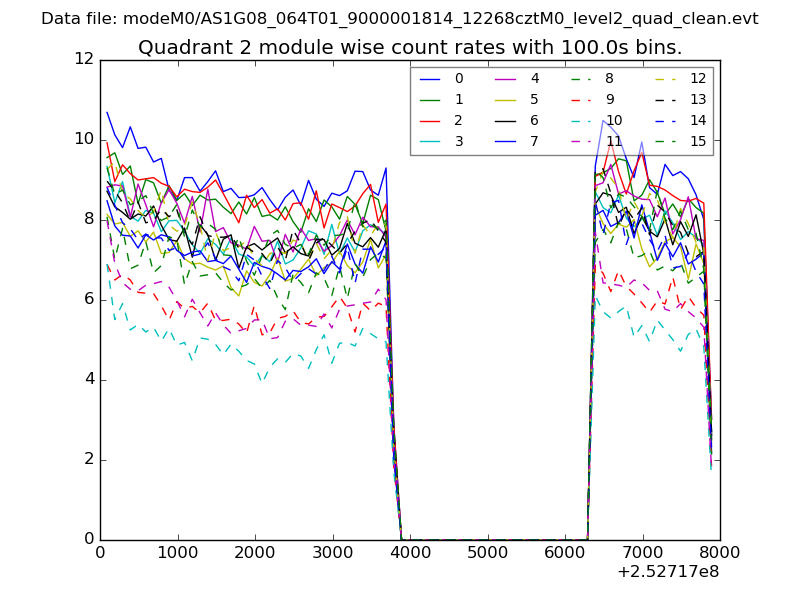 |
 |
| Module-wise count rates for Quadrant D Data is divided into 100 sec bins |
 |
 |
| Parameter | Plot |
|---|---|
| CZT HV Monitor | 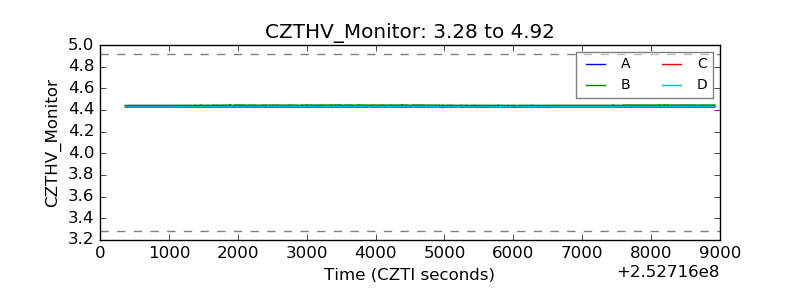 |
| D_VDD | 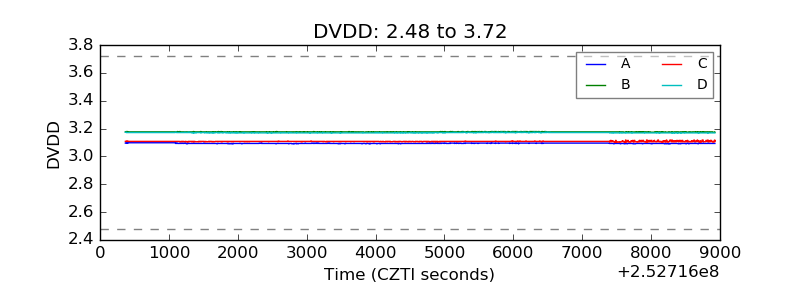 |
| Temperature 1 | 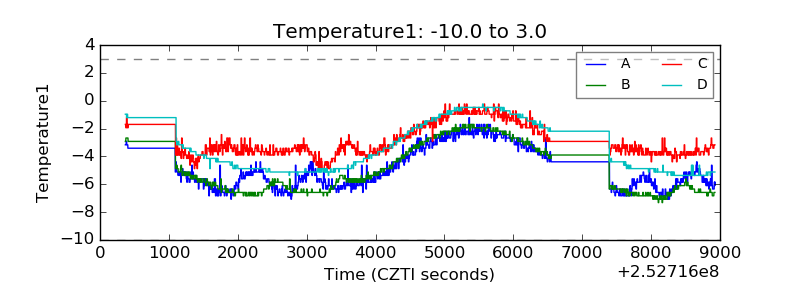 |
| Veto HV Monitor | 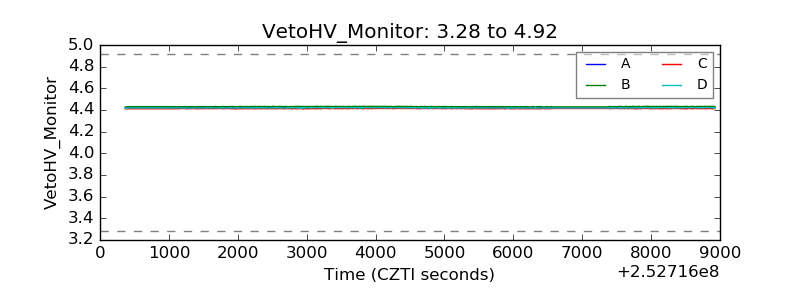 |
| Veto LLD | 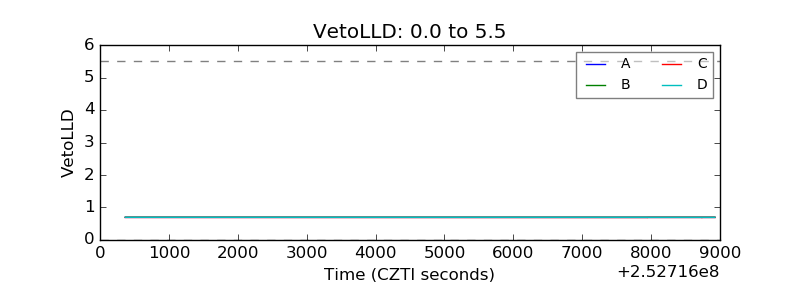 |
| Alpha Counter | 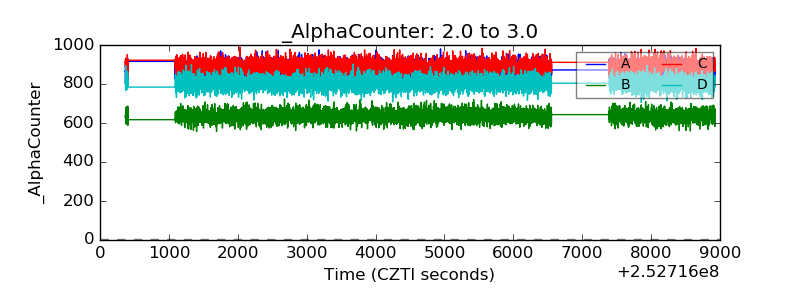 |
| _CPM_Rate | 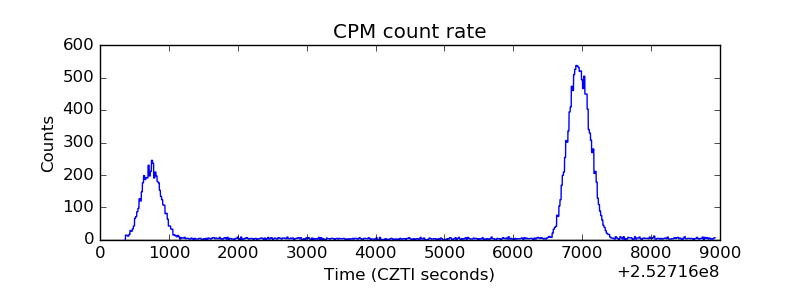 |
| CZT Counter |  |
| +2.5 Volts monitor |  |
| +5 Volts monitor |  |
| _ROLL_ROT | 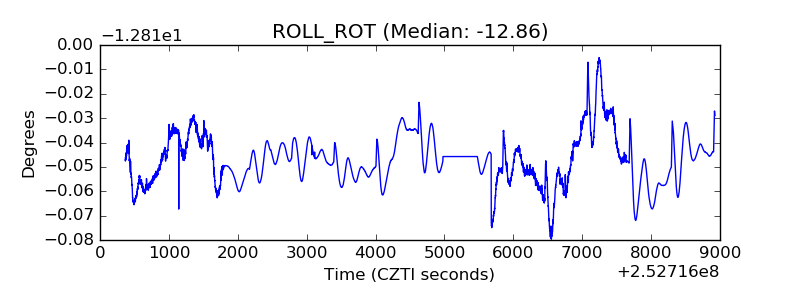 |
| _Roll_DEC | 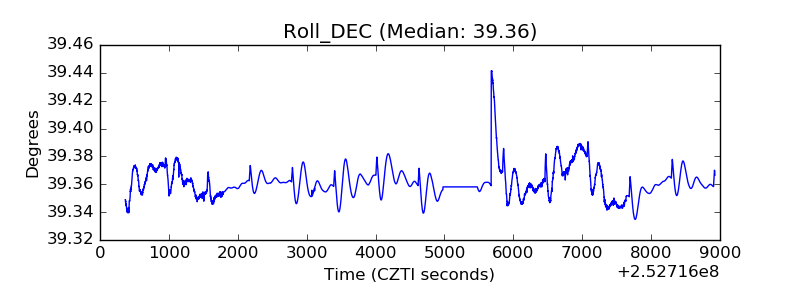 |
| _Roll_RA | 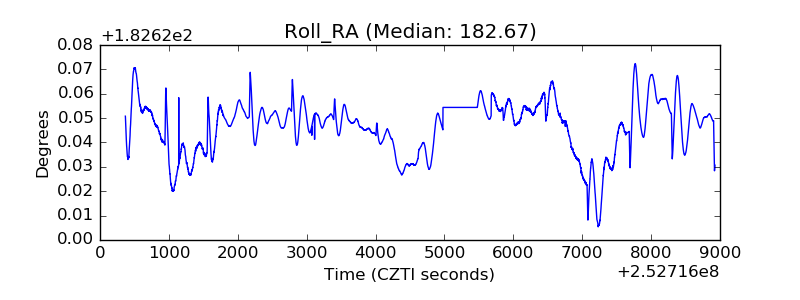 |
| Veto Counter | 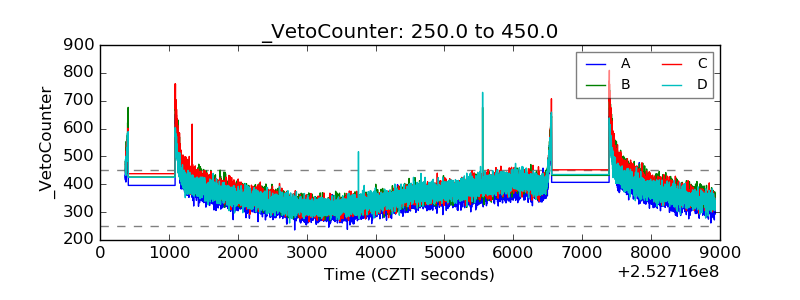 |