| Param | Original file | Final file |
|---|---|---|
| Filename | modeM0/AS1G08_064T01_9000001814_12269cztM0_level2.evt | modeM0/AS1G08_064T01_9000001814_12269cztM0_level2_quad_clean.evt |
| Size (bytes) | 4,734,720 | 1,031,040 |
| Size | 4.5 MB | 1006.9 KB |
| Events in quadrant A | 30,565 | 3,352 |
| Events in quadrant B | 32,702 | 4,616 |
| Events in quadrant C | 44,148 | 5,304 |
| Events in quadrant D | 27,550 | 4,050 |
| Mode M9 | |||
|---|---|---|---|
| Quadrant | BADHDUFLAG | Total packets | Discarded packets |
| A | 0 | 10 | 7 |
| B | 0 | 10 | 6 |
| C | 0 | 10 | 5 |
| D | 0 | 10 | 6 |
| Mode SS | |||
|---|---|---|---|
| Quadrant | BADHDUFLAG | Total packets | Discarded packets |
| A | 0 | 92 | 90 |
| B | 0 | 93 | 91 |
| C | 0 | 93 | 89 |
| D | 0 | 92 | 90 |
| Mode M0 | |||
|---|---|---|---|
| Quadrant | BADHDUFLAG | Total packets | Discarded packets |
| A | 0 | 12483 | 12364 |
| B | 0 | 12518 | 12386 |
| C | 0 | 10151 | 9963 |
| D | 0 | 11254 | 11132 |
| Quadrant | Total seconds | Saturated seconds | Saturation percentage |
|---|---|---|---|
| A | 49 | 1 | 2.040816% |
| B | 57 | 3 | 5.263158% |
| C | 89 | 0 | 0.000000% |
| D | 56 | 1 | 1.785714% |
Noise dominated data is calculated using 1-second bins in cleaned event files. If a bin has >2000 counts, and if more than 50% of those come from <1% of pixels, then it is considered to be noise-dominated and hence unusable.
| Quadrant | # 1 sec bins | Bins with >0 counts | Bins with >2000 counts | High rate bins dominated by noise | Noise dominated (total time) | Noise dominated (detector-on time) | Marked lightcurve |
|---|---|---|---|---|---|---|---|
| A | 4628 | 95 | 0 | 0 | 0.00% | 0.00% | 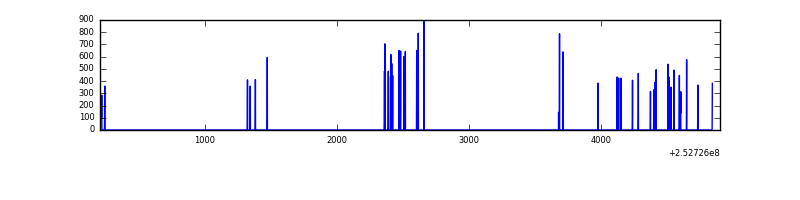 |
| B | 4689 | 107 | 0 | 0 | 0.00% | 0.00% | 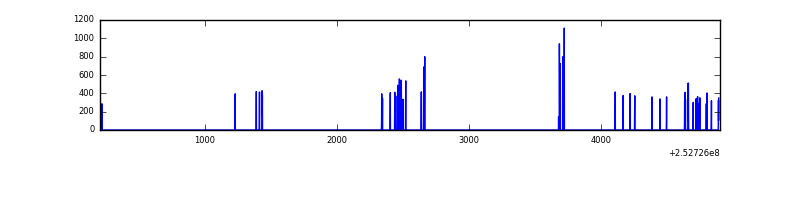 |
| C | 4675 | 169 | 0 | 0 | 0.00% | 0.00% | 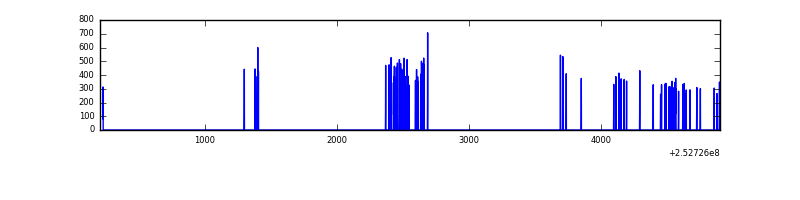 |
| D | 4666 | 107 | 0 | 0 | 0.00% | 0.00% | 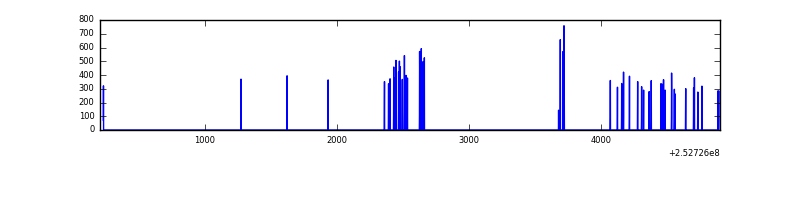 |
Top three noisy pixels from each quadrant. If the there are fewer than three noisy pixels in the level2.evt file, extra rows are filled as -1
| Pixel properties | Quadrant properties | ||||||
|---|---|---|---|---|---|---|---|
| Quadrant | DetID | PixID | Counts | Sigma | Mean | Median | Sigma |
| A | 13 | 251 | 4212 | 1502.5 | 6 | 5 | 2.8 |
| A | 1 | 162 | 795 | 282.14 | 6 | 5 | 2.8 |
| A | 1 | 178 | 523 | 185.0 | 6 | 5 | 2.8 |
| B | 4 | 239 | 2492 | 827.89 | 7 | 7 | 3.0 |
| B | 4 | 206 | 649 | 213.89 | 7 | 7 | 3.0 |
| B | 0 | 228 | 345 | 112.61 | 7 | 7 | 3.0 |
| C | 15 | 208 | 1129 | 271.03 | 10 | 10 | 4.1 |
| C | 4 | 175 | 415 | 98.1 | 10 | 10 | 4.1 |
| C | 3 | 233 | 373 | 87.92 | 10 | 10 | 4.1 |
| D | 1 | 52 | 772 | 253.74 | 6 | 6 | 3.0 |
| D | 10 | 157 | 464 | 151.71 | 6 | 6 | 3.0 |
| D | 2 | 234 | 230 | 74.2 | 6 | 6 | 3.0 |
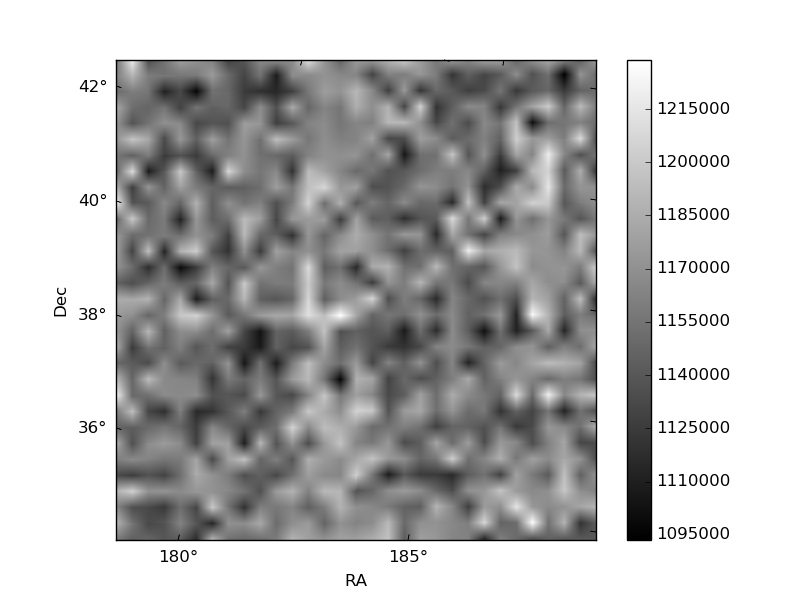
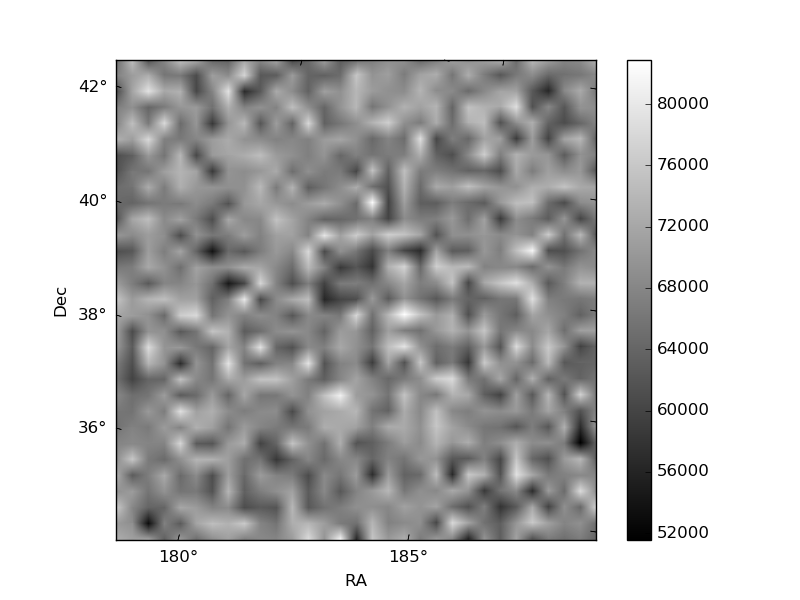
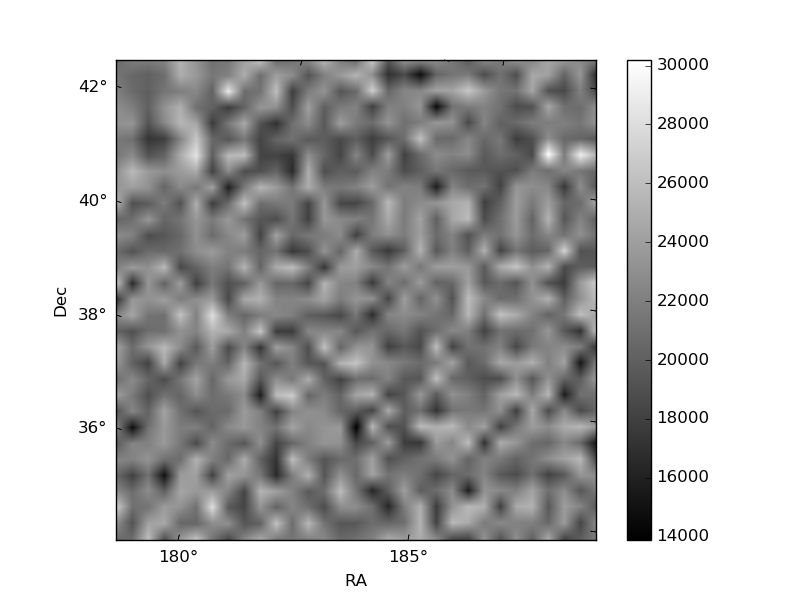
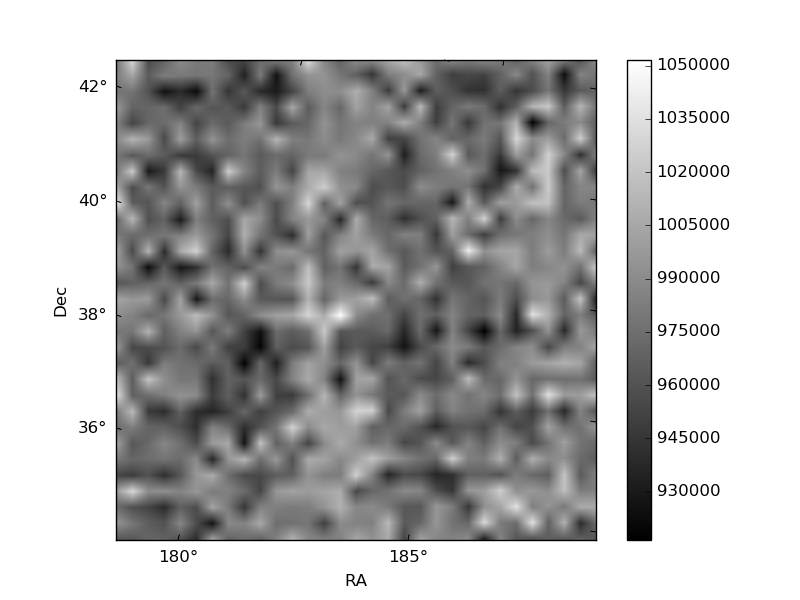
Histogram calculated using DETX and DETY for each event in the final _common_clean file
| Quadrant A | 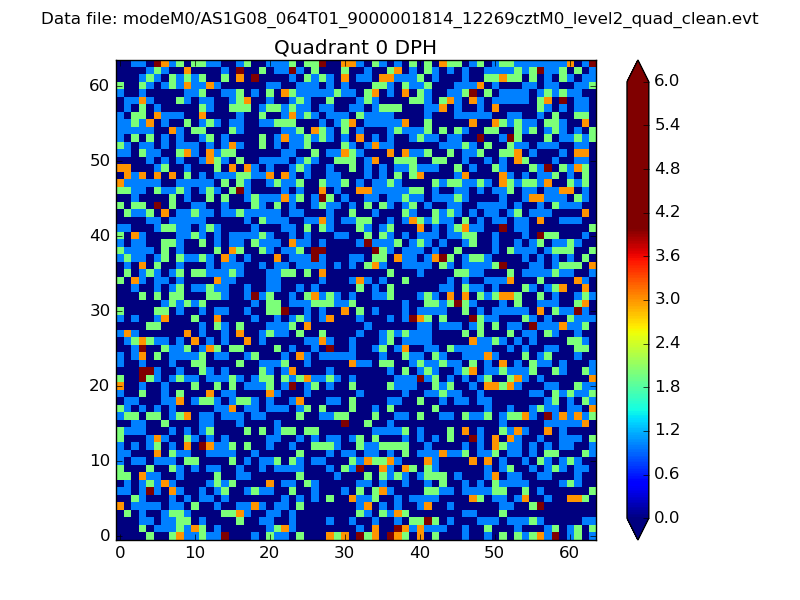 |
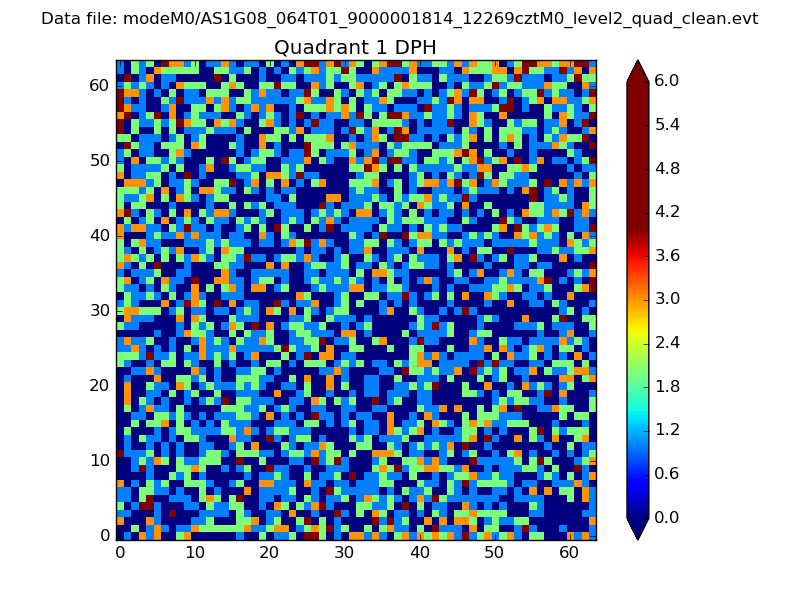 |
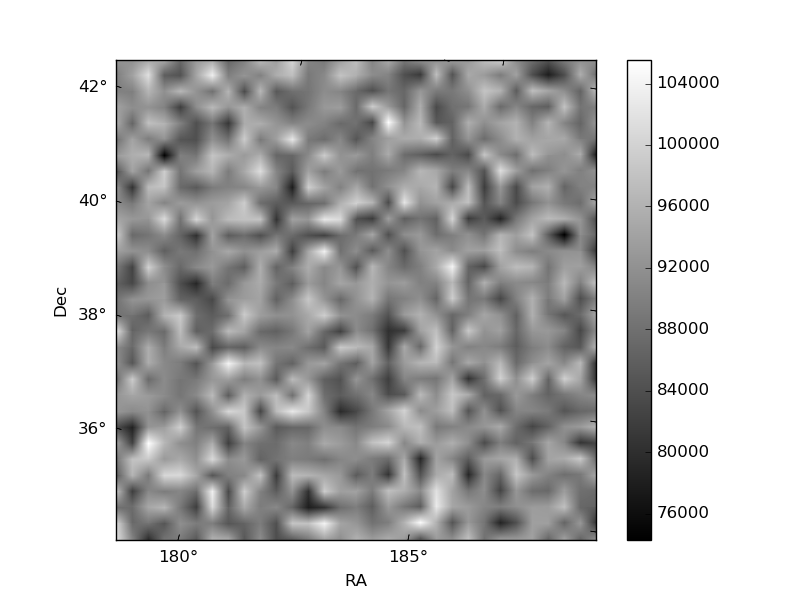
Quadrant B |
|---|---|---|---|
| Quadrant D | 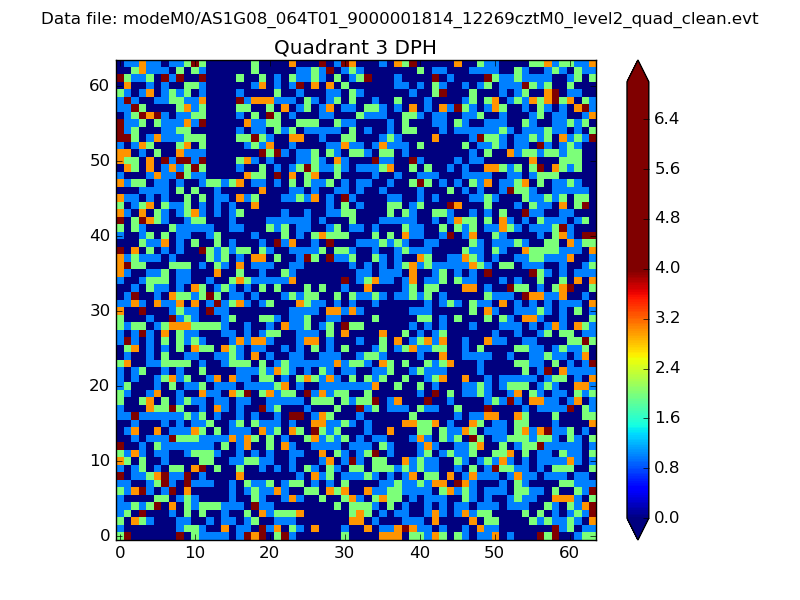 |
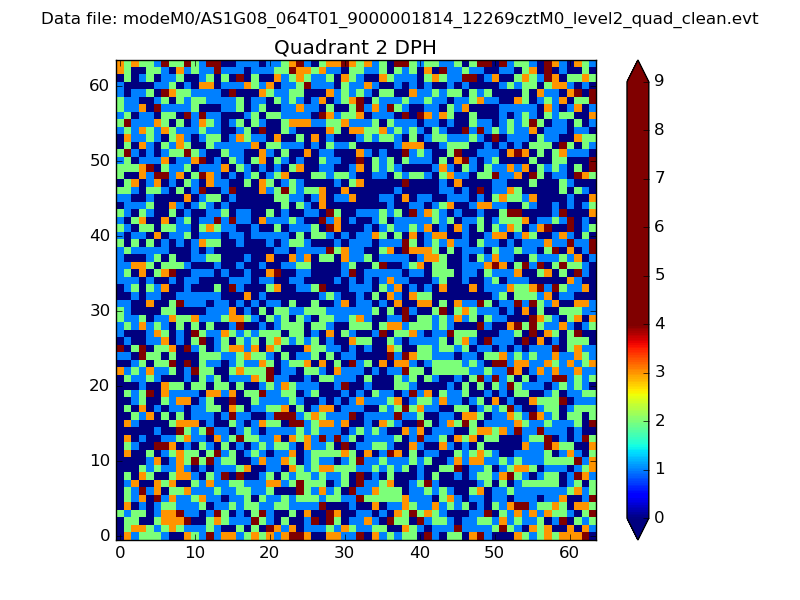 |
Quadrant C |
| Plot type | Count rate plots | Images |
|---|---|---|
| Comparison with Poisson distribution Blue bars denote a histogram of data divided into 1 sec bins. Red curve is a Poisson curve with rate = median count rate of data. |
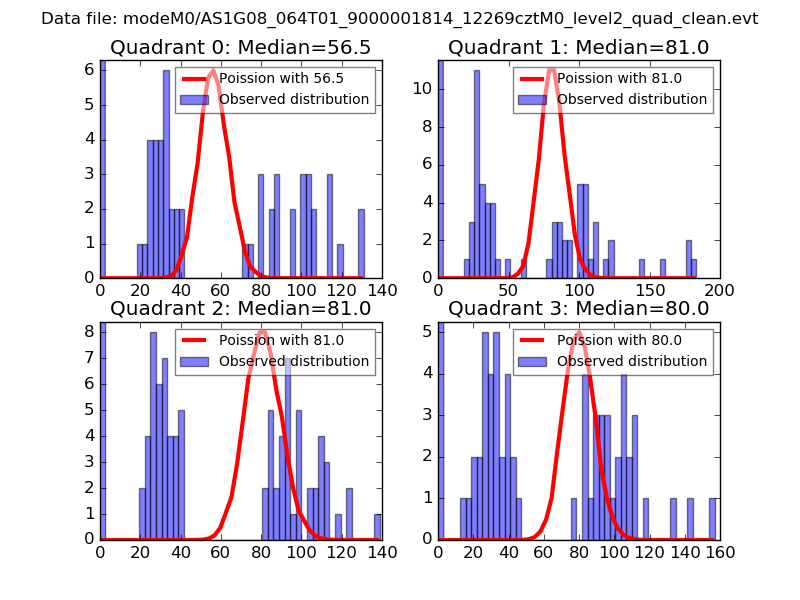 |
 |
| Quadrant-wise count rates Data is divided into 100 sec bins |
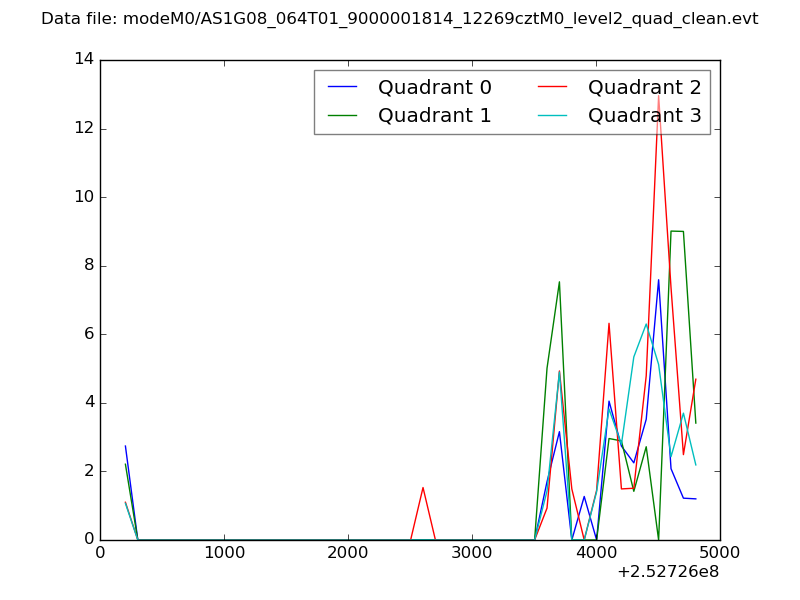 |
|
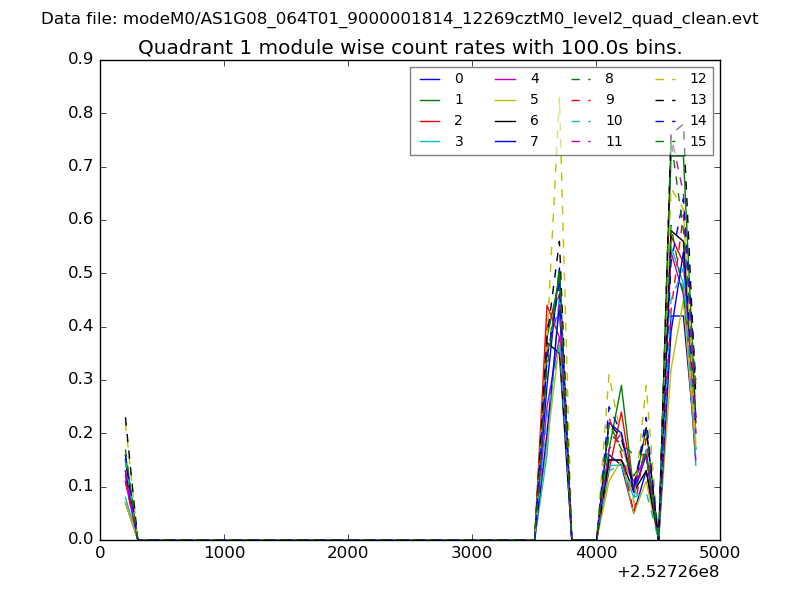
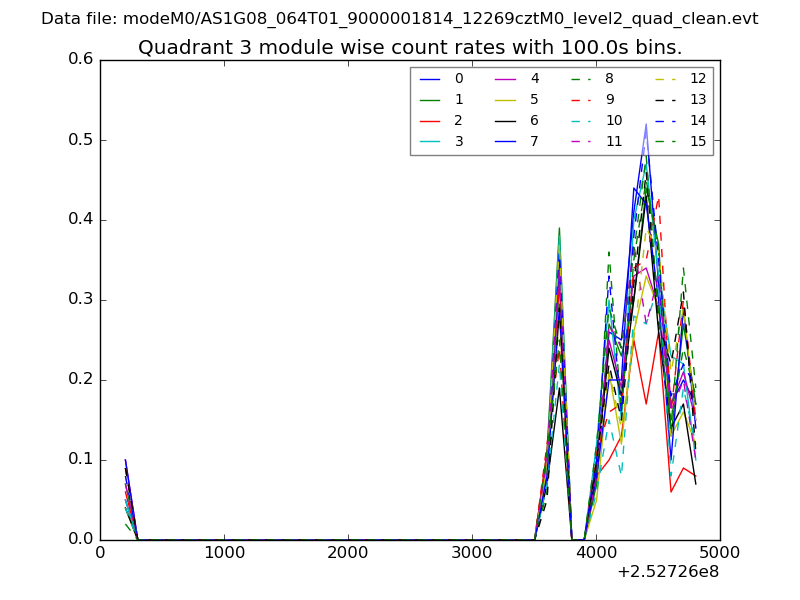
| Module-wise count rates for Quadrant A Data is divided into 100 sec bins |
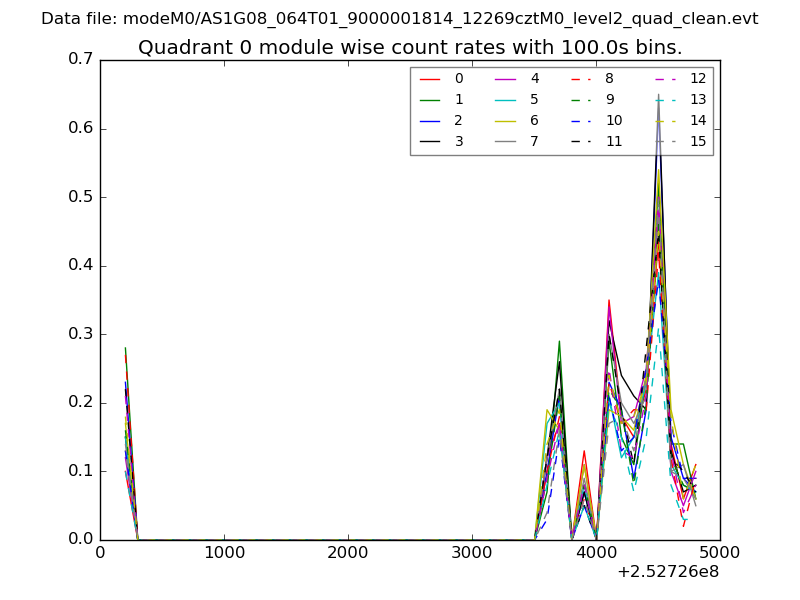 |
 |
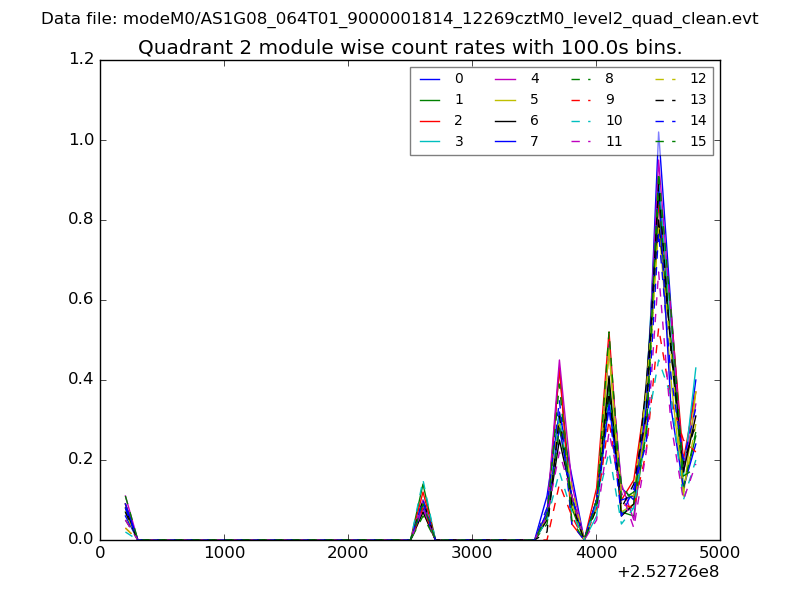
| Module-wise count rates for Quadrant B Data is divided into 100 sec bins |
 |
 |
| Module-wise count rates for Quadrant C Data is divided into 100 sec bins |
 |
 |
| Module-wise count rates for Quadrant D Data is divided into 100 sec bins |
 |
 |
| Parameter | Plot |
|---|---|
| CZT HV Monitor | 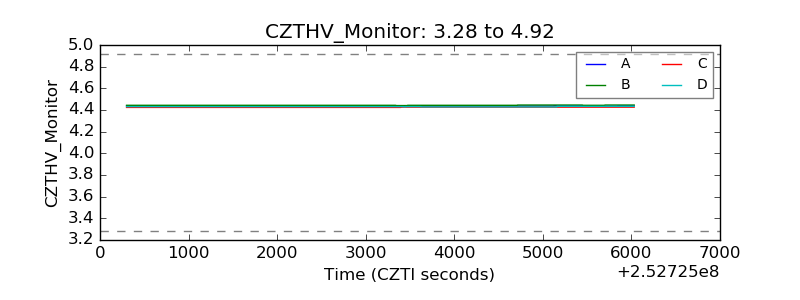 |
| D_VDD | 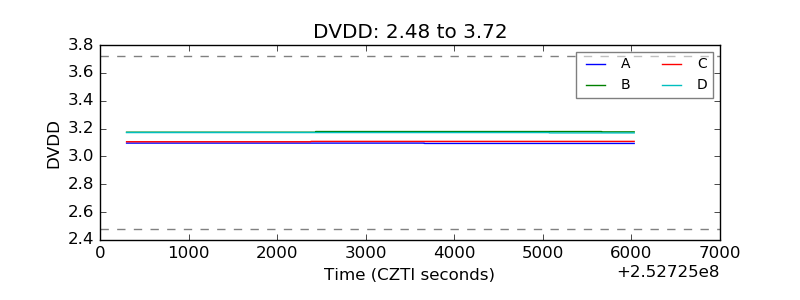 |
| Temperature 1 | 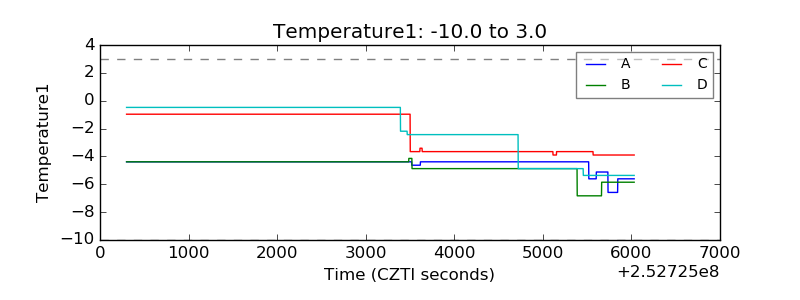 |
| Veto HV Monitor | 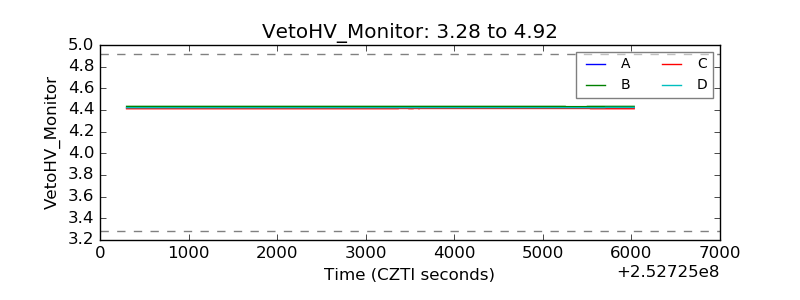 |
| Veto LLD | 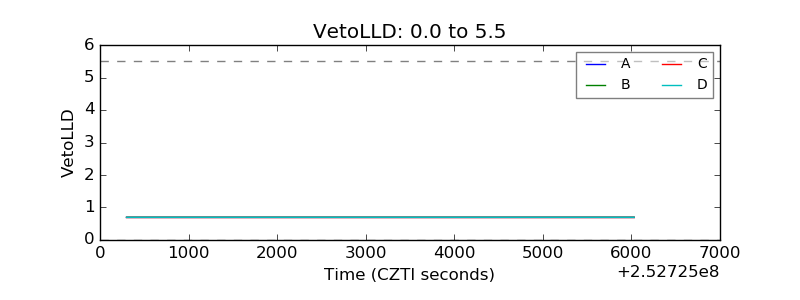 |
| Alpha Counter | 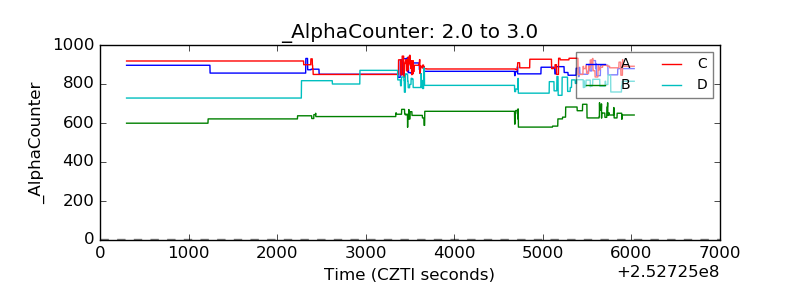 |
| _CPM_Rate | 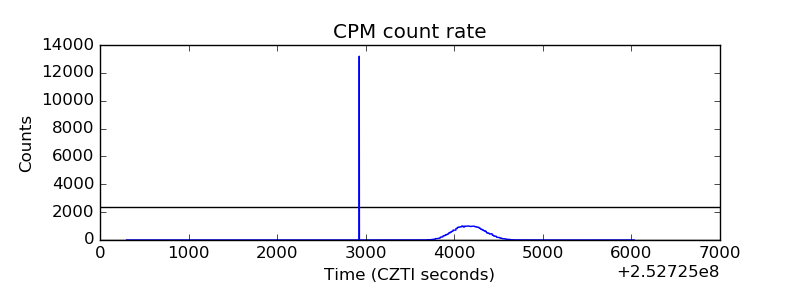 |
| CZT Counter | 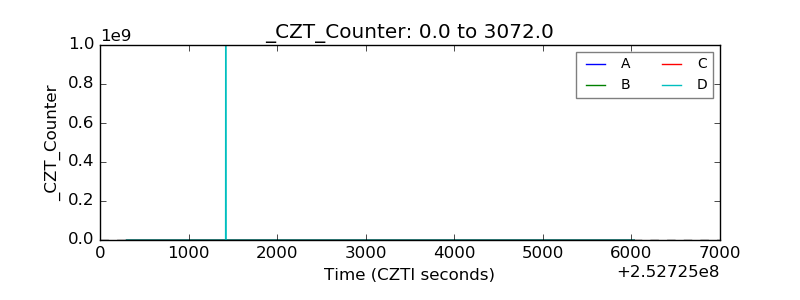 |
| +2.5 Volts monitor |  |
| +5 Volts monitor |  |
| _ROLL_ROT | 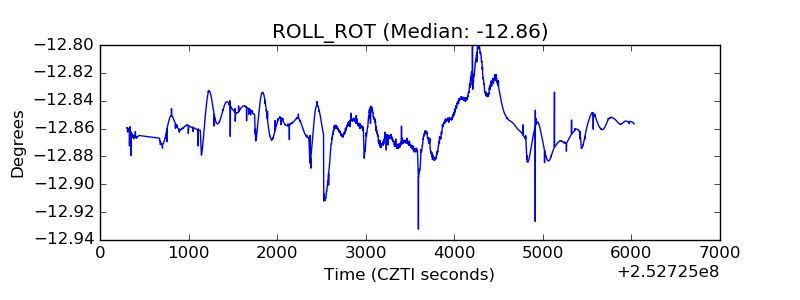 |
| _Roll_DEC | 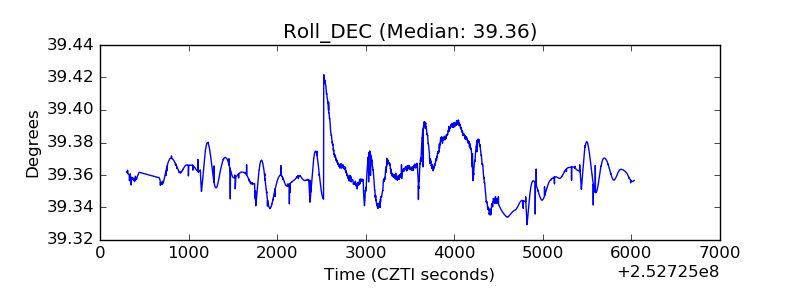 |
| _Roll_RA | 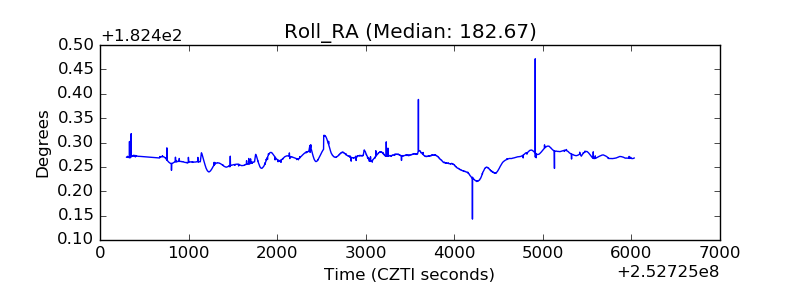 |
| Veto Counter | 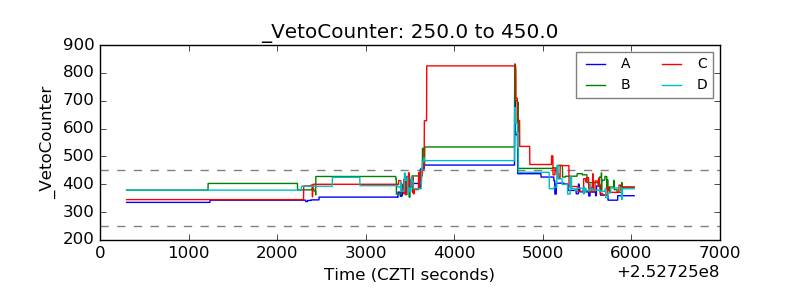 |