| Param | Original file | Final file |
|---|---|---|
| Filename | modeM0/AS1G08_064T01_9000001814_12271cztM0_level2.evt | modeM0/AS1G08_064T01_9000001814_12271cztM0_level2_quad_clean.evt |
| Size (bytes) | 2,378,416,320 | 363,922,560 |
| Size | 2.2 GB | 347.1 MB |
| Events in quadrant A | 19,145,309 | 2,287,915 |
| Events in quadrant B | 20,240,329 | 2,262,228 |
| Events in quadrant C | 13,877,084 | 2,318,810 |
| Events in quadrant D | 16,858,309 | 2,204,904 |
| Mode M9 | |||
|---|---|---|---|
| Quadrant | BADHDUFLAG | Total packets | Discarded packets |
| A | 0 | 41 | 0 |
| B | 0 | 41 | 0 |
| C | 0 | 41 | 0 |
| D | 0 | 41 | 0 |
| Mode SS | |||
|---|---|---|---|
| Quadrant | BADHDUFLAG | Total packets | Discarded packets |
| A | 0 | 576 | 0 |
| B | 0 | 576 | 0 |
| C | 0 | 576 | 0 |
| D | 0 | 576 | 0 |
| Mode M0 | |||
|---|---|---|---|
| Quadrant | BADHDUFLAG | Total packets | Discarded packets |
| A | 0 | 75962 | 6 |
| B | 0 | 79722 | 5 |
| C | 0 | 61262 | 5 |
| D | 0 | 70342 | 5 |
| Quadrant | Total seconds | Saturated seconds | Saturation percentage |
|---|---|---|---|
| A | 28342 | 712 | 2.512173% |
| B | 28342 | 2686 | 9.477101% |
| C | 28342 | 225 | 0.793875% |
| D | 28342 | 873 | 3.080234% |
Noise dominated data is calculated using 1-second bins in cleaned event files. If a bin has >2000 counts, and if more than 50% of those come from <1% of pixels, then it is considered to be noise-dominated and hence unusable.
| Quadrant | # 1 sec bins | Bins with >0 counts | Bins with >2000 counts | High rate bins dominated by noise | Noise dominated (total time) | Noise dominated (detector-on time) | Marked lightcurve |
|---|---|---|---|---|---|---|---|
| A | 32473 | 28348 | 226 | 226 | 0.70% | 0.80% |  |
| B | 32473 | 28348 | 1534 | 1534 | 4.72% | 5.41% | 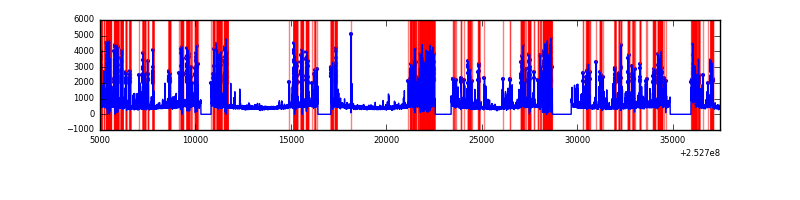 |
| C | 32473 | 28348 | 115 | 115 | 0.35% | 0.41% | 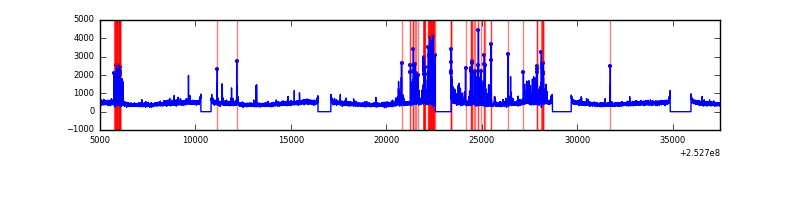 |
| D | 32473 | 28346 | 594 | 594 | 1.83% | 2.10% | 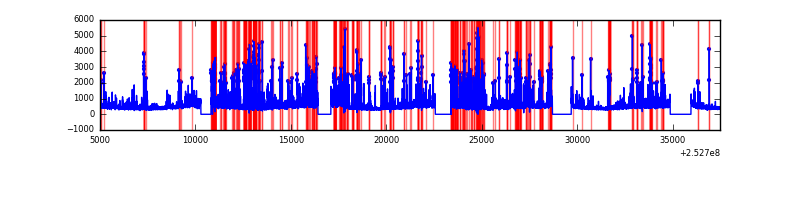 |
Top three noisy pixels from each quadrant. If the there are fewer than three noisy pixels in the level2.evt file, extra rows are filled as -1
| Pixel properties | Quadrant properties | ||||||
|---|---|---|---|---|---|---|---|
| Quadrant | DetID | PixID | Counts | Sigma | Mean | Median | Sigma |
| A | 13 | 251 | 4336487 | 6613.8 | 3246 | 3182 | 655.2 |
| A | 1 | 162 | 471439 | 714.69 | 3246 | 3182 | 655.2 |
| A | 5 | 16 | 388487 | 588.08 | 3246 | 3182 | 655.2 |
| B | 4 | 239 | 6318607 | 10816.88 | 3117 | 3044 | 583.9 |
| B | 0 | 85 | 761924 | 1299.76 | 3117 | 3044 | 583.9 |
| B | 11 | 51 | 352582 | 598.67 | 3117 | 3044 | 583.9 |
| C | 15 | 208 | 917377 | 1254.43 | 3164 | 3179 | 728.8 |
| C | 3 | 233 | 484282 | 660.15 | 3164 | 3179 | 728.8 |
| C | 4 | 175 | 97901 | 129.97 | 3164 | 3179 | 728.8 |
| D | 1 | 52 | 3094840 | 4196.01 | 3114 | 3030 | 736.8 |
| D | 13 | 249 | 314060 | 422.11 | 3114 | 3030 | 736.8 |
| D | 2 | 33 | 295263 | 396.6 | 3114 | 3030 | 736.8 |
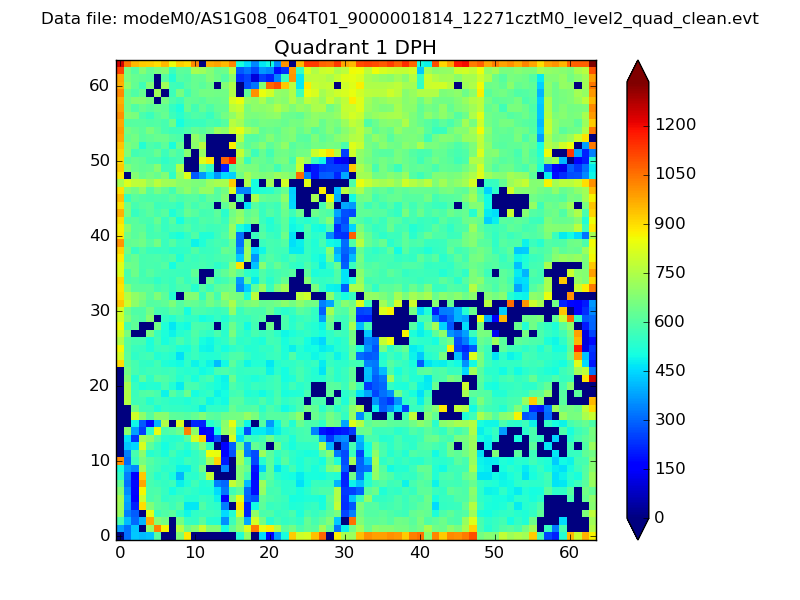
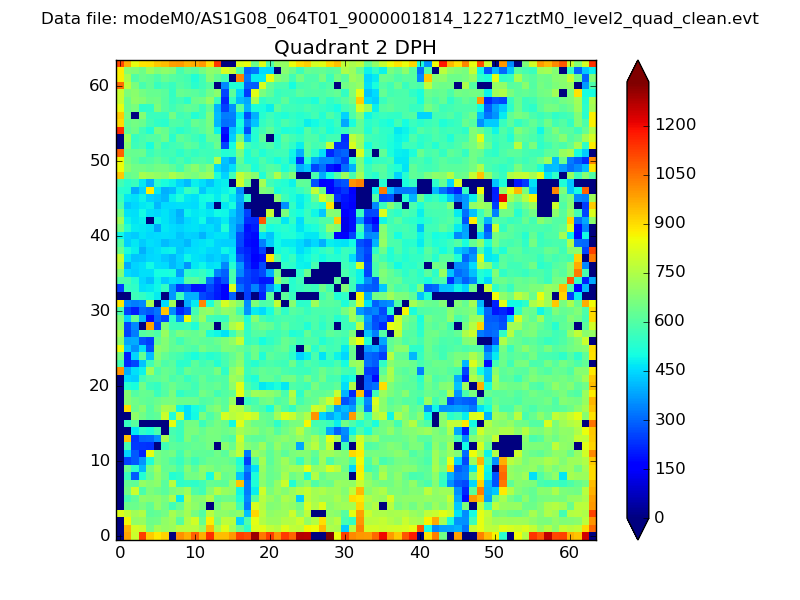
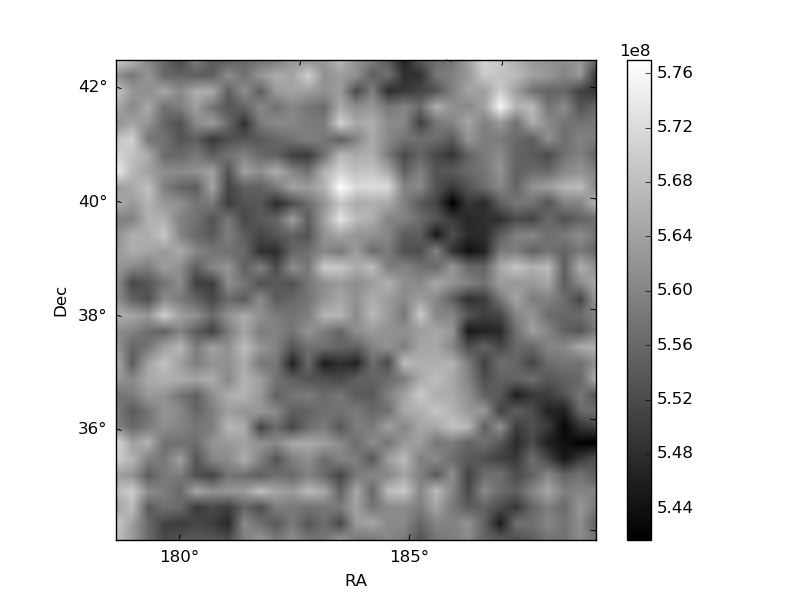
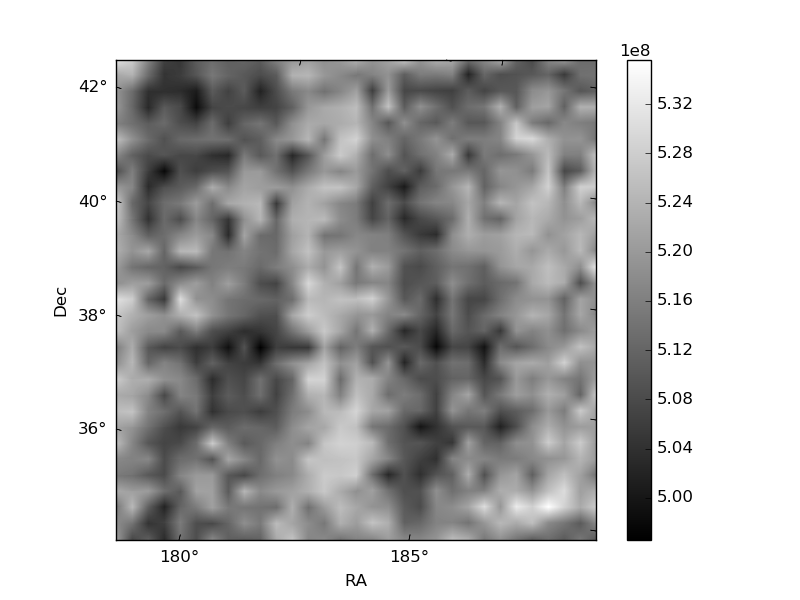
Histogram calculated using DETX and DETY for each event in the final _common_clean file
| Quadrant A | 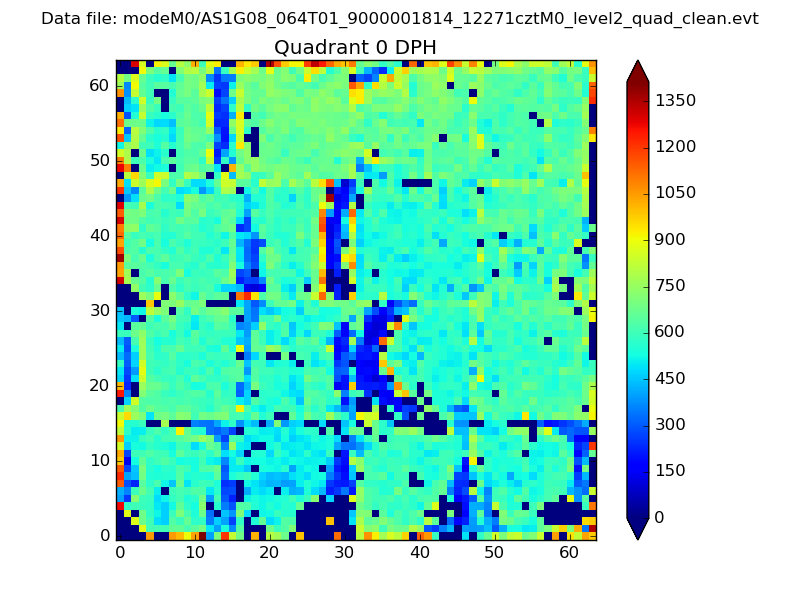 |
 |
Quadrant B |
|---|---|---|---|
| Quadrant D | 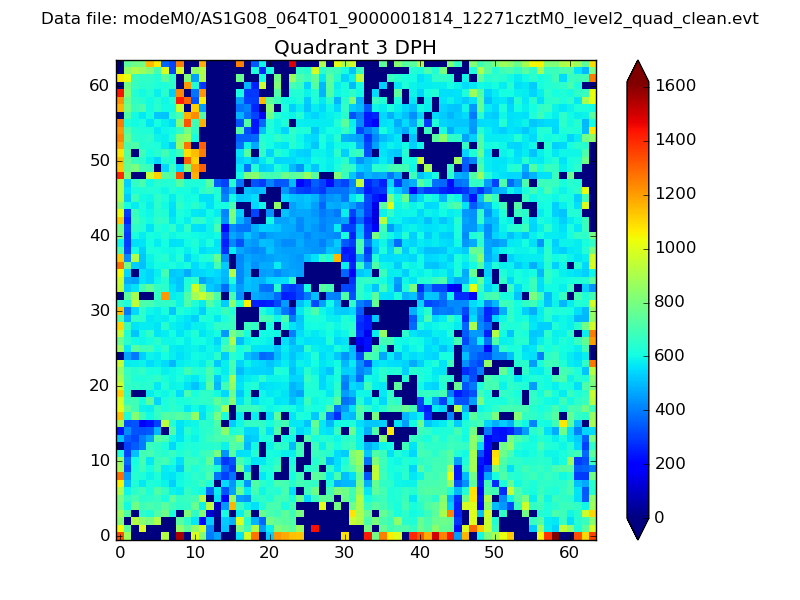 |
 |
Quadrant C |
| Plot type | Count rate plots | Images |
|---|---|---|
| Comparison with Poisson distribution Blue bars denote a histogram of data divided into 1 sec bins. Red curve is a Poisson curve with rate = median count rate of data. |
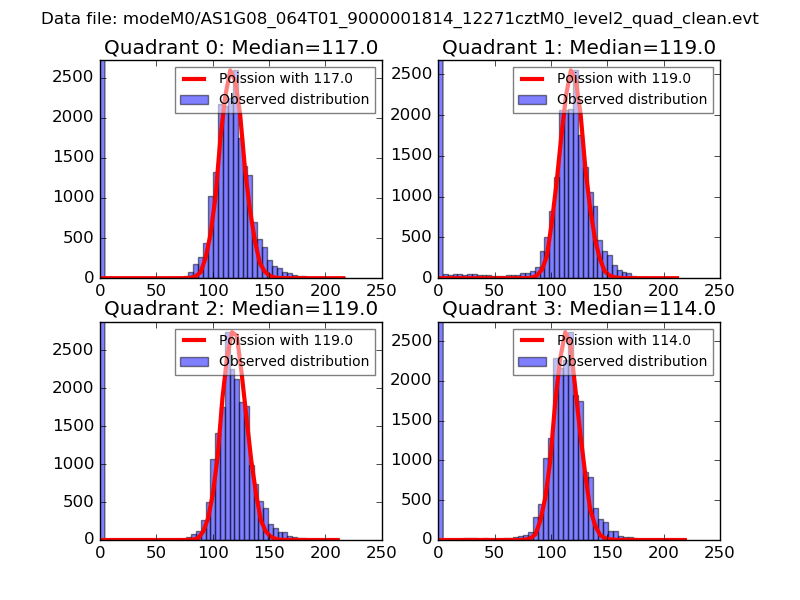 |
 |
| Quadrant-wise count rates Data is divided into 100 sec bins |
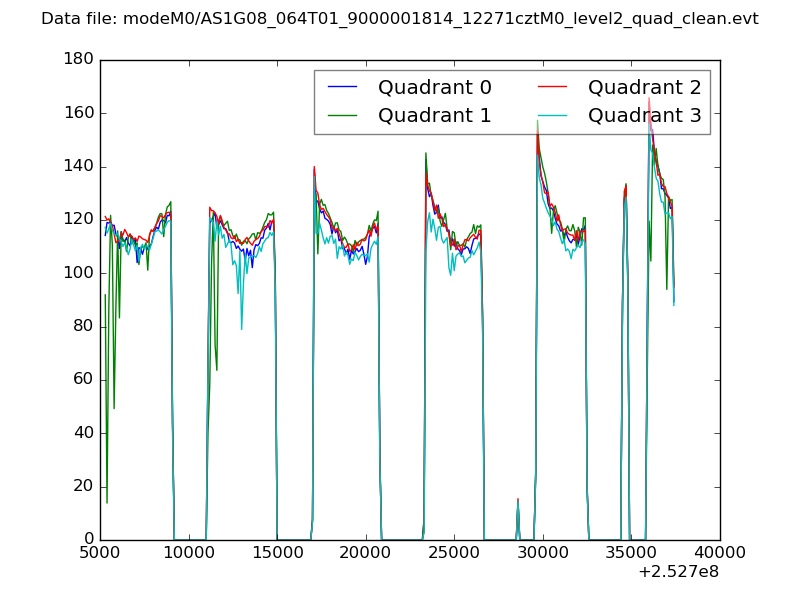 |
|
| Module-wise count rates for Quadrant A Data is divided into 100 sec bins |
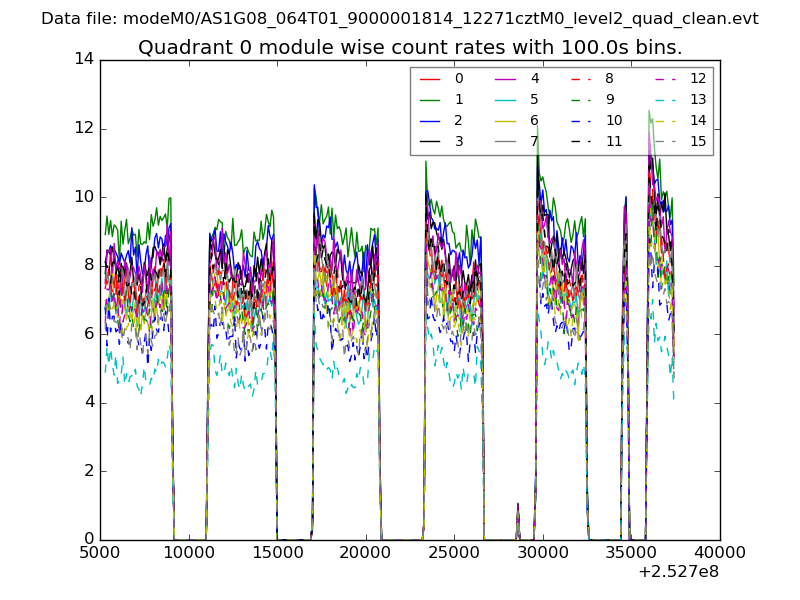 |
 |
| Module-wise count rates for Quadrant B Data is divided into 100 sec bins |
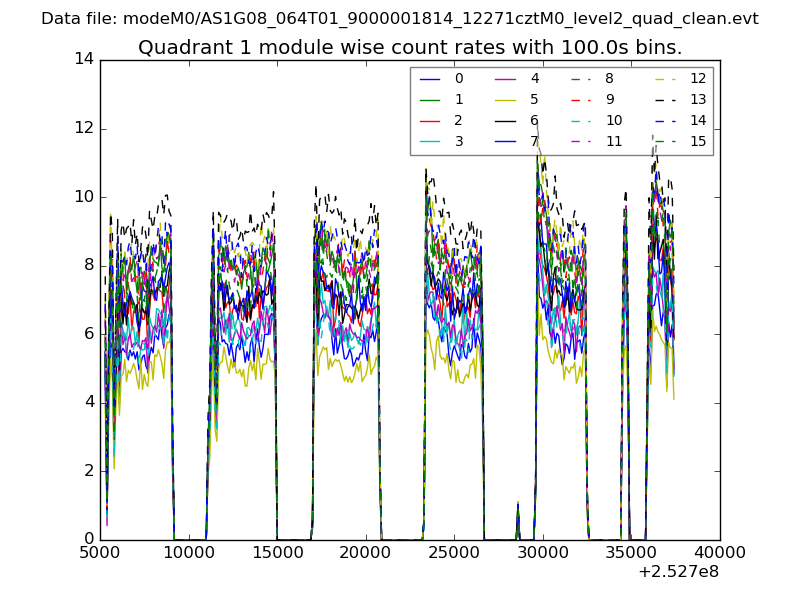 |
 |
| Module-wise count rates for Quadrant C Data is divided into 100 sec bins |
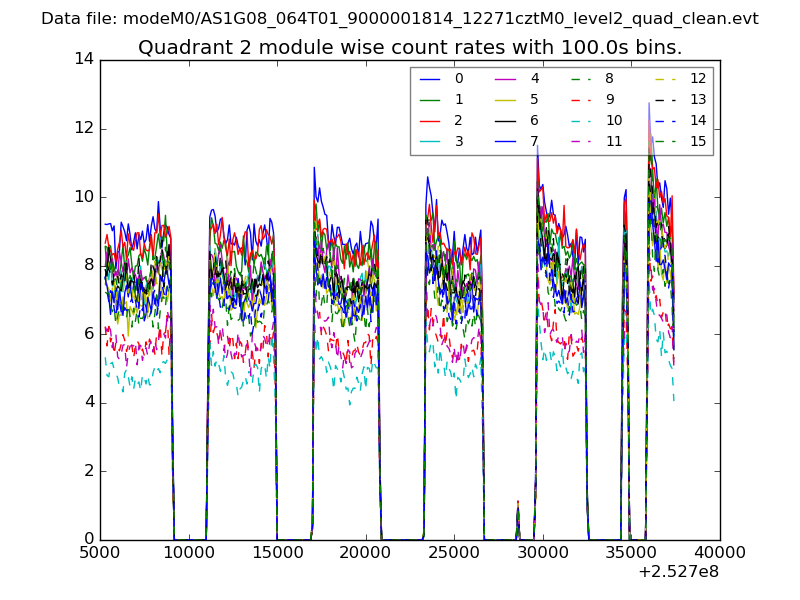 |
 |
| Module-wise count rates for Quadrant D Data is divided into 100 sec bins |
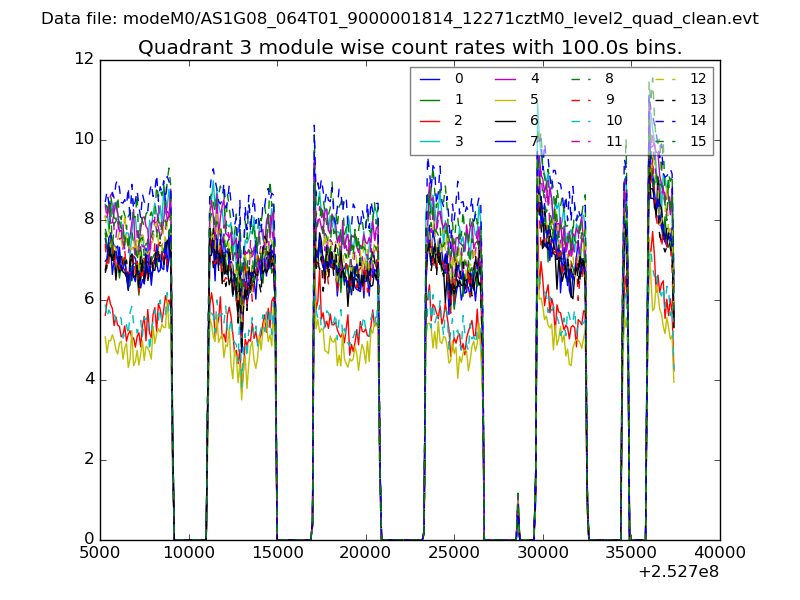 |
 |
| Parameter | Plot |
|---|---|
| CZT HV Monitor | 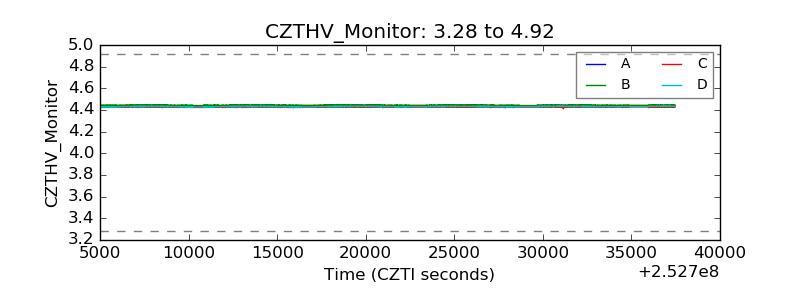 |
| D_VDD | 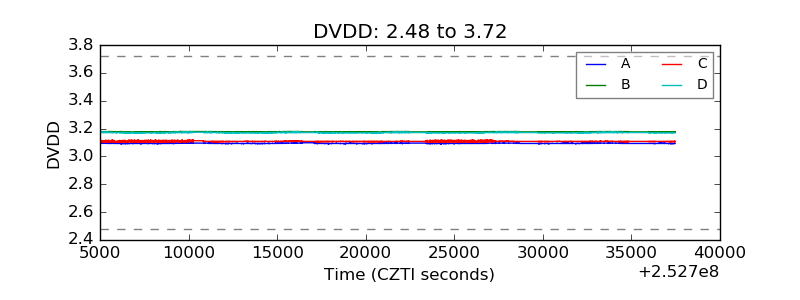 |
| Temperature 1 | 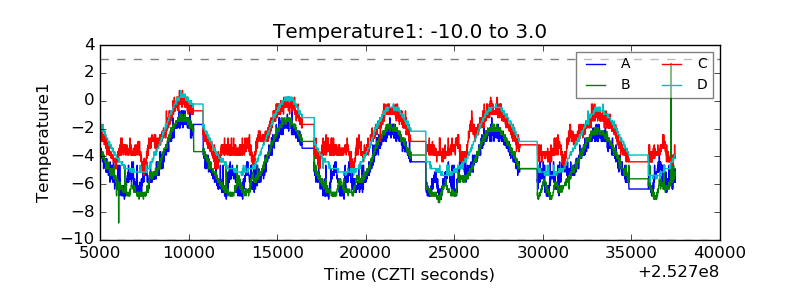 |
| Veto HV Monitor | 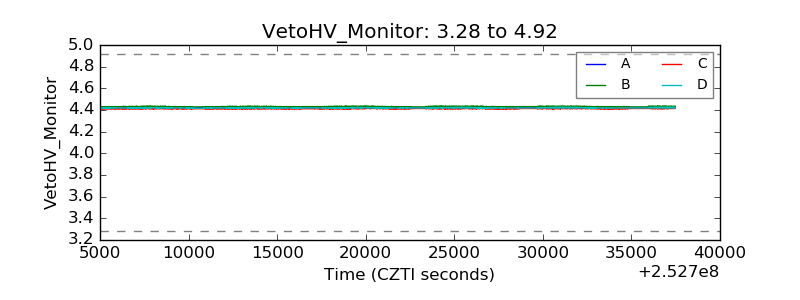 |
| Veto LLD | 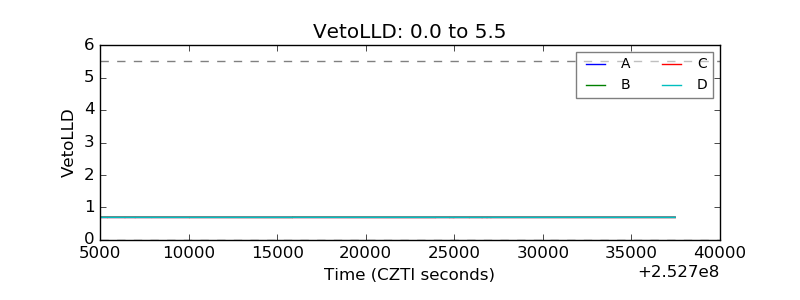 |
| Alpha Counter | 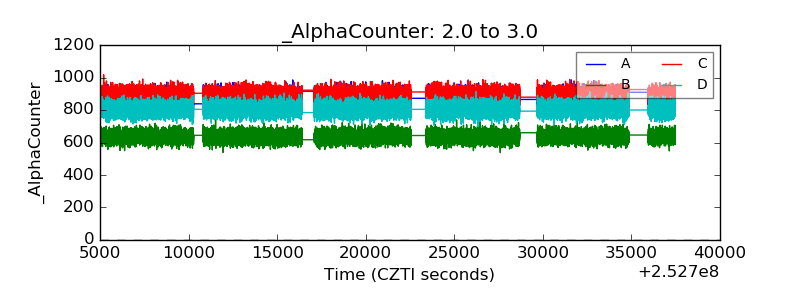 |
| _CPM_Rate | 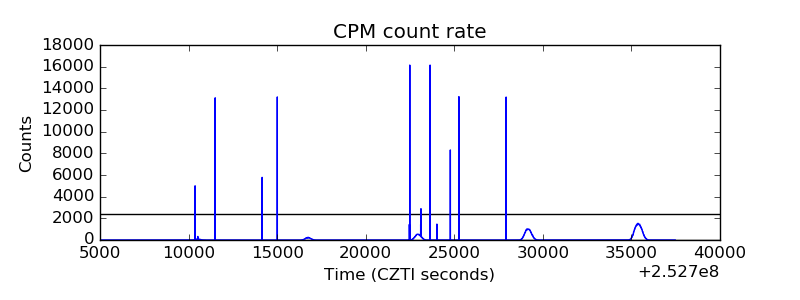 |
| CZT Counter | 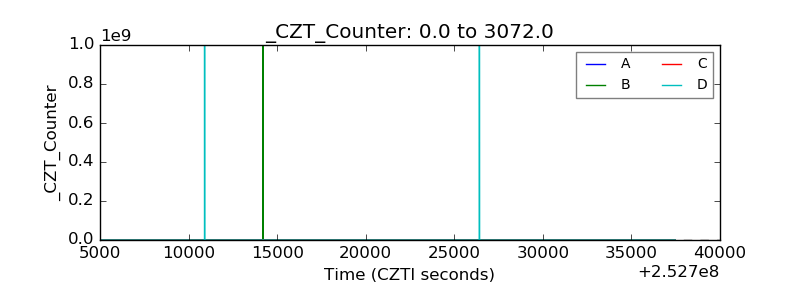 |
| +2.5 Volts monitor |  |
| +5 Volts monitor | 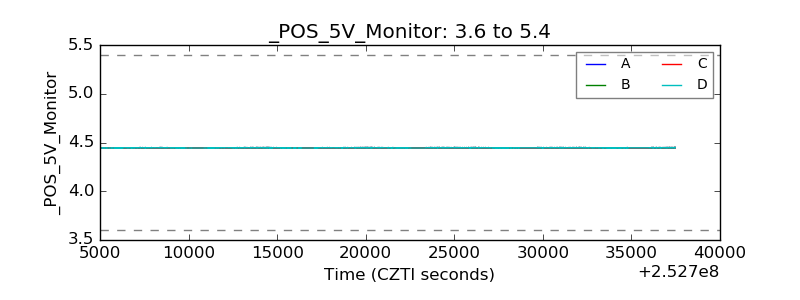 |
| _ROLL_ROT | 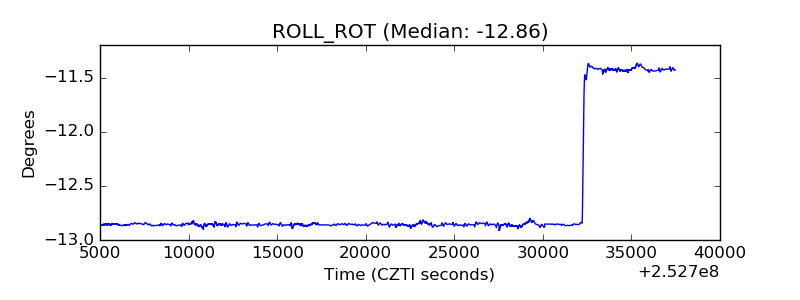 |
| _Roll_DEC | 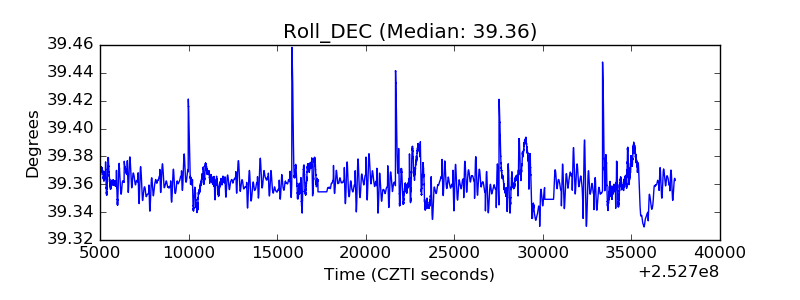 |
| _Roll_RA | 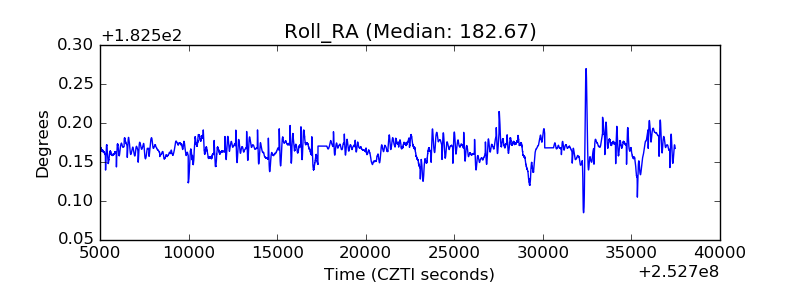 |
| Veto Counter | 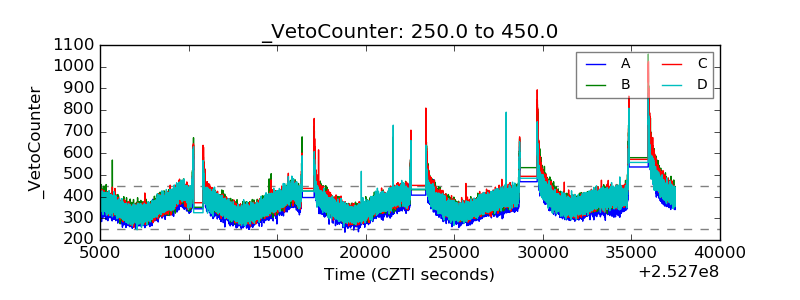 |