| Param | Original file | Final file |
|---|---|---|
| Filename | modeM0/AS1G08_064T01_9000001814_12272cztM0_level2.evt | modeM0/AS1G08_064T01_9000001814_12272cztM0_level2_quad_clean.evt |
| Size (bytes) | 505,693,440 | 78,353,280 |
| Size | 482.3 MB | 74.7 MB |
| Events in quadrant A | 3,723,034 | 499,883 |
| Events in quadrant B | 5,321,375 | 500,145 |
| Events in quadrant C | 2,670,184 | 499,853 |
| Events in quadrant D | 3,212,514 | 472,963 |
| Mode M9 | |||
|---|---|---|---|
| Quadrant | BADHDUFLAG | Total packets | Discarded packets |
| A | 0 | 12 | 0 |
| B | 0 | 12 | 0 |
| C | 0 | 12 | 0 |
| D | 0 | 12 | 0 |
| Mode SS | |||
|---|---|---|---|
| Quadrant | BADHDUFLAG | Total packets | Discarded packets |
| A | 0 | 116 | 0 |
| B | 0 | 116 | 0 |
| C | 0 | 116 | 0 |
| D | 0 | 116 | 0 |
| Mode M0 | |||
|---|---|---|---|
| Quadrant | BADHDUFLAG | Total packets | Discarded packets |
| A | 0 | 14976 | 2 |
| B | 0 | 19585 | 1 |
| C | 0 | 11793 | 1 |
| D | 0 | 13474 | 1 |
| Quadrant | Total seconds | Saturated seconds | Saturation percentage |
|---|---|---|---|
| A | 5718 | 58 | 1.014341% |
| B | 5718 | 925 | 16.176985% |
| C | 5718 | 23 | 0.402239% |
| D | 5718 | 107 | 1.871284% |
Noise dominated data is calculated using 1-second bins in cleaned event files. If a bin has >2000 counts, and if more than 50% of those come from <1% of pixels, then it is considered to be noise-dominated and hence unusable.
| Quadrant | # 1 sec bins | Bins with >0 counts | Bins with >2000 counts | High rate bins dominated by noise | Noise dominated (total time) | Noise dominated (detector-on time) | Marked lightcurve |
|---|---|---|---|---|---|---|---|
| A | 6944 | 5720 | 8 | 8 | 0.12% | 0.14% | 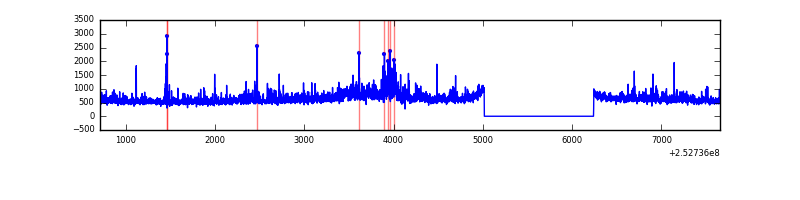 |
| B | 6944 | 5720 | 637 | 637 | 9.17% | 11.14% | 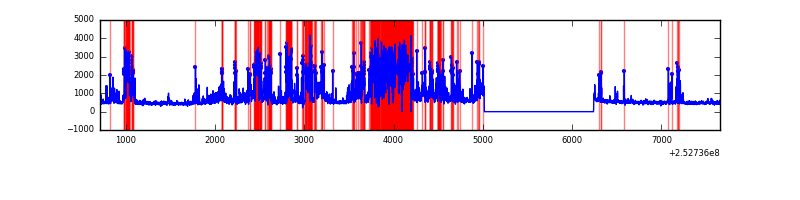 |
| C | 6944 | 5720 | 8 | 8 | 0.12% | 0.14% | 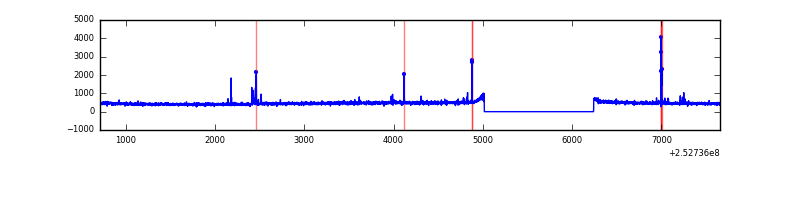 |
| D | 6944 | 5720 | 65 | 65 | 0.94% | 1.14% | 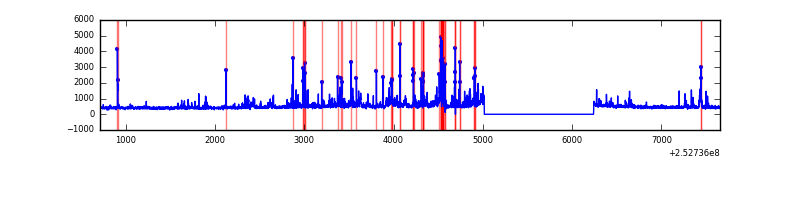 |
Top three noisy pixels from each quadrant. If the there are fewer than three noisy pixels in the level2.evt file, extra rows are filled as -1
| Pixel properties | Quadrant properties | ||||||
|---|---|---|---|---|---|---|---|
| Quadrant | DetID | PixID | Counts | Sigma | Mean | Median | Sigma |
| A | 13 | 251 | 630624 | 4523.3 | 689 | 676 | 139.3 |
| A | 1 | 162 | 129047 | 921.76 | 689 | 676 | 139.3 |
| A | 1 | 178 | 73630 | 523.84 | 689 | 676 | 139.3 |
| B | 0 | 85 | 2019037 | 16968.82 | 627 | 612 | 118.9 |
| B | 4 | 239 | 734531 | 6170.03 | 627 | 612 | 118.9 |
| B | 11 | 51 | 47109 | 390.9 | 627 | 612 | 118.9 |
| C | 14 | 234 | 69292 | 450.32 | 661 | 665 | 152.4 |
| C | 4 | 175 | 12387 | 76.92 | 661 | 665 | 152.4 |
| C | 15 | 208 | 7681 | 46.04 | 661 | 665 | 152.4 |
| D | 1 | 52 | 322985 | 2048.37 | 660 | 642 | 157.4 |
| D | 9 | 85 | 69947 | 440.41 | 660 | 642 | 157.4 |
| D | 10 | 199 | 60549 | 380.69 | 660 | 642 | 157.4 |
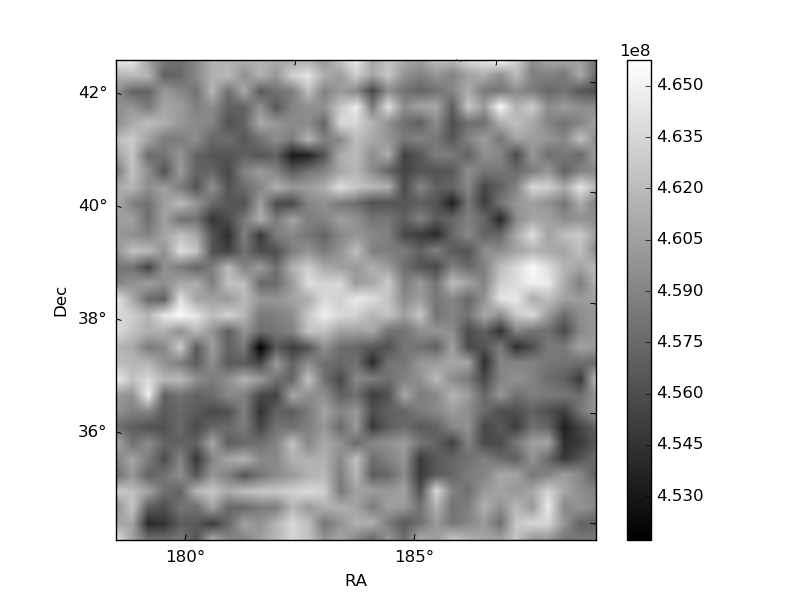
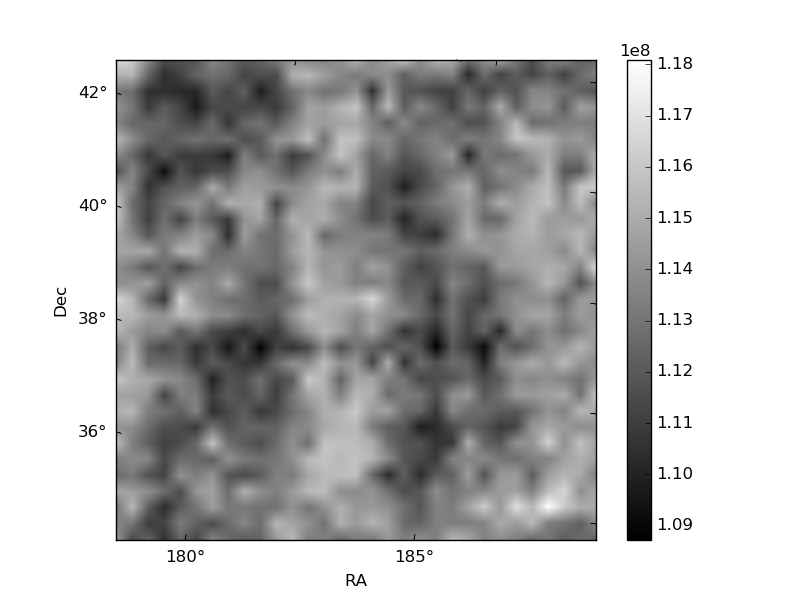
Histogram calculated using DETX and DETY for each event in the final _common_clean file
| Quadrant A | 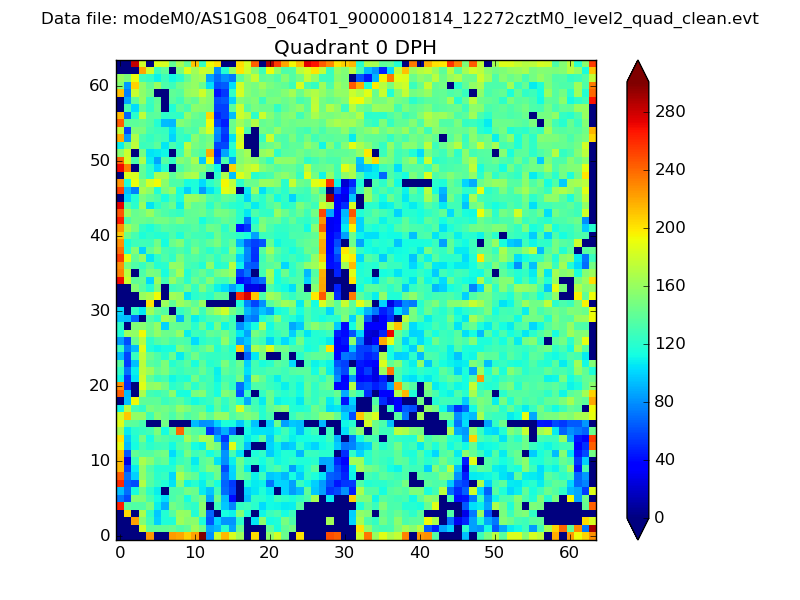 |
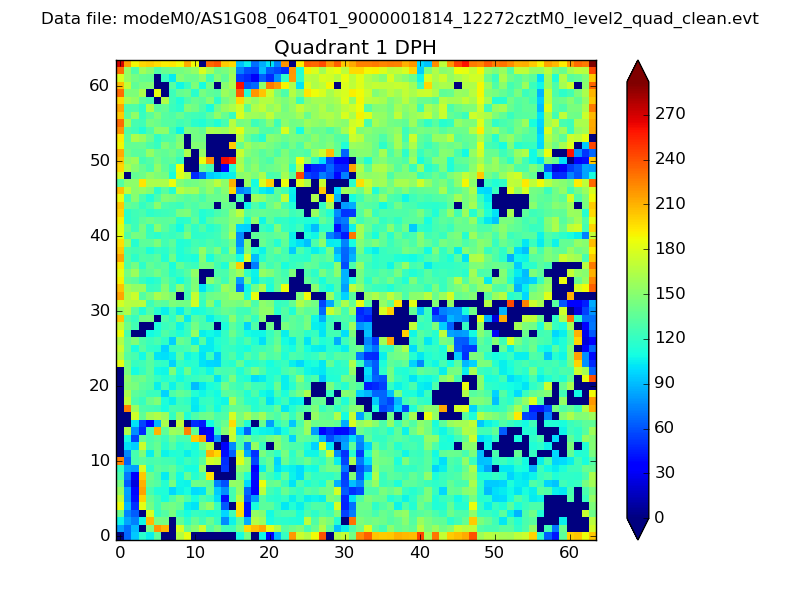 |
Quadrant B |
|---|---|---|---|
| Quadrant D | 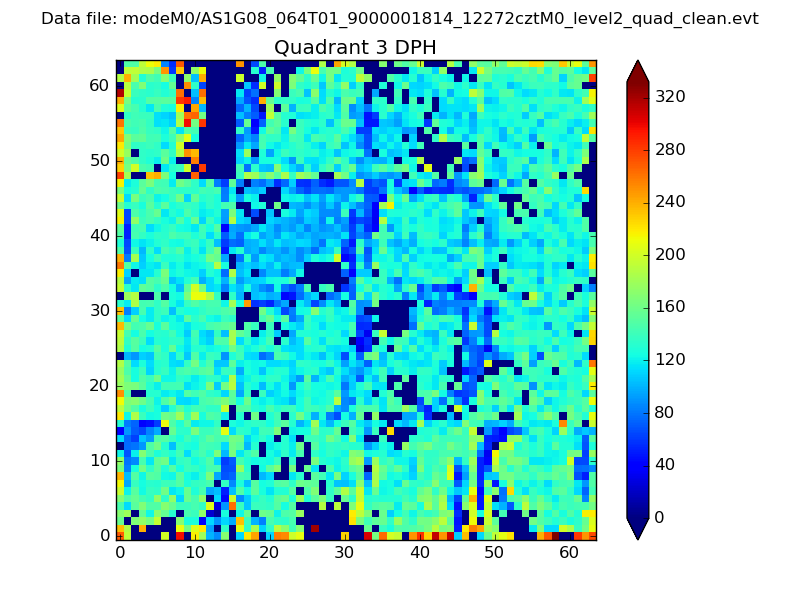 |
 |
Quadrant C |
| Plot type | Count rate plots | Images |
|---|---|---|
| Comparison with Poisson distribution Blue bars denote a histogram of data divided into 1 sec bins. Red curve is a Poisson curve with rate = median count rate of data. |
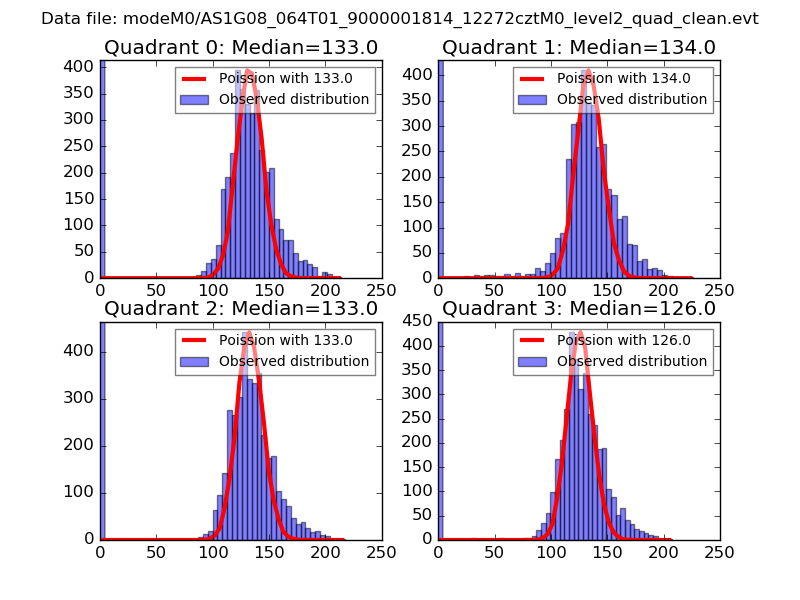 |
 |
| Quadrant-wise count rates Data is divided into 100 sec bins |
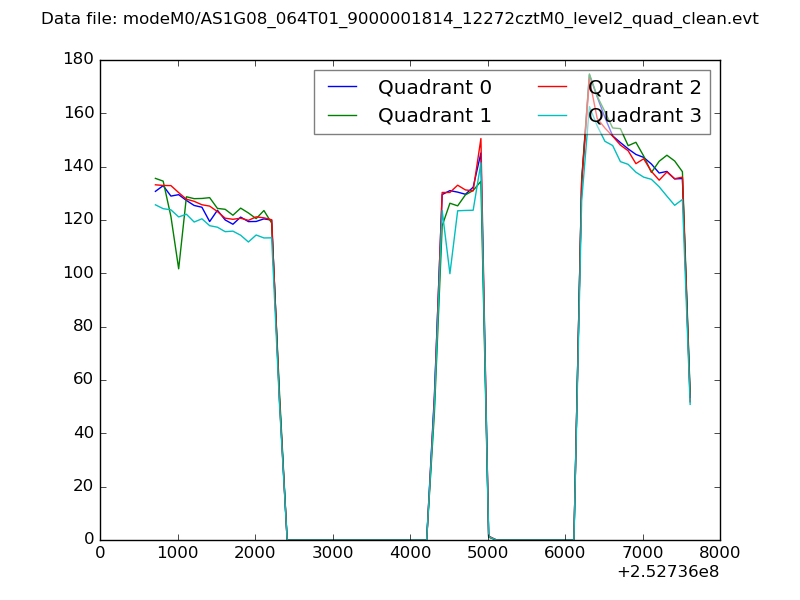 |
|
| Module-wise count rates for Quadrant A Data is divided into 100 sec bins |
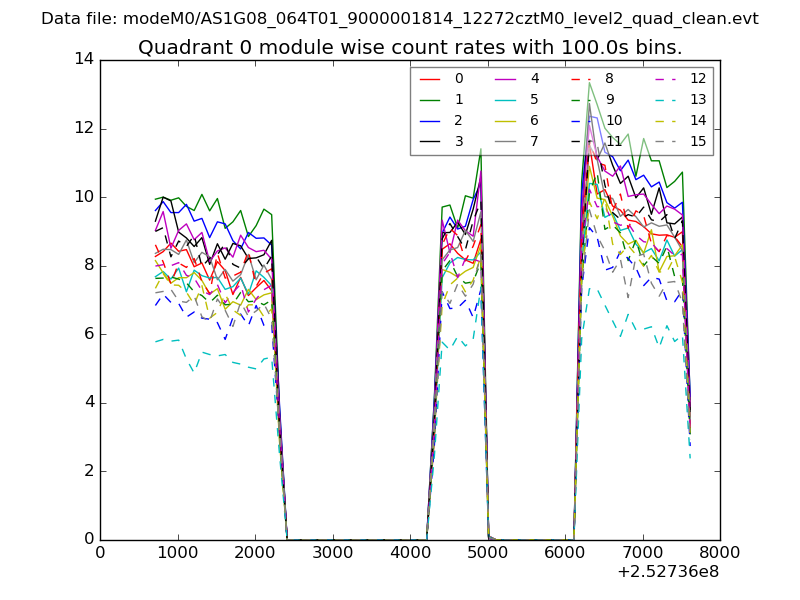 |
 |
| Module-wise count rates for Quadrant B Data is divided into 100 sec bins |
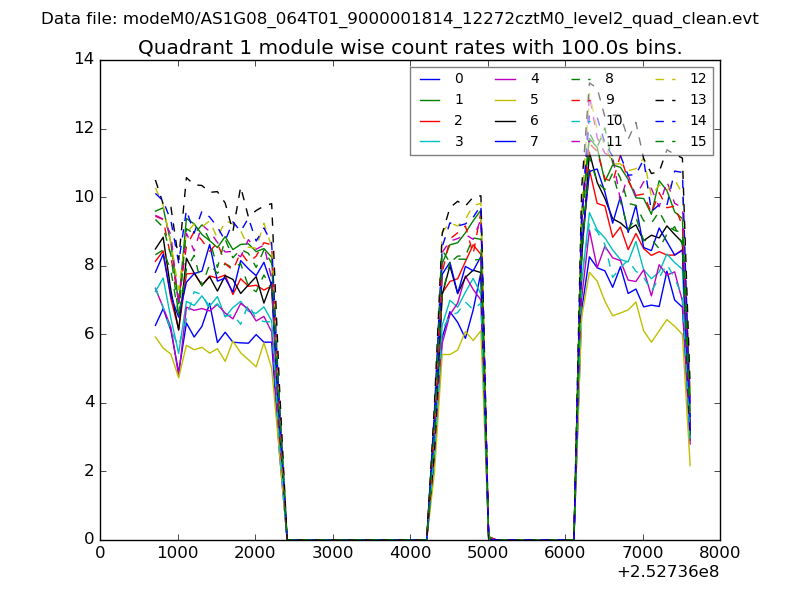 |
 |
| Module-wise count rates for Quadrant C Data is divided into 100 sec bins |
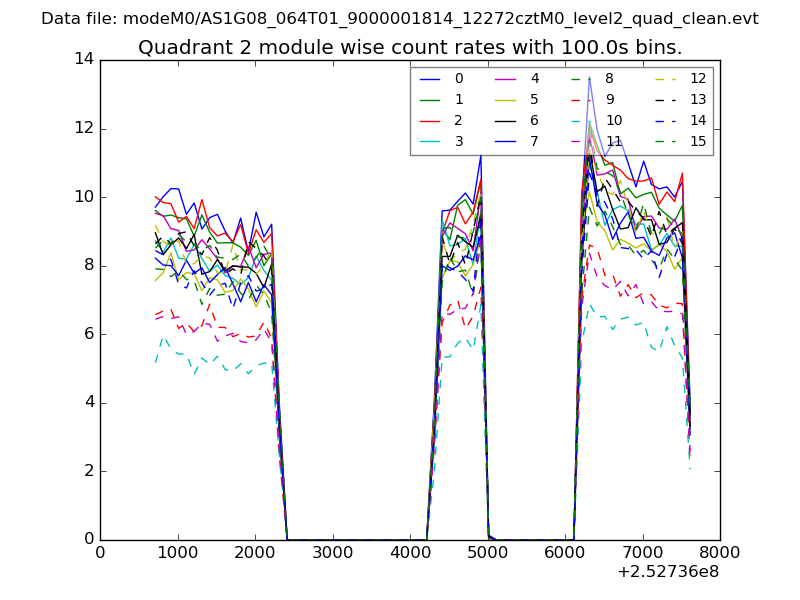 |
 |
| Module-wise count rates for Quadrant D Data is divided into 100 sec bins |
 |
 |
| Parameter | Plot |
|---|---|
| CZT HV Monitor | 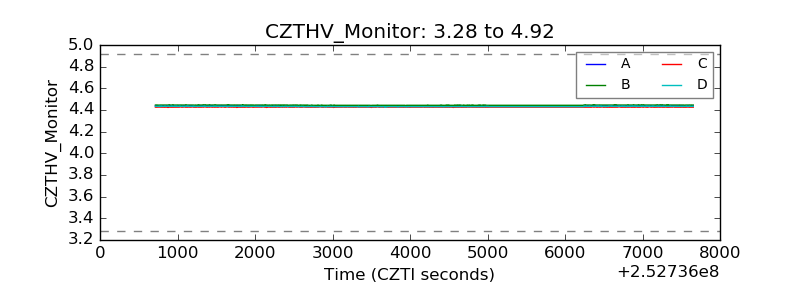 |
| D_VDD | 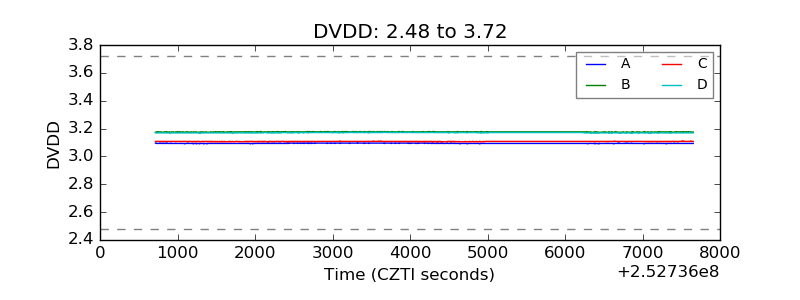 |
| Temperature 1 | 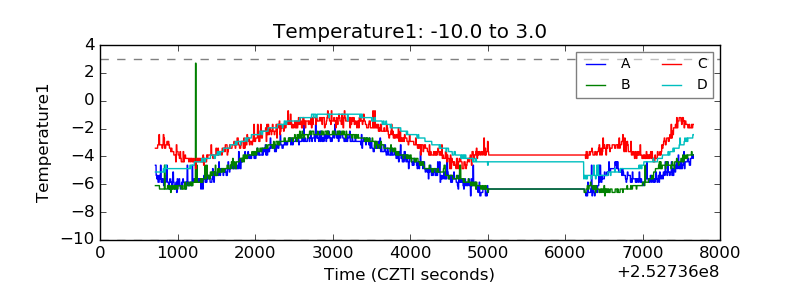 |
| Veto HV Monitor | 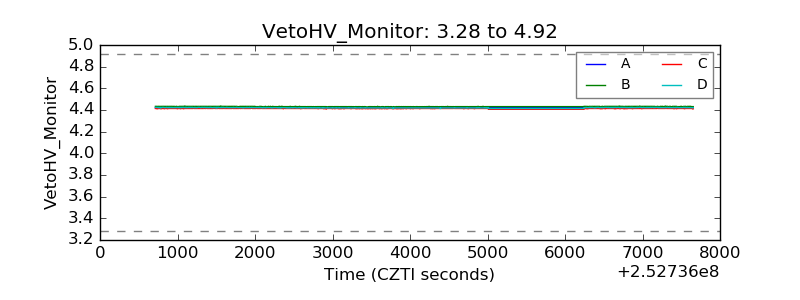 |
| Veto LLD | 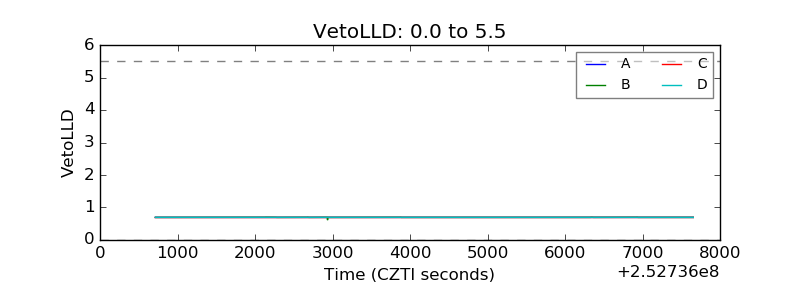 |
| Alpha Counter | 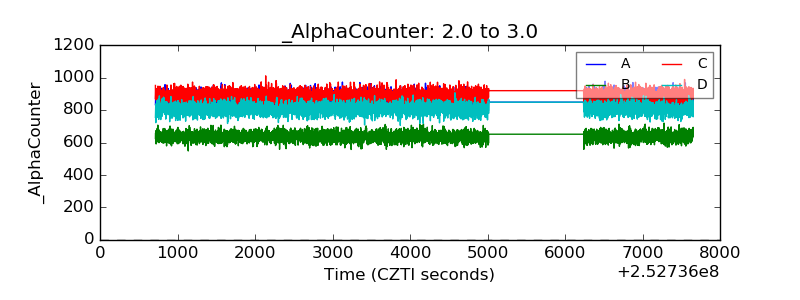 |
| _CPM_Rate | 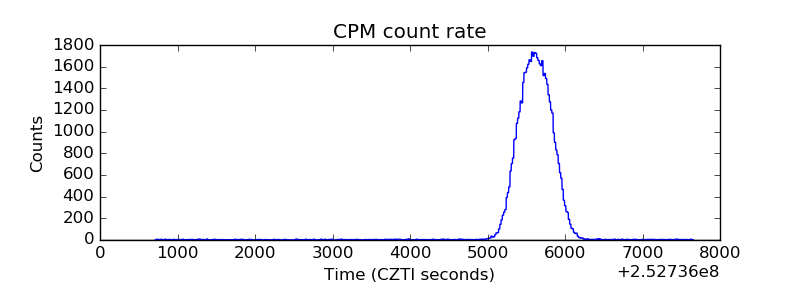 |
| CZT Counter | 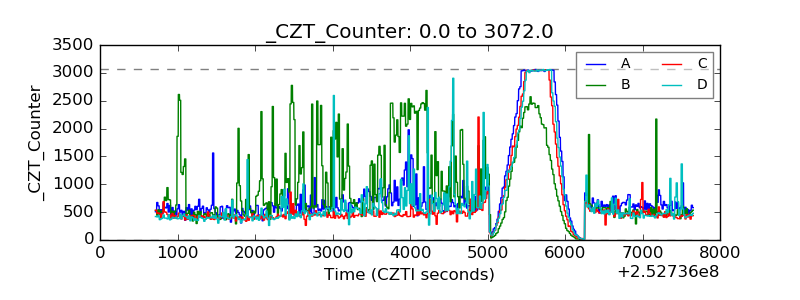 |
| +2.5 Volts monitor |  |
| +5 Volts monitor |  |
| _ROLL_ROT | 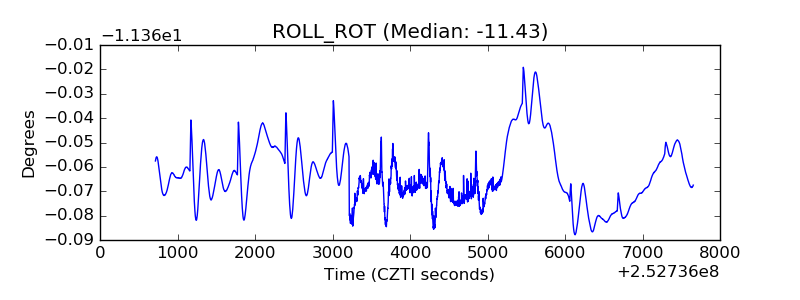 |
| _Roll_DEC | 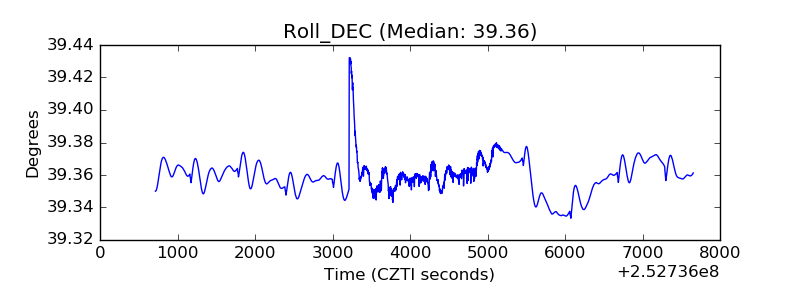 |
| _Roll_RA | 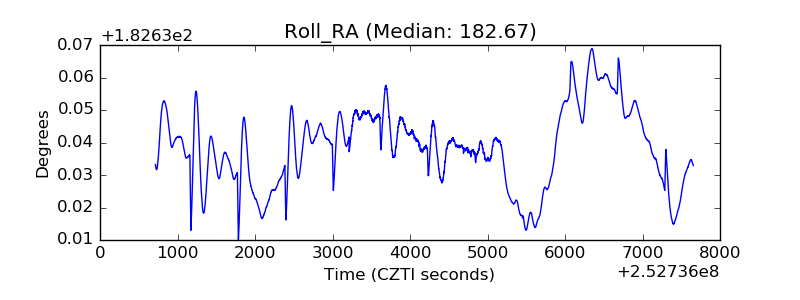 |
| Veto Counter |  |