| Param | Original file | Final file |
|---|---|---|
| Filename | modeM0/AS1G08_064T01_9000001814_12274cztM0_level2.evt | modeM0/AS1G08_064T01_9000001814_12274cztM0_level2_quad_clean.evt |
| Size (bytes) | 533,419,200 | 82,722,240 |
| Size | 508.7 MB | 78.9 MB |
| Events in quadrant A | 3,732,599 | 534,914 |
| Events in quadrant B | 4,892,966 | 524,848 |
| Events in quadrant C | 2,816,802 | 534,182 |
| Events in quadrant D | 4,320,430 | 507,068 |
| Mode M9 | |||
|---|---|---|---|
| Quadrant | BADHDUFLAG | Total packets | Discarded packets |
| A | 0 | 13 | 0 |
| B | 0 | 13 | 0 |
| C | 0 | 13 | 0 |
| D | 0 | 13 | 0 |
| Mode SS | |||
|---|---|---|---|
| Quadrant | BADHDUFLAG | Total packets | Discarded packets |
| A | 0 | 118 | 0 |
| B | 0 | 118 | 0 |
| C | 0 | 118 | 0 |
| D | 0 | 118 | 0 |
| Mode M0 | |||
|---|---|---|---|
| Quadrant | BADHDUFLAG | Total packets | Discarded packets |
| A | 0 | 15024 | 2 |
| B | 0 | 18104 | 1 |
| C | 0 | 11923 | 1 |
| D | 0 | 16358 | 1 |
| Quadrant | Total seconds | Saturated seconds | Saturation percentage |
|---|---|---|---|
| A | 5775 | 118 | 2.043290% |
| B | 5775 | 987 | 17.090909% |
| C | 5775 | 46 | 0.796537% |
| D | 5775 | 519 | 8.987013% |
Noise dominated data is calculated using 1-second bins in cleaned event files. If a bin has >2000 counts, and if more than 50% of those come from <1% of pixels, then it is considered to be noise-dominated and hence unusable.
| Quadrant | # 1 sec bins | Bins with >0 counts | Bins with >2000 counts | High rate bins dominated by noise | Noise dominated (total time) | Noise dominated (detector-on time) | Marked lightcurve |
|---|---|---|---|---|---|---|---|
| A | 7076 | 5777 | 18 | 18 | 0.25% | 0.31% | 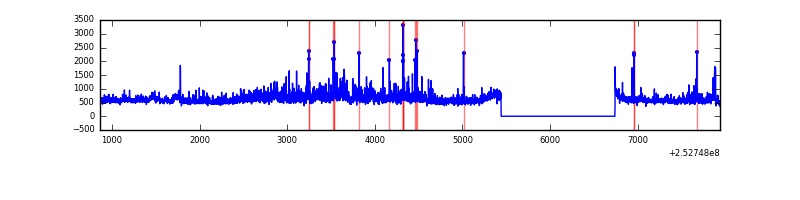 |
| B | 7076 | 5777 | 531 | 531 | 7.50% | 9.19% | 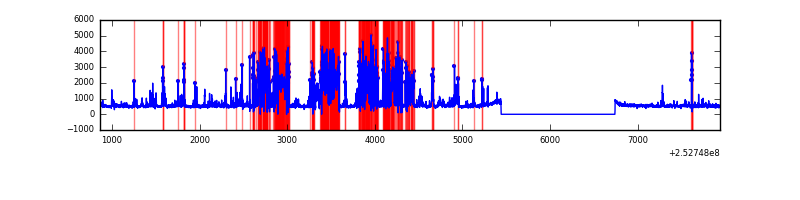 |
| C | 7076 | 5777 | 4 | 4 | 0.06% | 0.07% | 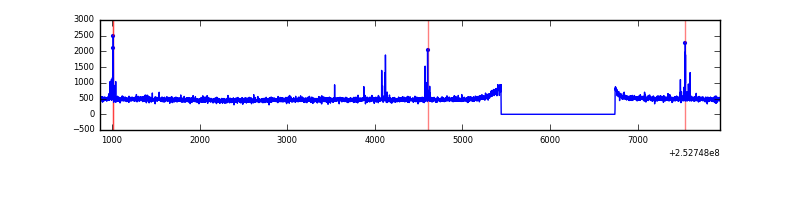 |
| D | 7076 | 5777 | 365 | 365 | 5.16% | 6.32% | 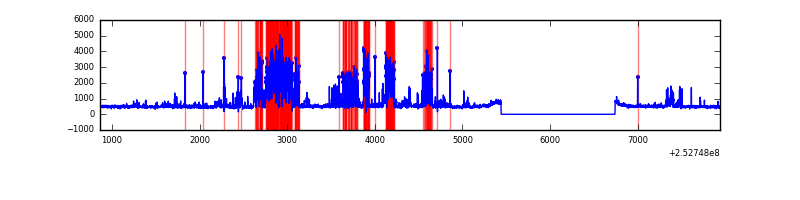 |
Top three noisy pixels from each quadrant. If the there are fewer than three noisy pixels in the level2.evt file, extra rows are filled as -1
| Pixel properties | Quadrant properties | ||||||
|---|---|---|---|---|---|---|---|
| Quadrant | DetID | PixID | Counts | Sigma | Mean | Median | Sigma |
| A | 13 | 251 | 414484 | 2792.6 | 736 | 722 | 148.2 |
| A | 1 | 162 | 119737 | 803.27 | 736 | 722 | 148.2 |
| A | 15 | 174 | 70352 | 469.95 | 736 | 722 | 148.2 |
| B | 4 | 239 | 2086752 | 17054.75 | 649 | 635 | 122.3 |
| B | 11 | 51 | 60657 | 490.7 | 649 | 635 | 122.3 |
| B | 0 | 85 | 40238 | 323.77 | 649 | 635 | 122.3 |
| C | 14 | 234 | 49111 | 300.0 | 707 | 711 | 161.3 |
| C | 4 | 175 | 7561 | 42.46 | 707 | 711 | 161.3 |
| C | 13 | 61 | 5084 | 27.11 | 707 | 711 | 161.3 |
| D | 1 | 52 | 1366782 | 8223.24 | 692 | 673 | 166.1 |
| D | 5 | 222 | 95924 | 573.36 | 692 | 673 | 166.1 |
| D | 9 | 85 | 49730 | 295.3 | 692 | 673 | 166.1 |
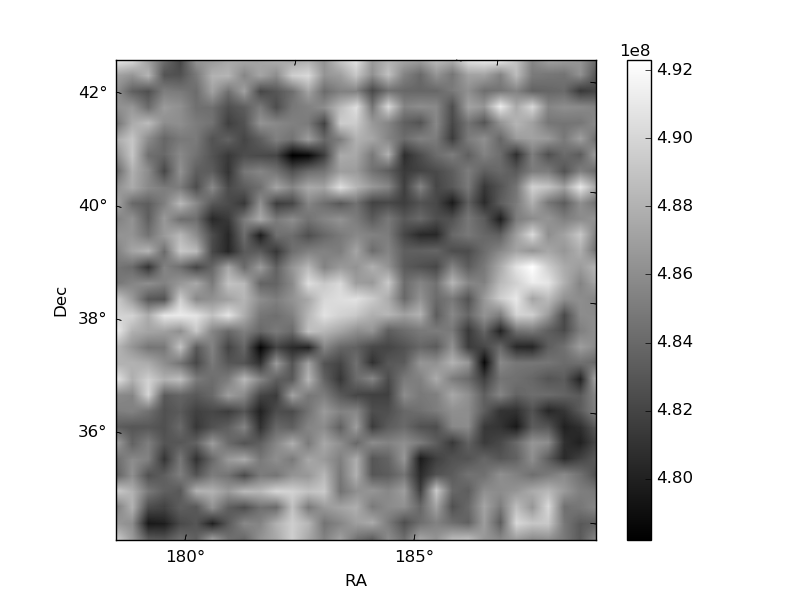
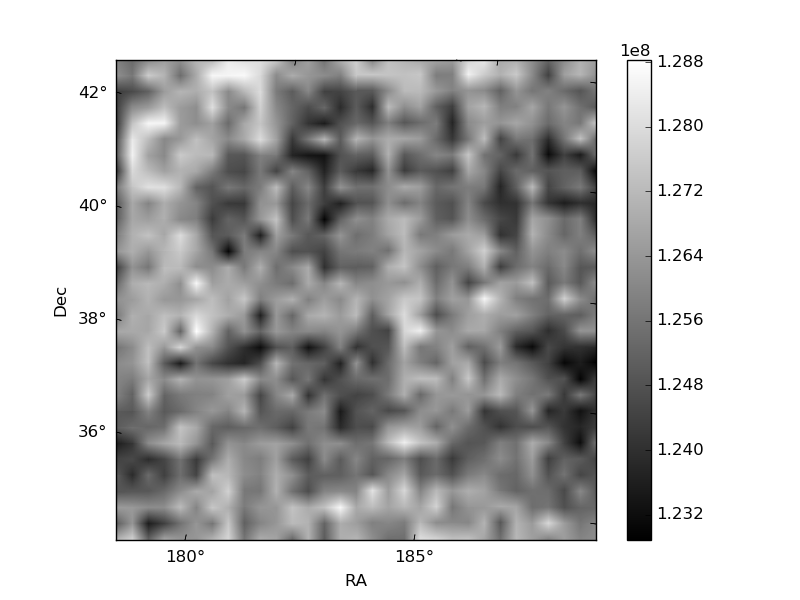
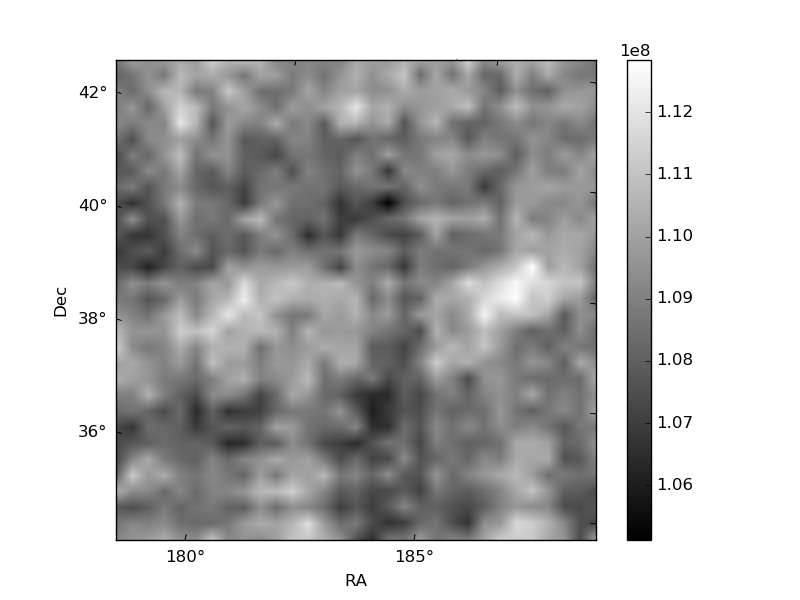
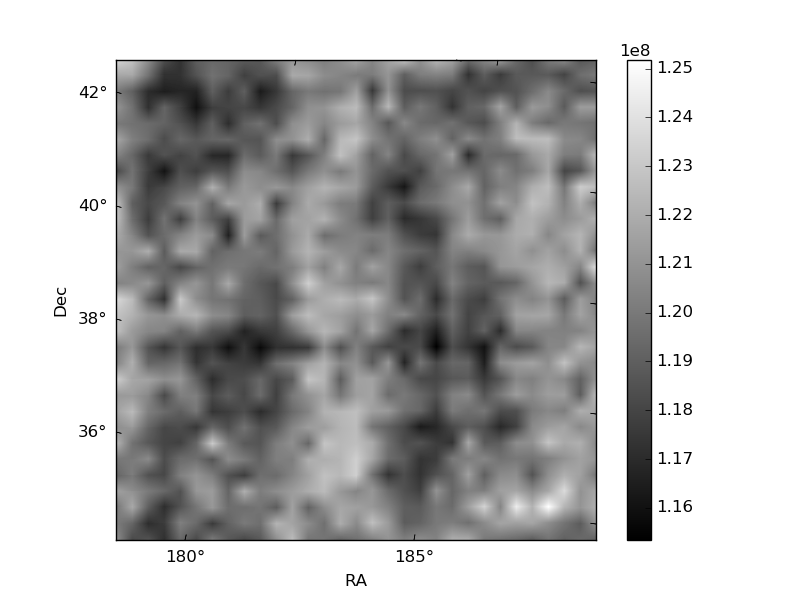
Histogram calculated using DETX and DETY for each event in the final _common_clean file
| Quadrant A | 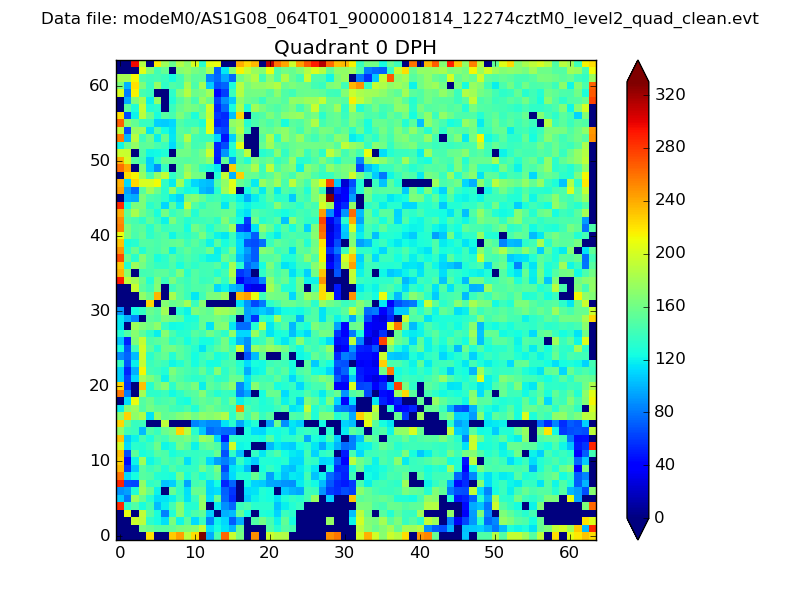 |
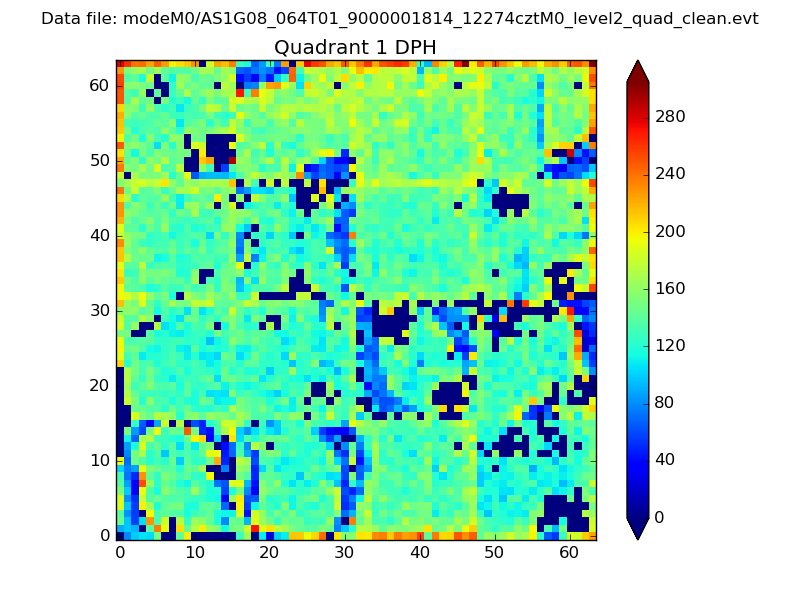 |
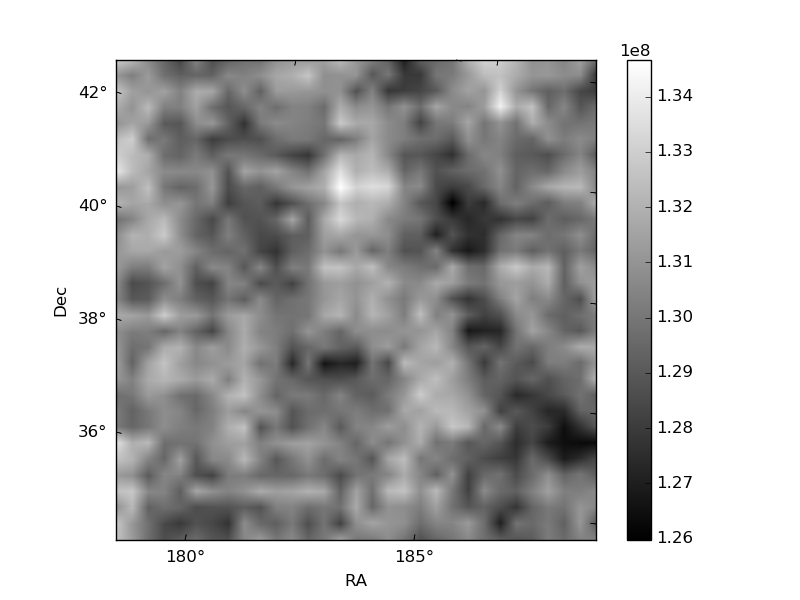
Quadrant B |
|---|---|---|---|
| Quadrant D | 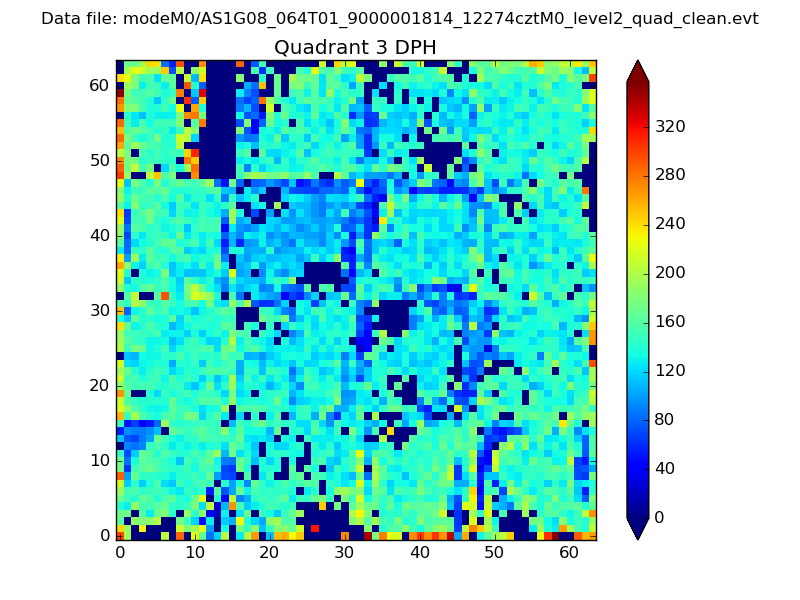 |
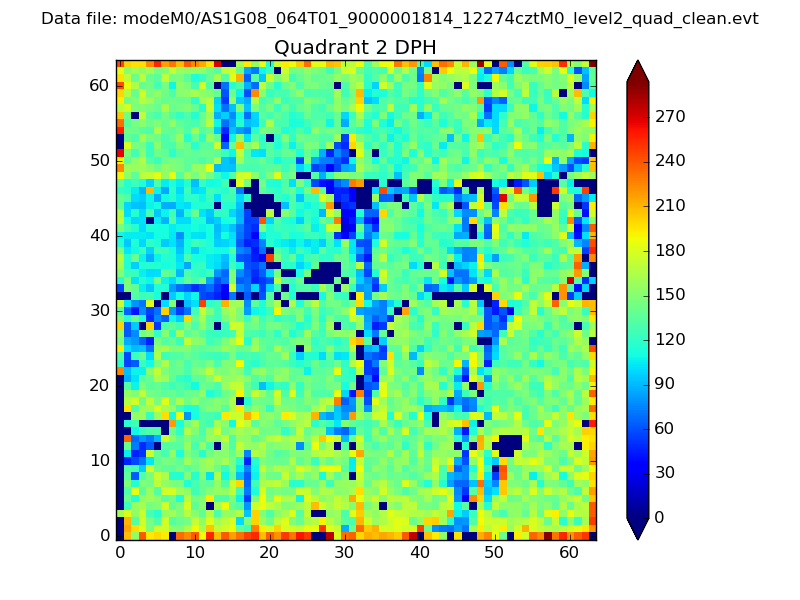 |
Quadrant C |
| Plot type | Count rate plots | Images |
|---|---|---|
| Comparison with Poisson distribution Blue bars denote a histogram of data divided into 1 sec bins. Red curve is a Poisson curve with rate = median count rate of data. |
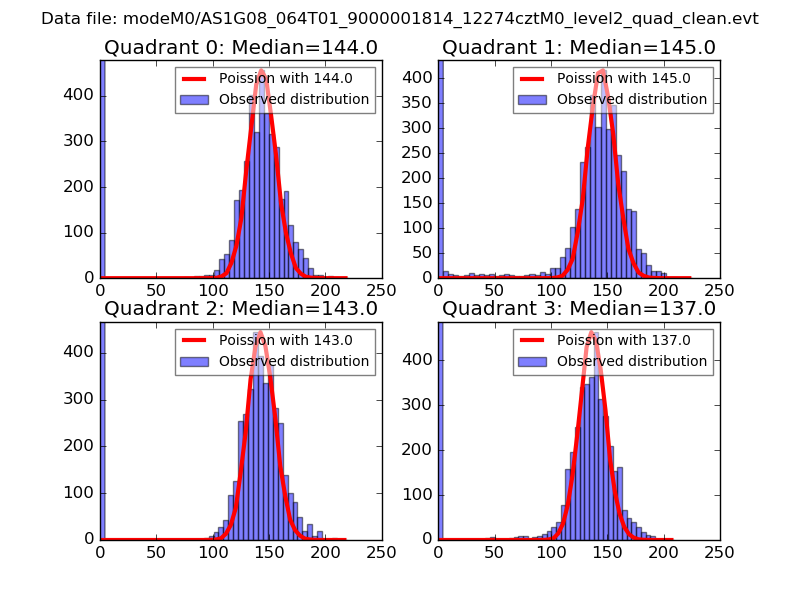 |
 |
| Quadrant-wise count rates Data is divided into 100 sec bins |
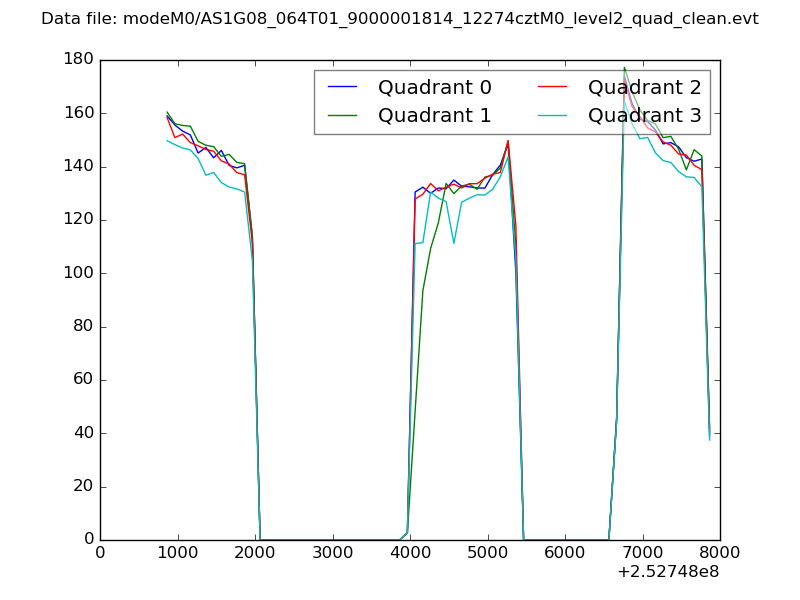 |
|
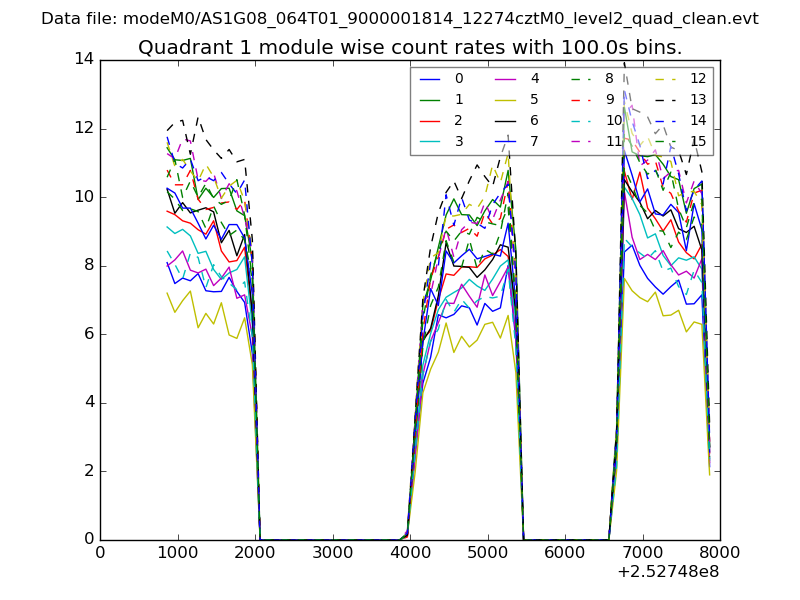
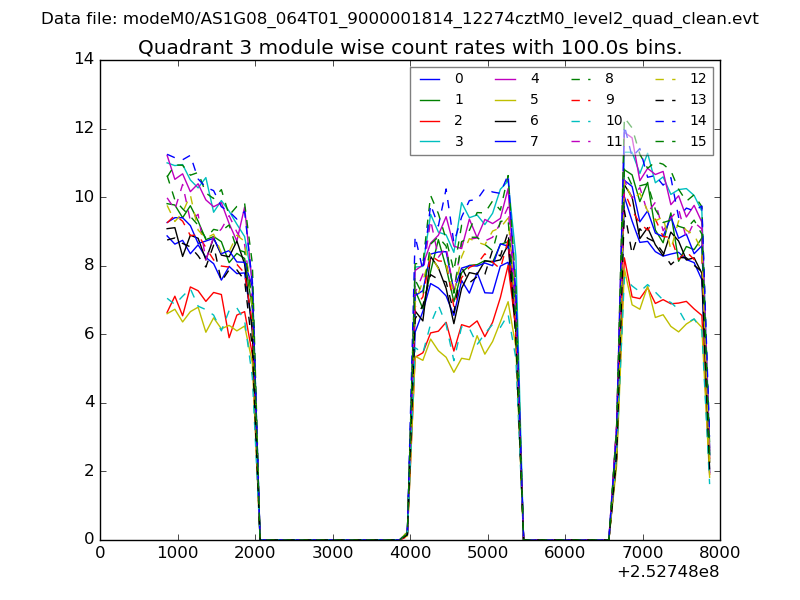
| Module-wise count rates for Quadrant A Data is divided into 100 sec bins |
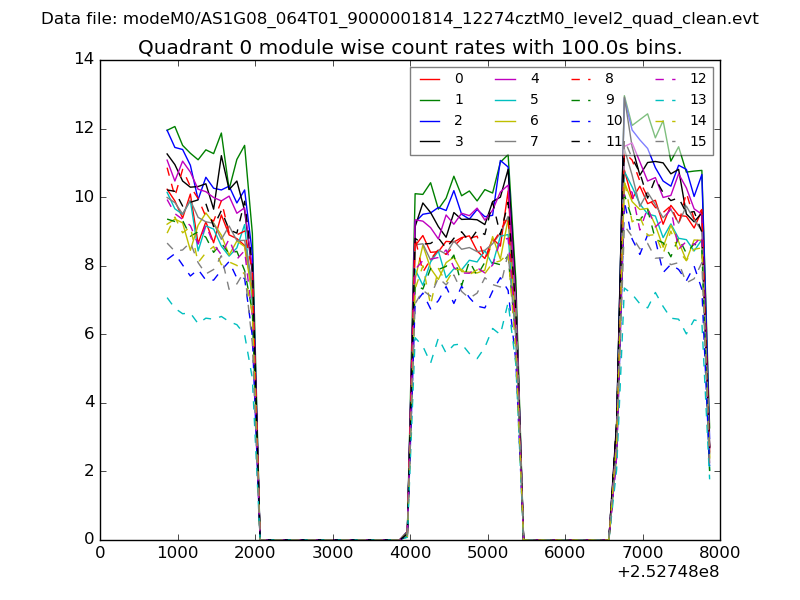 |
 |
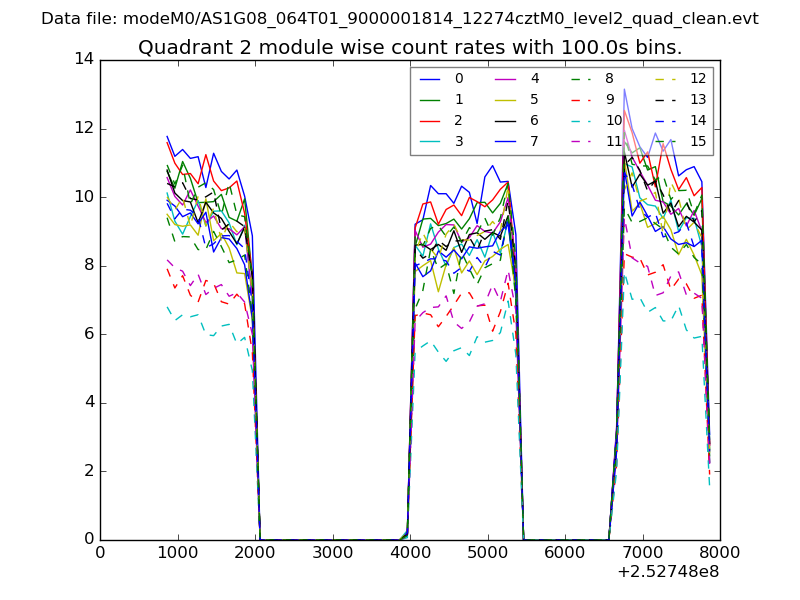
| Module-wise count rates for Quadrant B Data is divided into 100 sec bins |
 |
 |
| Module-wise count rates for Quadrant C Data is divided into 100 sec bins |
 |
 |
| Module-wise count rates for Quadrant D Data is divided into 100 sec bins |
 |
 |
| Parameter | Plot |
|---|---|
| CZT HV Monitor | 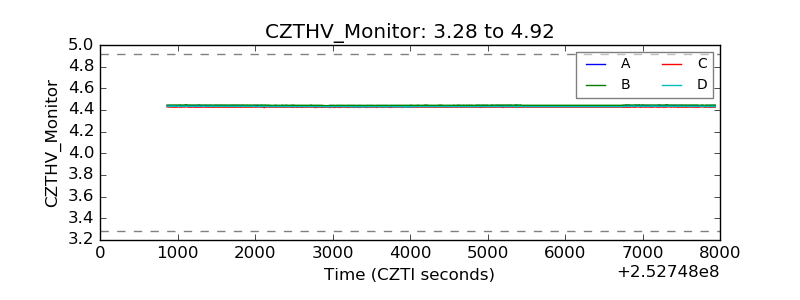 |
| D_VDD | 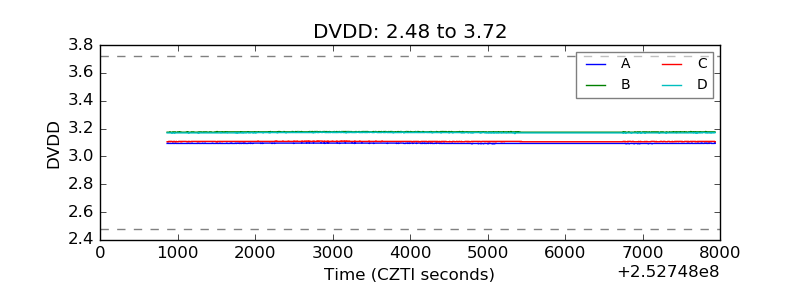 |
| Temperature 1 | 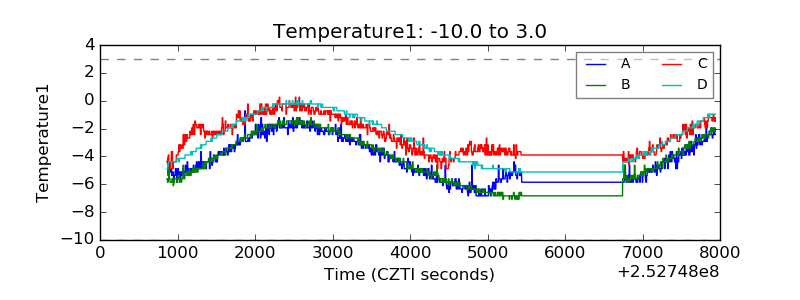 |
| Veto HV Monitor | 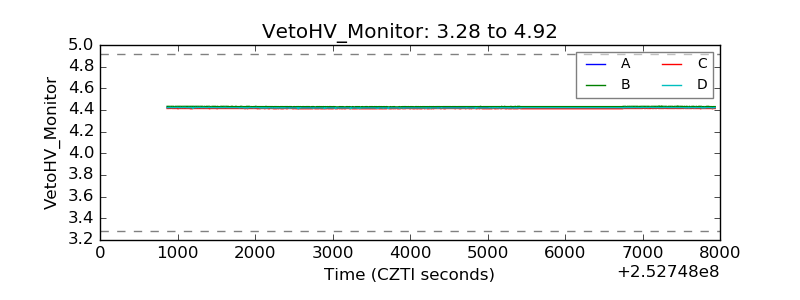 |
| Veto LLD | 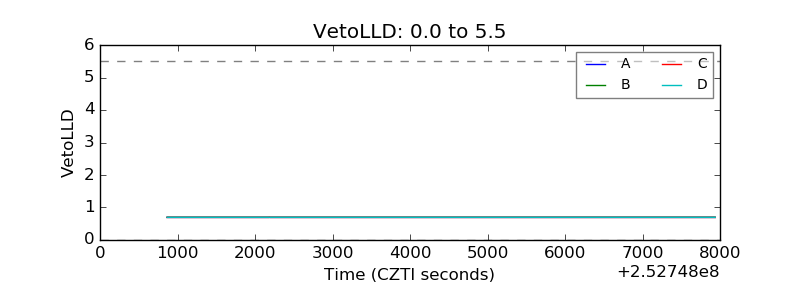 |
| Alpha Counter | 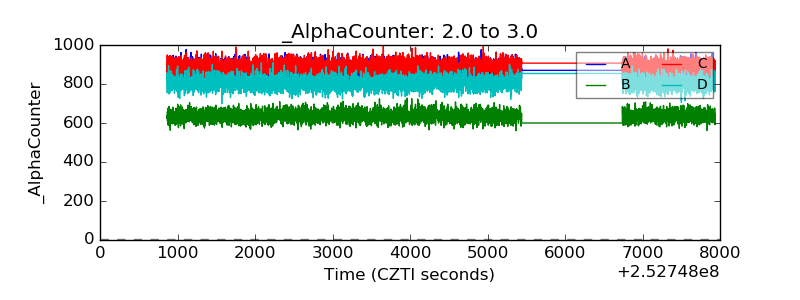 |
| _CPM_Rate | 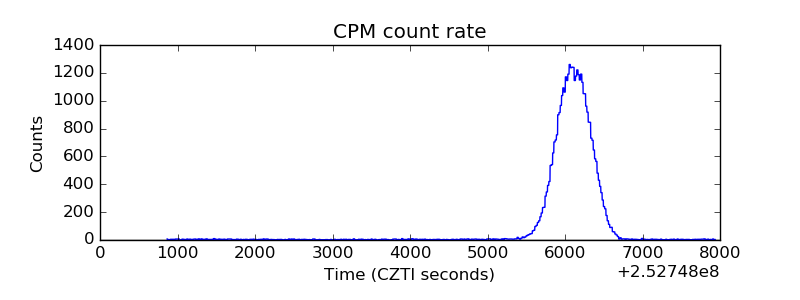 |
| CZT Counter | 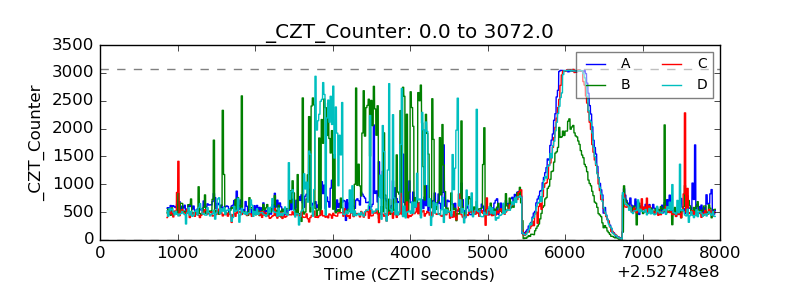 |
| +2.5 Volts monitor | 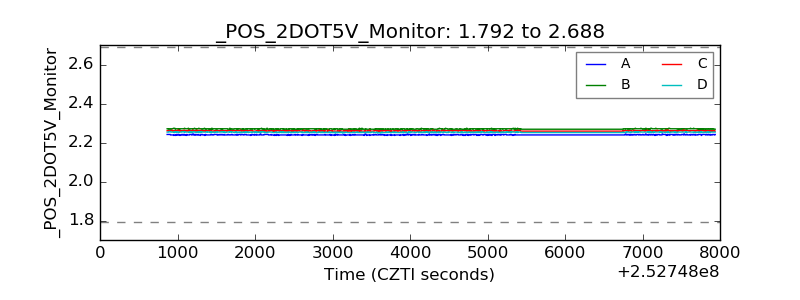 |
| +5 Volts monitor | 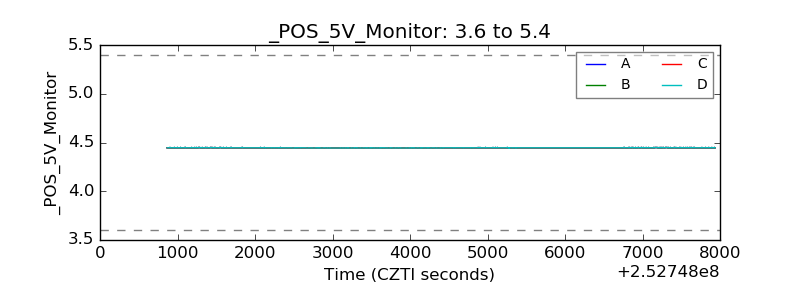 |
| _ROLL_ROT | 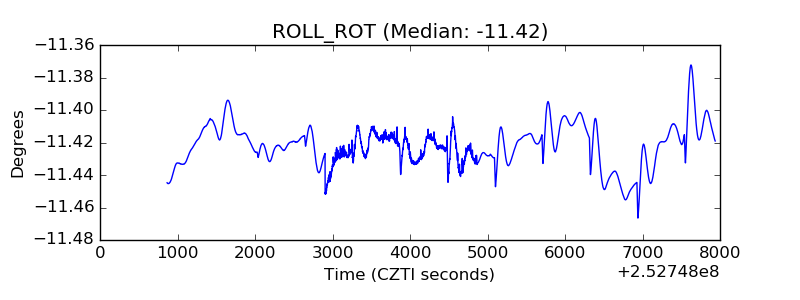 |
| _Roll_DEC | 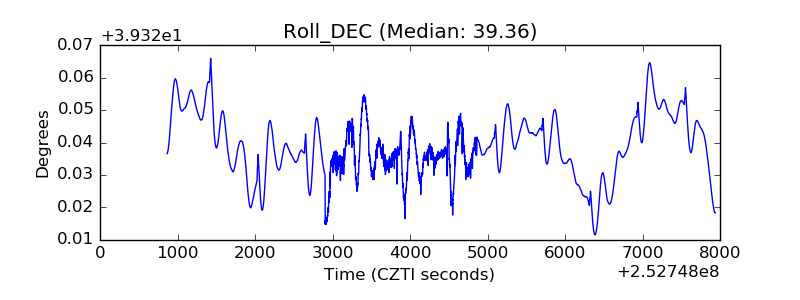 |
| _Roll_RA | 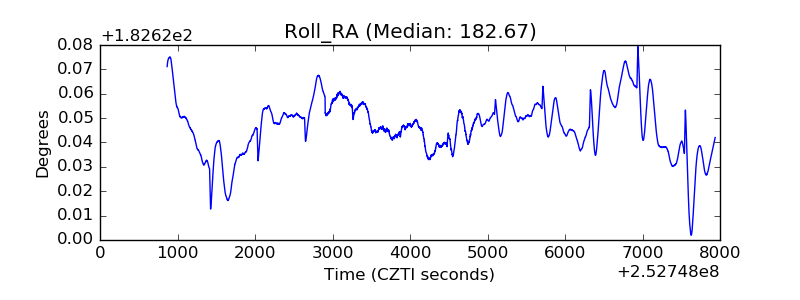 |
| Veto Counter | 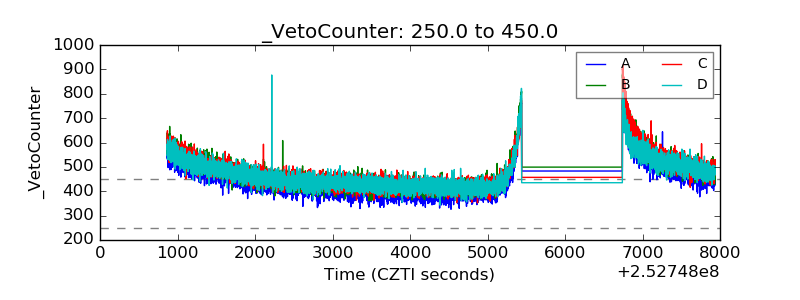 |