| Param | Original file | Final file |
|---|---|---|
| Filename | modeM0/AS1G08_064T01_9000001814_12275cztM0_level2.evt | modeM0/AS1G08_064T01_9000001814_12275cztM0_level2_quad_clean.evt |
| Size (bytes) | 531,204,480 | 73,241,280 |
| Size | 506.6 MB | 69.8 MB |
| Events in quadrant A | 3,594,127 | 459,507 |
| Events in quadrant B | 5,700,854 | 439,073 |
| Events in quadrant C | 2,821,592 | 463,631 |
| Events in quadrant D | 3,572,347 | 444,834 |
| Mode M9 | |||
|---|---|---|---|
| Quadrant | BADHDUFLAG | Total packets | Discarded packets |
| A | 0 | 12 | 0 |
| B | 0 | 12 | 0 |
| C | 0 | 12 | 0 |
| D | 0 | 12 | 0 |
| Mode SS | |||
|---|---|---|---|
| Quadrant | BADHDUFLAG | Total packets | Discarded packets |
| A | 0 | 120 | 0 |
| B | 0 | 120 | 0 |
| C | 0 | 120 | 0 |
| D | 0 | 120 | 0 |
| Mode M0 | |||
|---|---|---|---|
| Quadrant | BADHDUFLAG | Total packets | Discarded packets |
| A | 0 | 14434 | 2 |
| B | 0 | 20680 | 1 |
| C | 0 | 12095 | 1 |
| D | 0 | 14339 | 1 |
| Quadrant | Total seconds | Saturated seconds | Saturation percentage |
|---|---|---|---|
| A | 5871 | 142 | 2.418668% |
| B | 5871 | 1296 | 22.074604% |
| C | 5871 | 71 | 1.209334% |
| D | 5871 | 126 | 2.146142% |
Noise dominated data is calculated using 1-second bins in cleaned event files. If a bin has >2000 counts, and if more than 50% of those come from <1% of pixels, then it is considered to be noise-dominated and hence unusable.
| Quadrant | # 1 sec bins | Bins with >0 counts | Bins with >2000 counts | High rate bins dominated by noise | Noise dominated (total time) | Noise dominated (detector-on time) | Marked lightcurve |
|---|---|---|---|---|---|---|---|
| A | 7092 | 5873 | 12 | 12 | 0.17% | 0.20% | 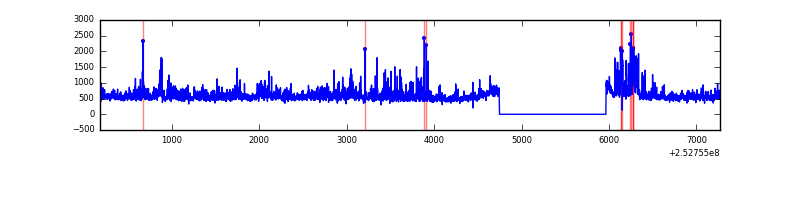 |
| B | 7092 | 5873 | 727 | 727 | 10.25% | 12.38% | 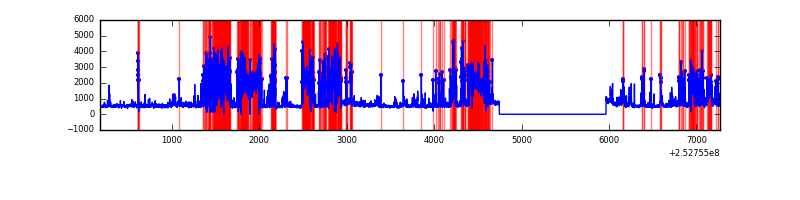 |
| C | 7092 | 5873 | 1 | 1 | 0.01% | 0.02% |  |
| D | 7092 | 5873 | 44 | 44 | 0.62% | 0.75% | 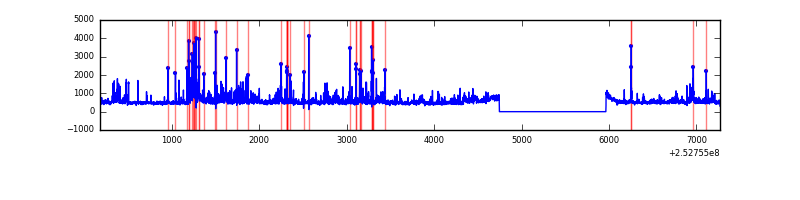 |
Top three noisy pixels from each quadrant. If the there are fewer than three noisy pixels in the level2.evt file, extra rows are filled as -1
| Pixel properties | Quadrant properties | ||||||
|---|---|---|---|---|---|---|---|
| Quadrant | DetID | PixID | Counts | Sigma | Mean | Median | Sigma |
| A | 5 | 16 | 156033 | 1037.22 | 739 | 724 | 149.7 |
| A | 1 | 162 | 118715 | 787.99 | 739 | 724 | 149.7 |
| A | 14 | 237 | 95732 | 634.5 | 739 | 724 | 149.7 |
| B | 4 | 239 | 2107684 | 17343.5 | 642 | 627 | 121.5 |
| B | 3 | 64 | 700736 | 5762.7 | 642 | 627 | 121.5 |
| B | 11 | 51 | 111313 | 911.07 | 642 | 627 | 121.5 |
| C | 14 | 234 | 22616 | 132.84 | 715 | 719 | 164.8 |
| C | 3 | 233 | 8860 | 49.39 | 715 | 719 | 164.8 |
| C | 13 | 61 | 5395 | 28.37 | 715 | 719 | 164.8 |
| D | 1 | 52 | 336182 | 1945.01 | 718 | 698 | 172.5 |
| D | 13 | 104 | 124920 | 720.19 | 718 | 698 | 172.5 |
| D | 10 | 50 | 77871 | 447.42 | 718 | 698 | 172.5 |
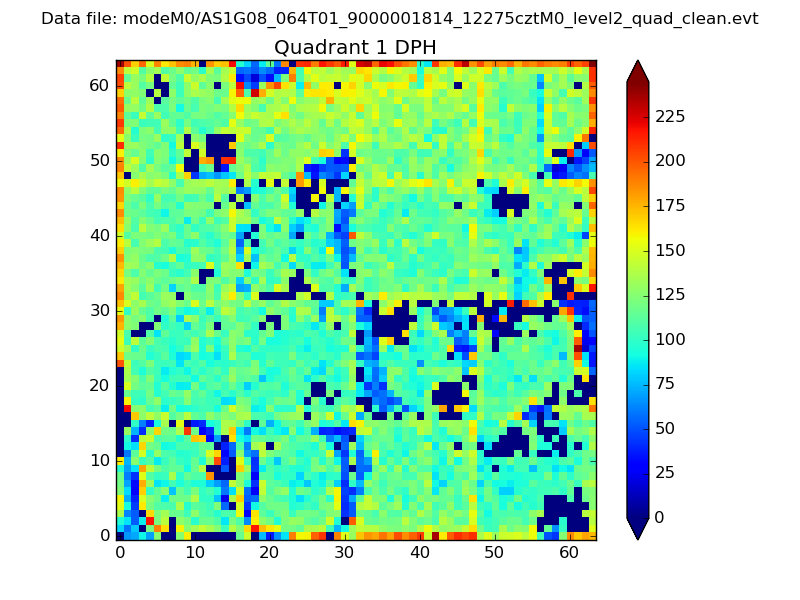
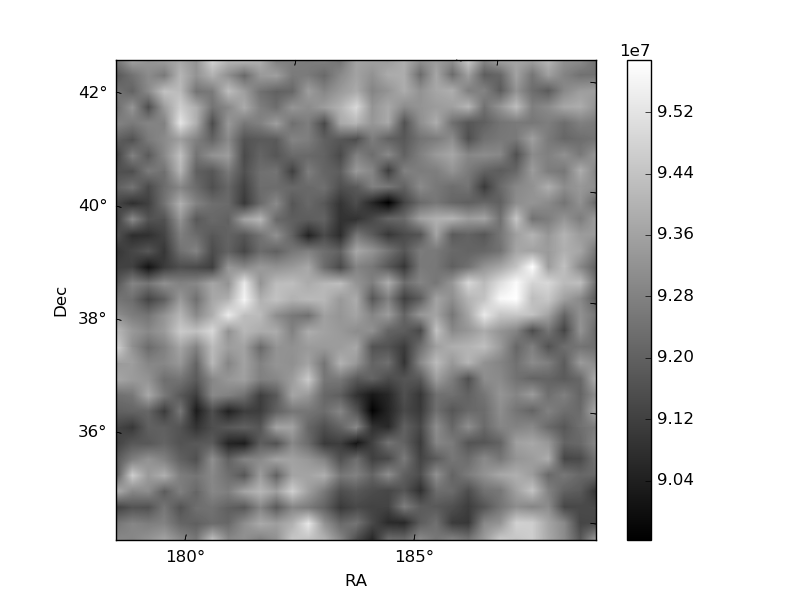
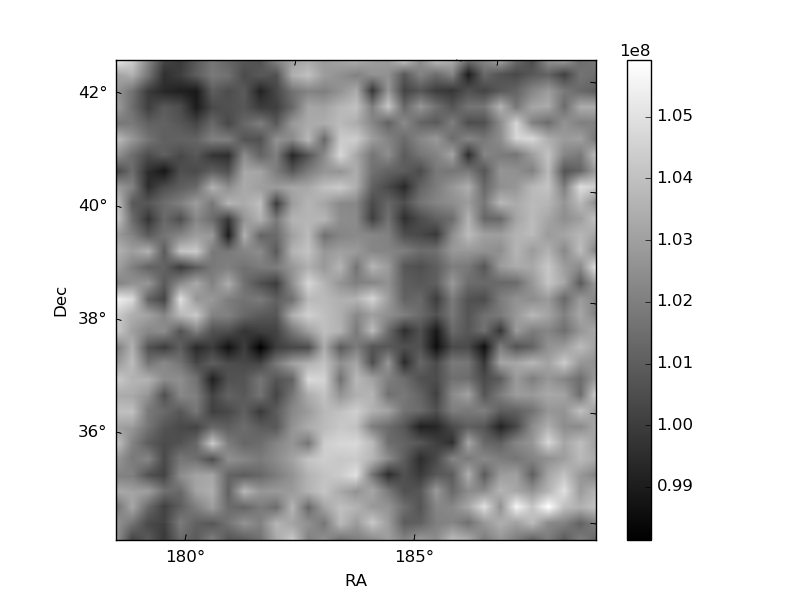
Histogram calculated using DETX and DETY for each event in the final _common_clean file
| Quadrant A |  |
 |
Quadrant B |
|---|---|---|---|
| Quadrant D |  |
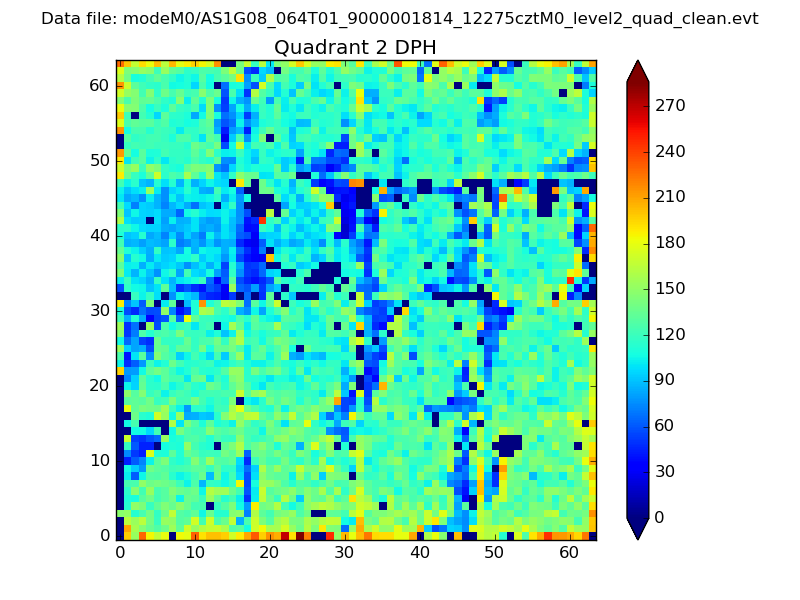 |
Quadrant C |
| Plot type | Count rate plots | Images |
|---|---|---|
| Comparison with Poisson distribution Blue bars denote a histogram of data divided into 1 sec bins. Red curve is a Poisson curve with rate = median count rate of data. |
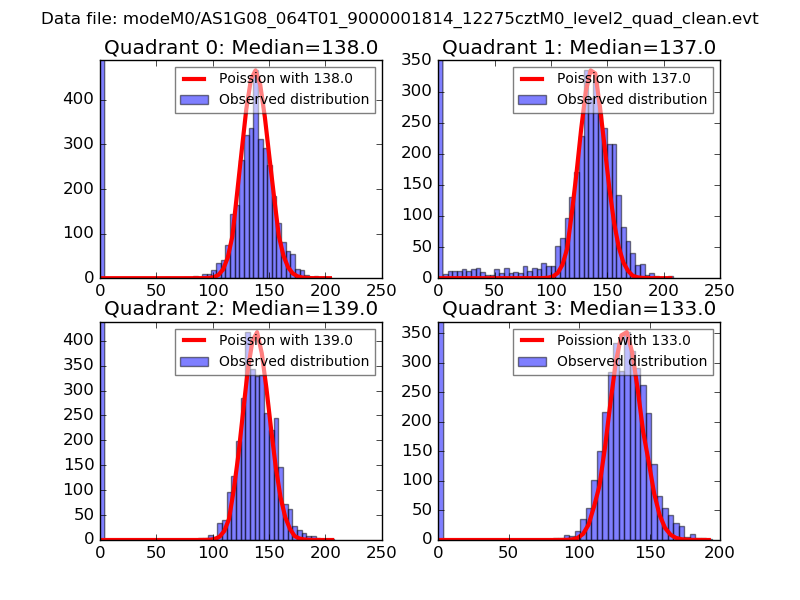 |
 |
| Quadrant-wise count rates Data is divided into 100 sec bins |
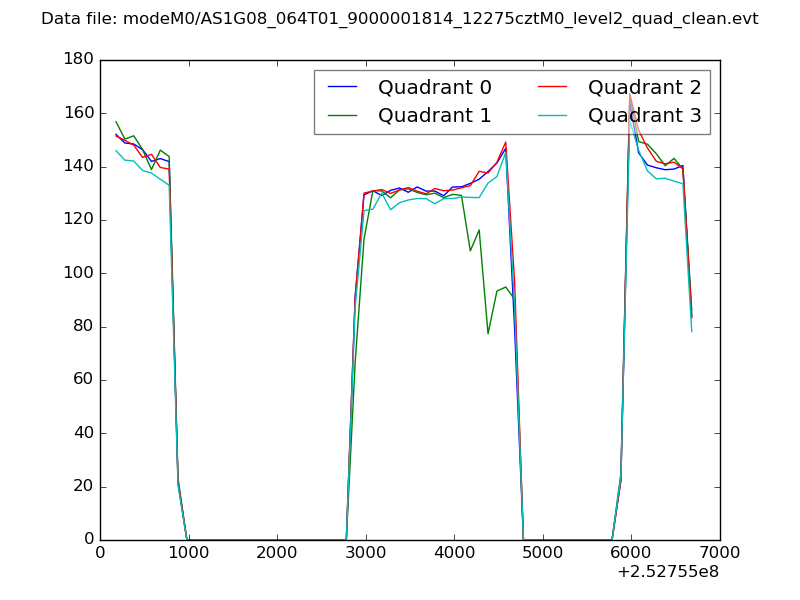 |
|
| Module-wise count rates for Quadrant A Data is divided into 100 sec bins |
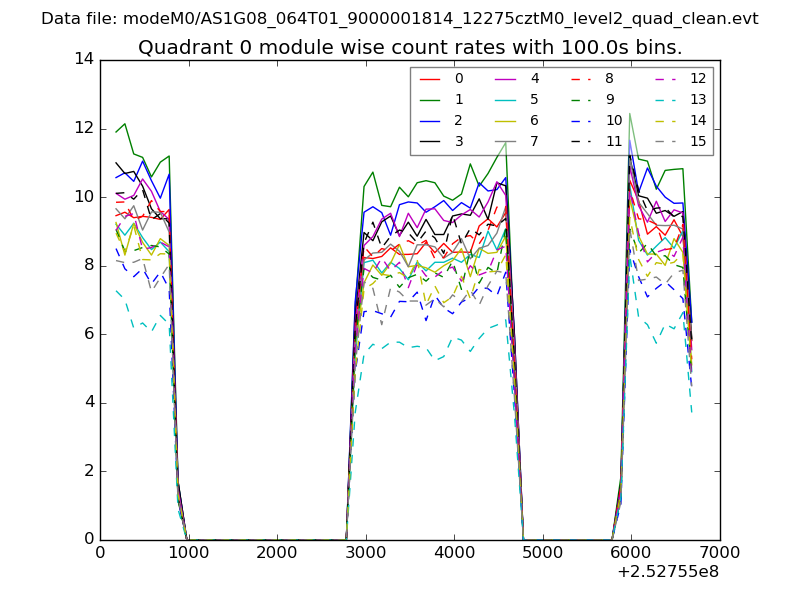 |
 |
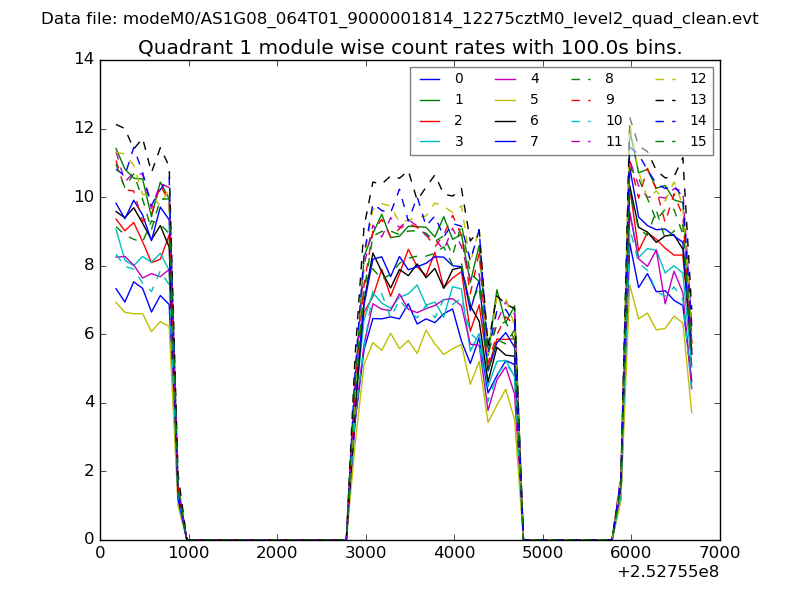
| Module-wise count rates for Quadrant B Data is divided into 100 sec bins |
 |
 |
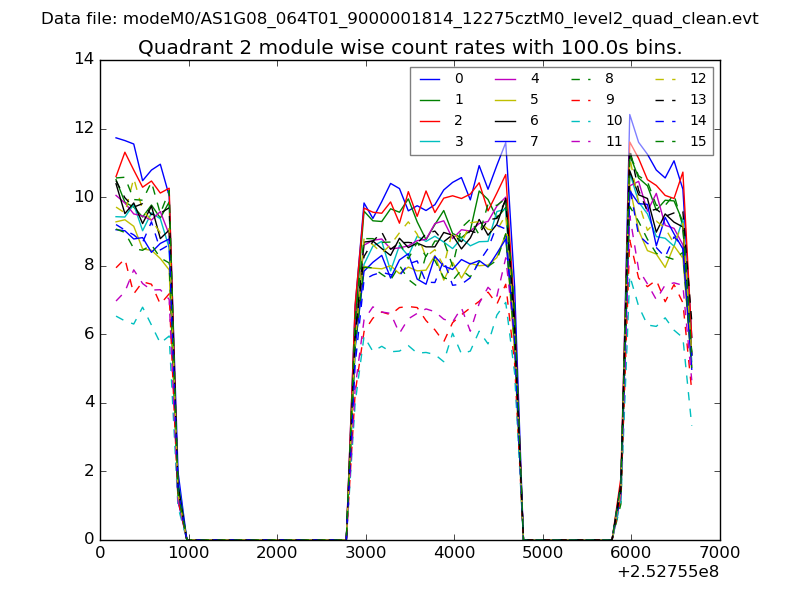
| Module-wise count rates for Quadrant C Data is divided into 100 sec bins |
 |
 |
| Module-wise count rates for Quadrant D Data is divided into 100 sec bins |
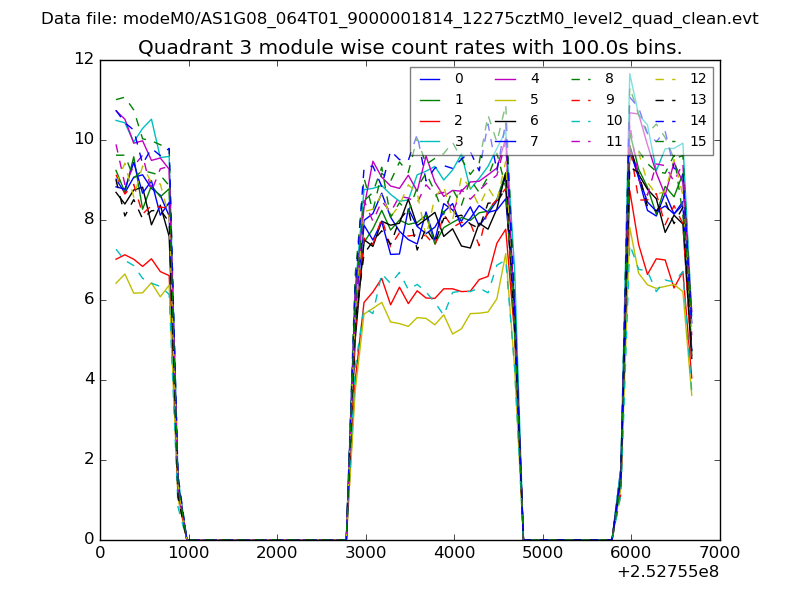 |
 |
| Parameter | Plot |
|---|---|
| CZT HV Monitor | 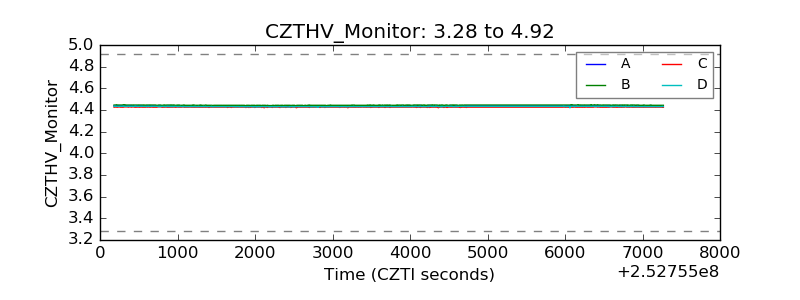 |
| D_VDD | 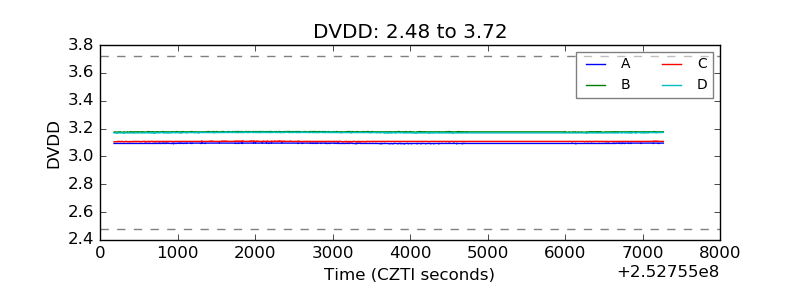 |
| Temperature 1 | 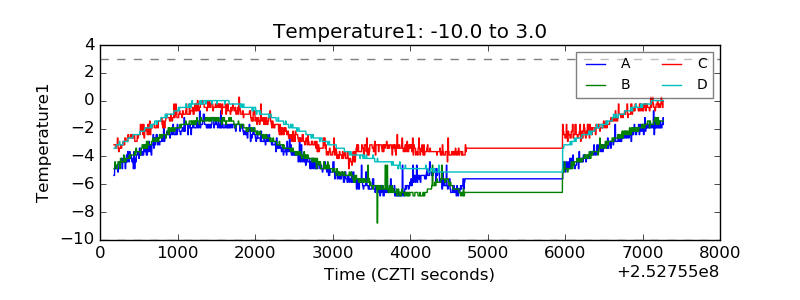 |
| Veto HV Monitor | 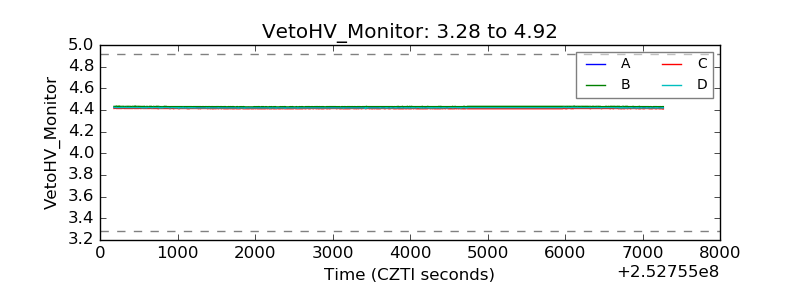 |
| Veto LLD | 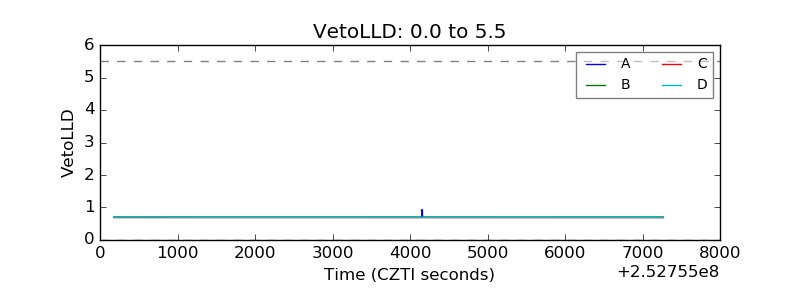 |
| Alpha Counter | 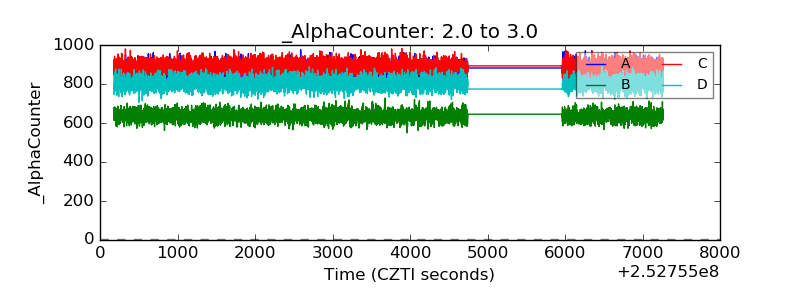 |
| _CPM_Rate | 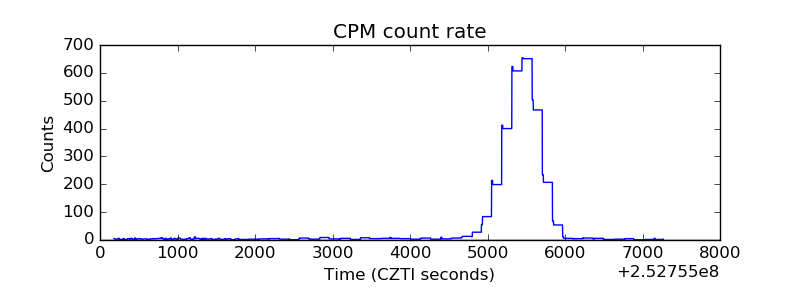 |
| CZT Counter |  |
| +2.5 Volts monitor |  |
| +5 Volts monitor |  |
| _ROLL_ROT | 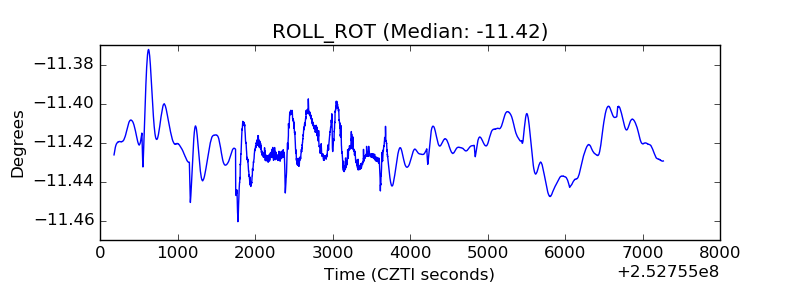 |
| _Roll_DEC | 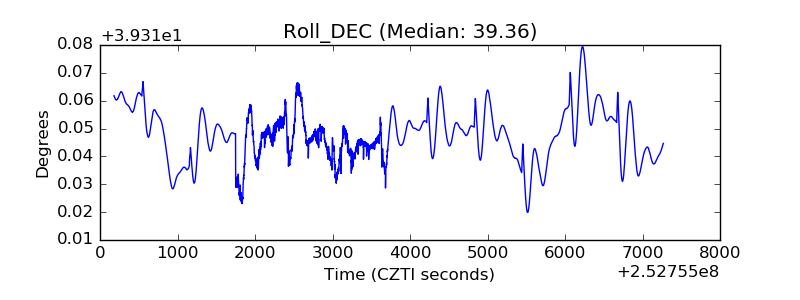 |
| _Roll_RA | 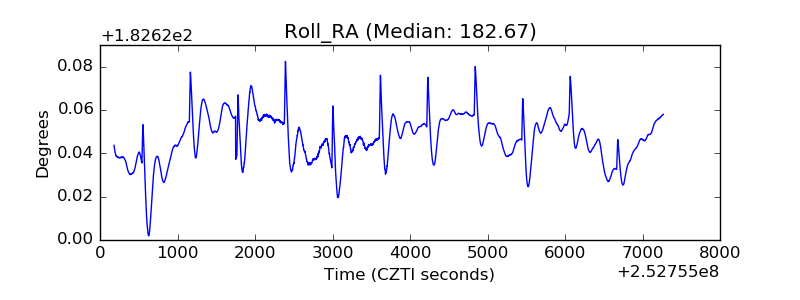 |
| Veto Counter | 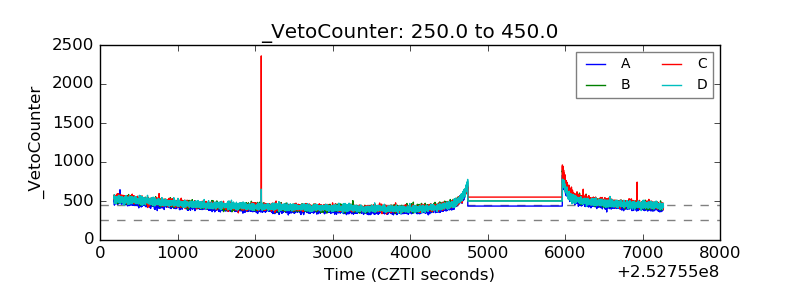 |