| Param | Original file | Final file |
|---|---|---|
| Filename | modeM0/AS1G08_064T01_9000001814_12277cztM0_level2.evt | modeM0/AS1G08_064T01_9000001814_12277cztM0_level2_quad_clean.evt |
| Size (bytes) | 746,982,720 | 65,980,800 |
| Size | 712.4 MB | 62.9 MB |
| Events in quadrant A | 3,880,818 | 396,835 |
| Events in quadrant B | 9,452,723 | 354,430 |
| Events in quadrant C | 3,138,973 | 401,119 |
| Events in quadrant D | 5,684,872 | 365,857 |
| Mode M9 | |||
|---|---|---|---|
| Quadrant | BADHDUFLAG | Total packets | Discarded packets |
| A | 0 | 7 | 0 |
| B | 0 | 7 | 0 |
| C | 0 | 7 | 0 |
| D | 0 | 7 | 0 |
| Mode SS | |||
|---|---|---|---|
| Quadrant | BADHDUFLAG | Total packets | Discarded packets |
| A | 0 | 140 | 0 |
| B | 0 | 140 | 0 |
| C | 0 | 140 | 0 |
| D | 0 | 140 | 0 |
| Mode M0 | |||
|---|---|---|---|
| Quadrant | BADHDUFLAG | Total packets | Discarded packets |
| A | 0 | 15962 | 2 |
| B | 0 | 32641 | 1 |
| C | 0 | 14053 | 1 |
| D | 0 | 21562 | 1 |
| Quadrant | Total seconds | Saturated seconds | Saturation percentage |
|---|---|---|---|
| A | 6868 | 97 | 1.412347% |
| B | 6868 | 2889 | 42.064648% |
| C | 6868 | 62 | 0.902737% |
| D | 6868 | 680 | 9.900990% |
Noise dominated data is calculated using 1-second bins in cleaned event files. If a bin has >2000 counts, and if more than 50% of those come from <1% of pixels, then it is considered to be noise-dominated and hence unusable.
| Quadrant | # 1 sec bins | Bins with >0 counts | Bins with >2000 counts | High rate bins dominated by noise | Noise dominated (total time) | Noise dominated (detector-on time) | Marked lightcurve |
|---|---|---|---|---|---|---|---|
| A | 7560 | 6871 | 12 | 12 | 0.16% | 0.17% | 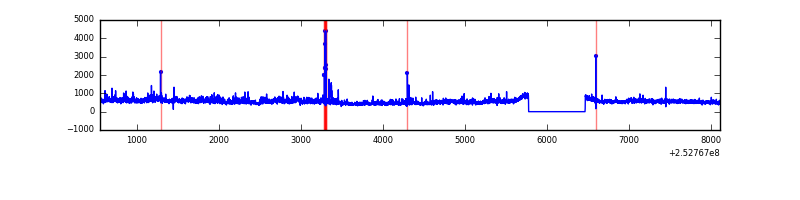 |
| B | 7559 | 6869 | 2173 | 2173 | 28.75% | 31.63% |  |
| C | 7560 | 6871 | 0 | 0 | 0.00% | 0.00% | 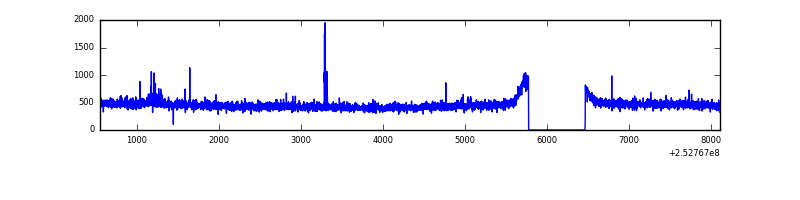 |
| D | 7560 | 6871 | 571 | 571 | 7.55% | 8.31% | 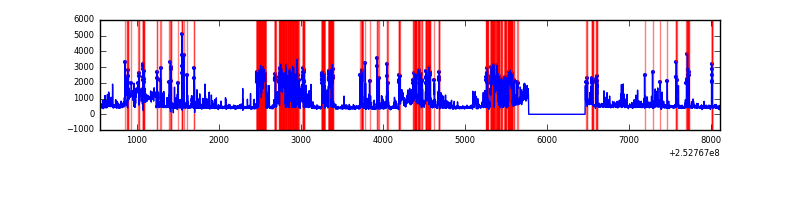 |
Top three noisy pixels from each quadrant. If the there are fewer than three noisy pixels in the level2.evt file, extra rows are filled as -1
| Pixel properties | Quadrant properties | ||||||
|---|---|---|---|---|---|---|---|
| Quadrant | DetID | PixID | Counts | Sigma | Mean | Median | Sigma |
| A | 1 | 162 | 129756 | 770.78 | 821 | 802 | 167.3 |
| A | 8 | 15 | 103941 | 616.48 | 821 | 802 | 167.3 |
| A | 1 | 178 | 74220 | 438.83 | 821 | 802 | 167.3 |
| B | 0 | 85 | 4132027 | 34424.32 | 626 | 610 | 120.0 |
| B | 4 | 239 | 2481952 | 20675.36 | 626 | 610 | 120.0 |
| B | 3 | 64 | 149743 | 1242.63 | 626 | 610 | 120.0 |
| C | 3 | 233 | 16351 | 83.95 | 796 | 799 | 185.2 |
| C | 14 | 234 | 11722 | 58.96 | 796 | 799 | 185.2 |
| C | 13 | 61 | 5989 | 28.02 | 796 | 799 | 185.2 |
| D | 1 | 52 | 2109787 | 11186.01 | 776 | 754 | 188.5 |
| D | 10 | 199 | 145591 | 768.2 | 776 | 754 | 188.5 |
| D | 13 | 104 | 138396 | 730.03 | 776 | 754 | 188.5 |
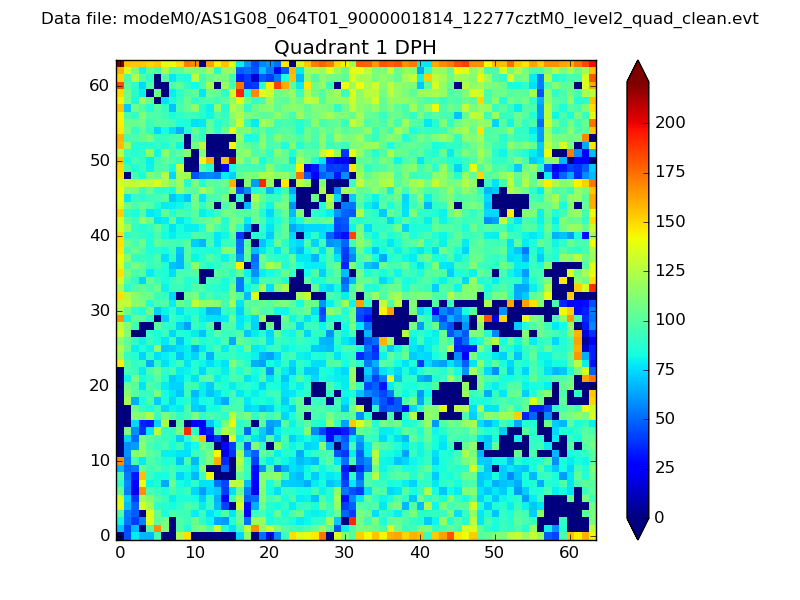
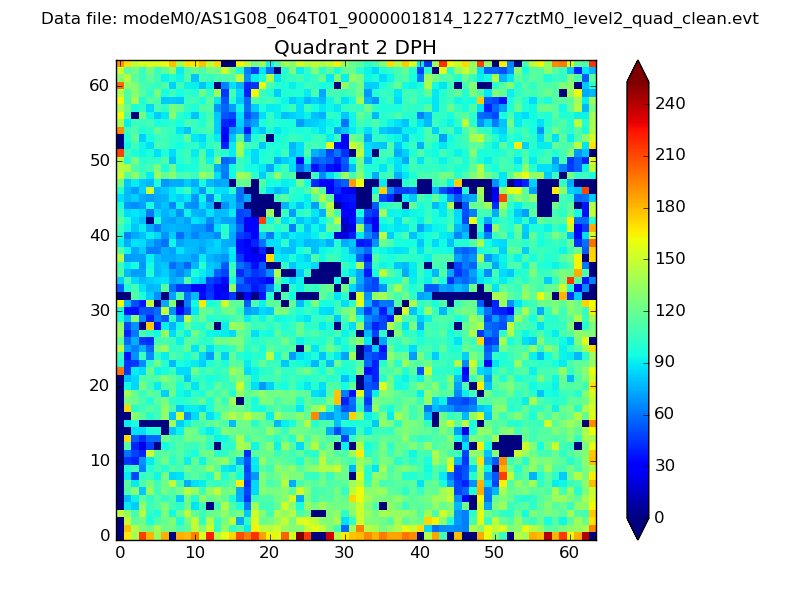
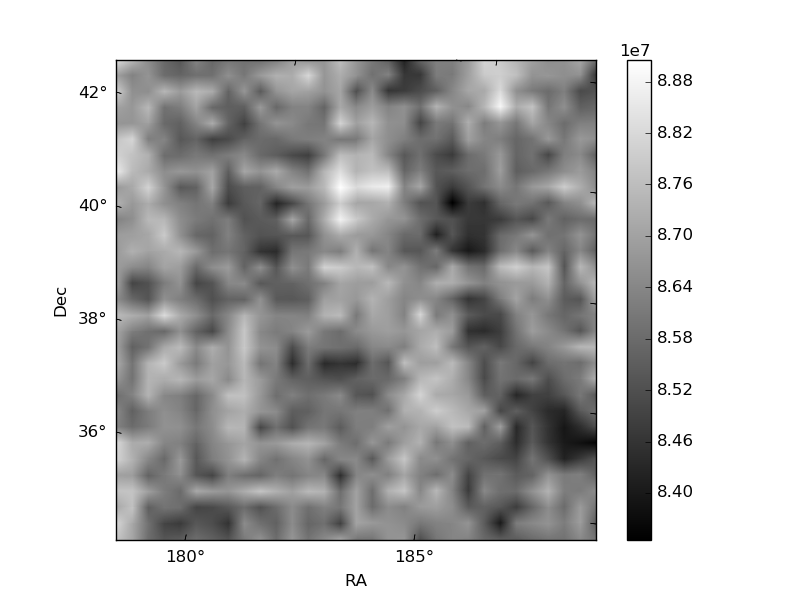
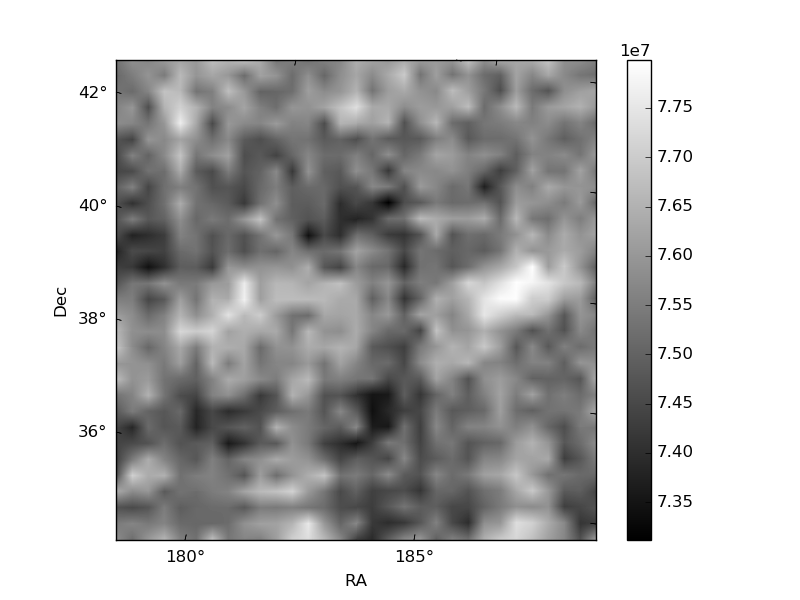
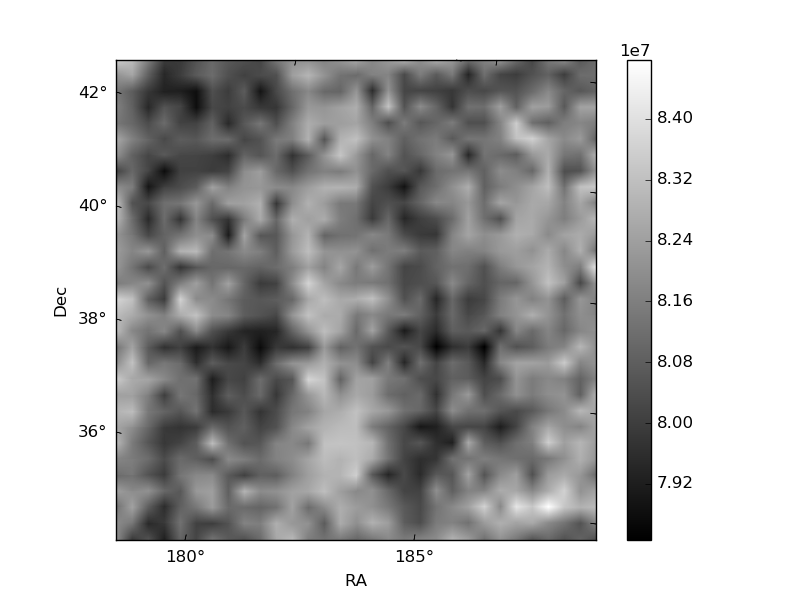
Histogram calculated using DETX and DETY for each event in the final _common_clean file
| Quadrant A | 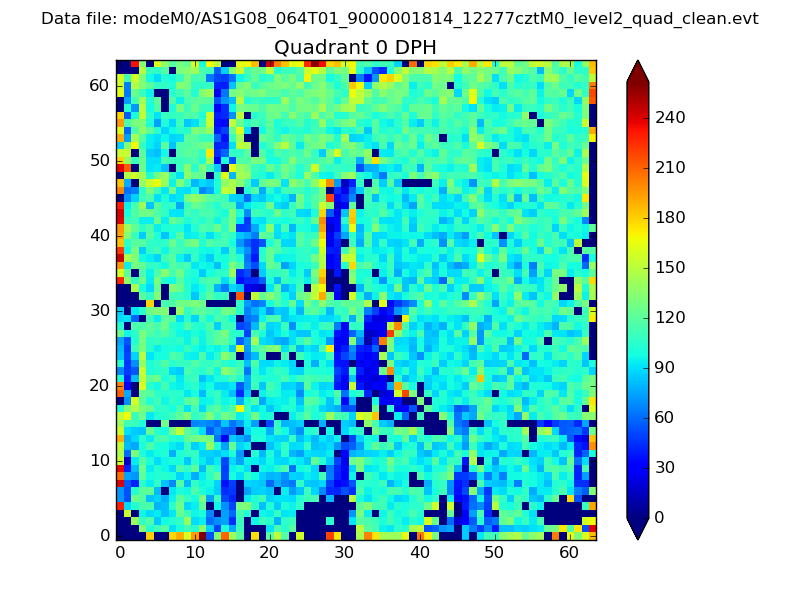 |
 |
Quadrant B |
|---|---|---|---|
| Quadrant D | 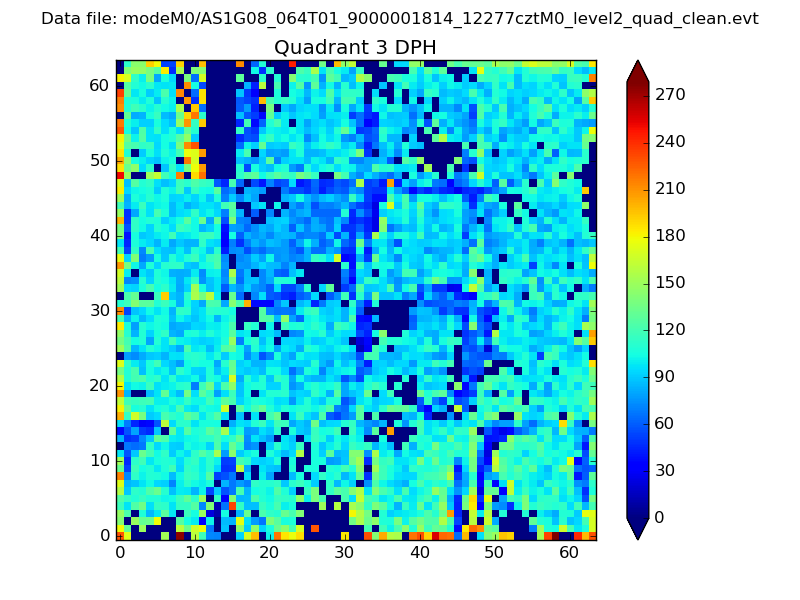 |
 |
Quadrant C |
| Plot type | Count rate plots | Images |
|---|---|---|
| Comparison with Poisson distribution Blue bars denote a histogram of data divided into 1 sec bins. Red curve is a Poisson curve with rate = median count rate of data. |
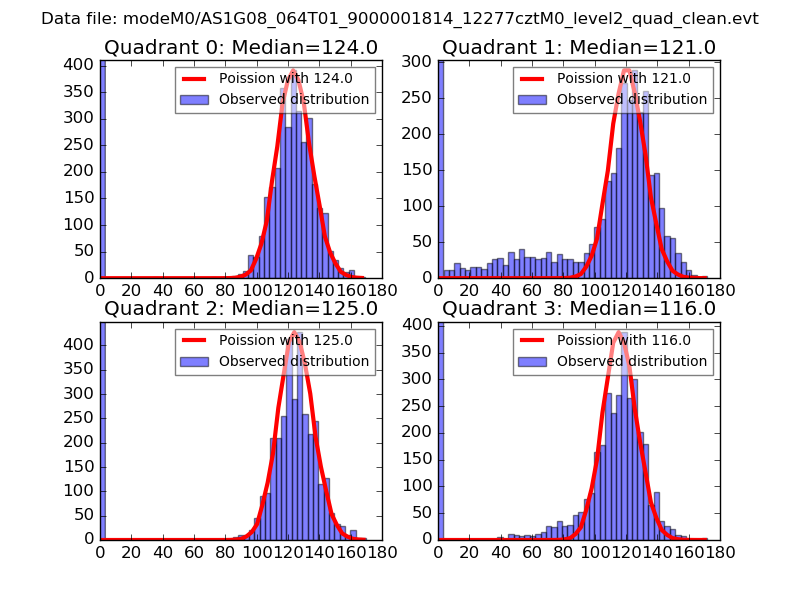 |
 |
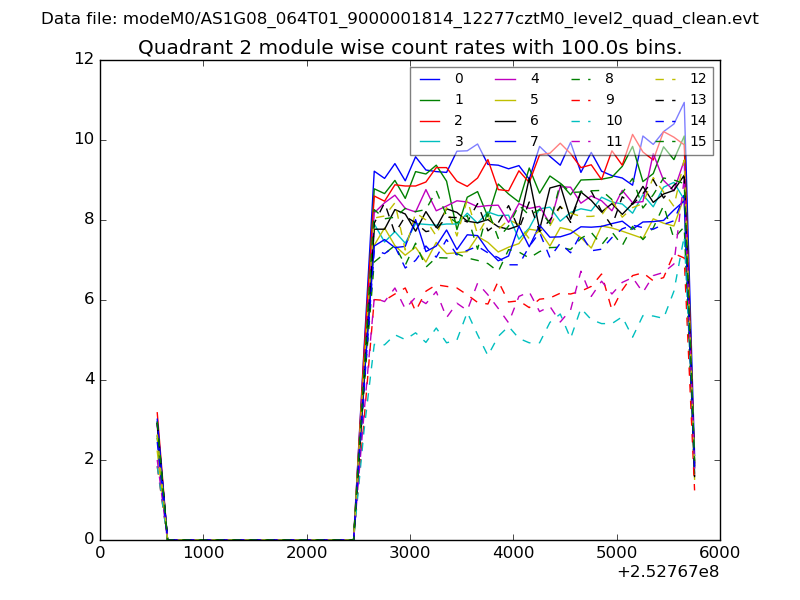
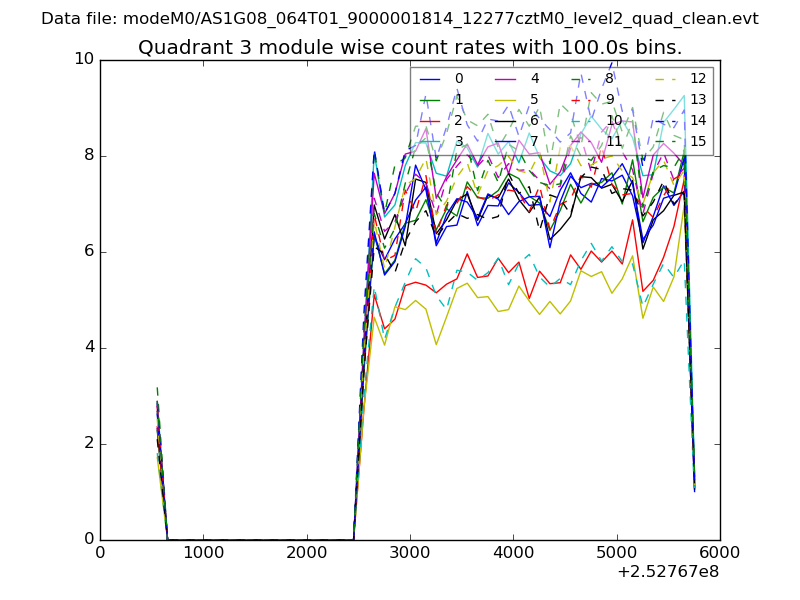
| Quadrant-wise count rates Data is divided into 100 sec bins |
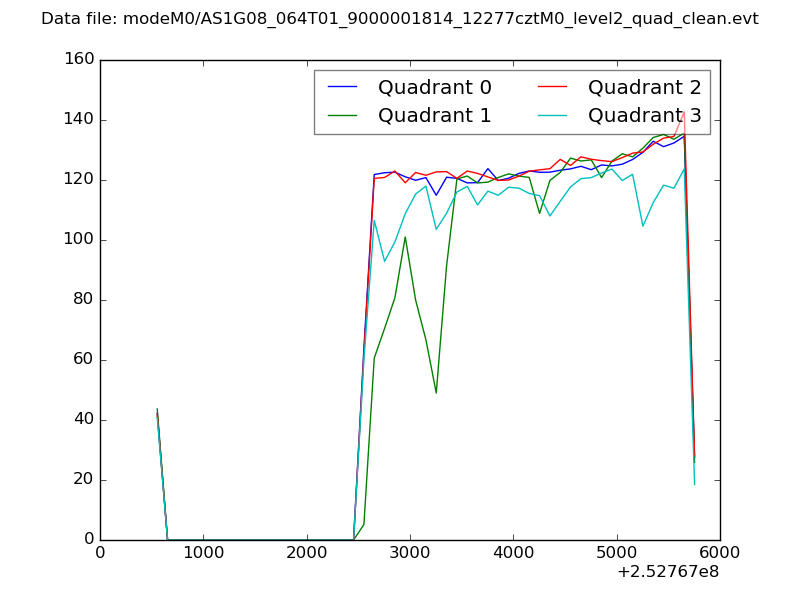 |
|
| Module-wise count rates for Quadrant A Data is divided into 100 sec bins |
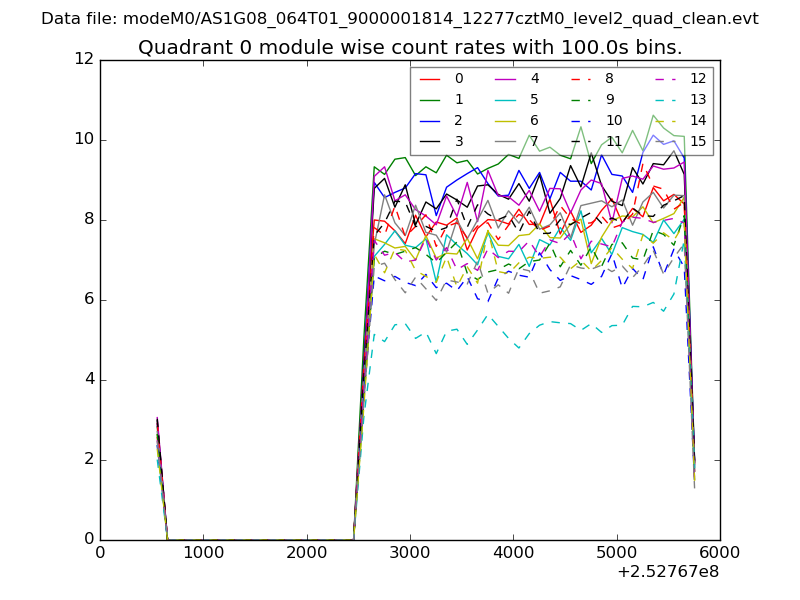 |
 |
| Module-wise count rates for Quadrant B Data is divided into 100 sec bins |
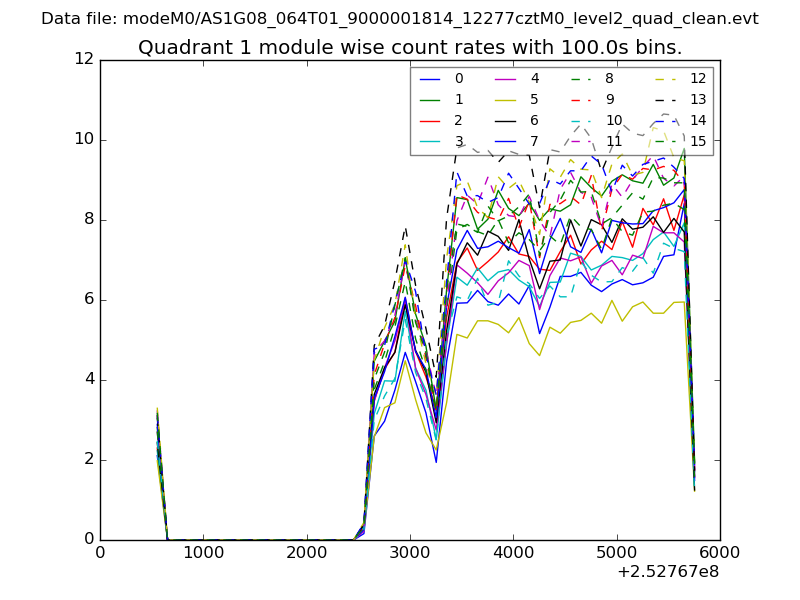 |
 |
| Module-wise count rates for Quadrant C Data is divided into 100 sec bins |
 |
 |
| Module-wise count rates for Quadrant D Data is divided into 100 sec bins |
 |
 |
| Parameter | Plot |
|---|---|
| CZT HV Monitor | 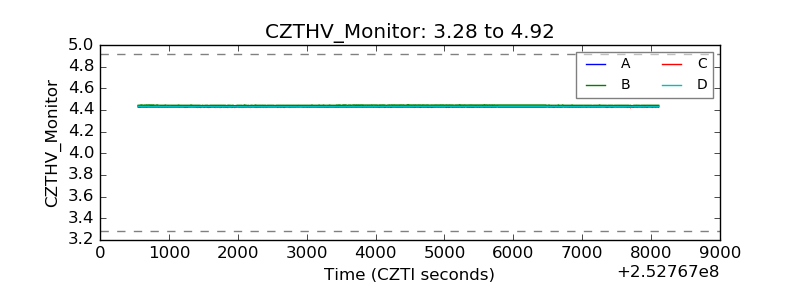 |
| D_VDD | 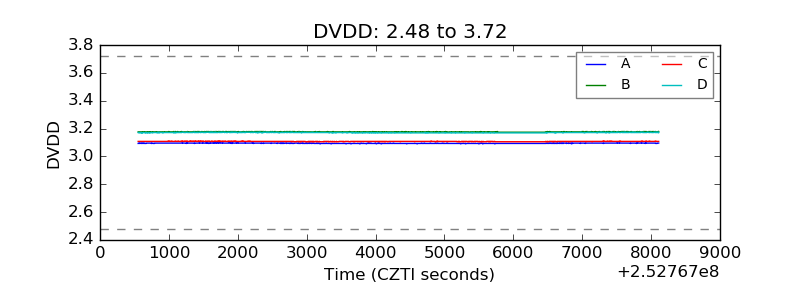 |
| Temperature 1 | 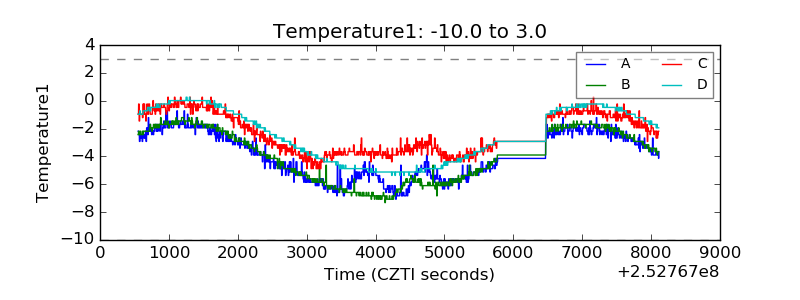 |
| Veto HV Monitor | 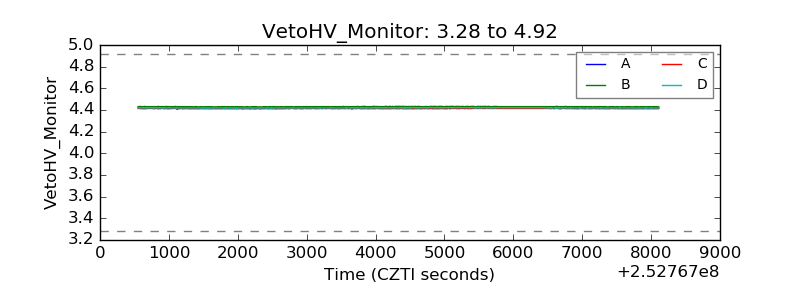 |
| Veto LLD | 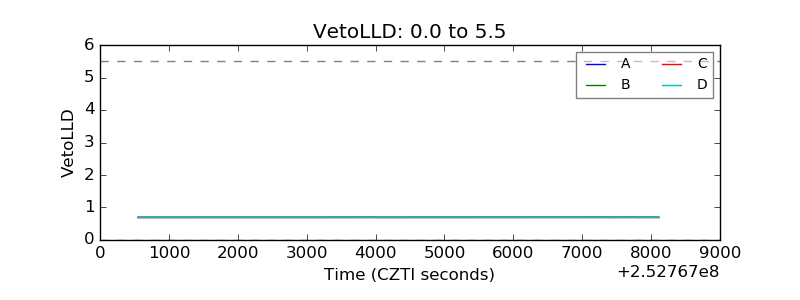 |
| Alpha Counter | 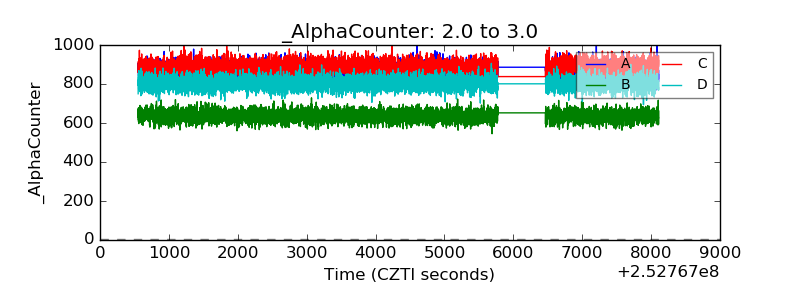 |
| _CPM_Rate | 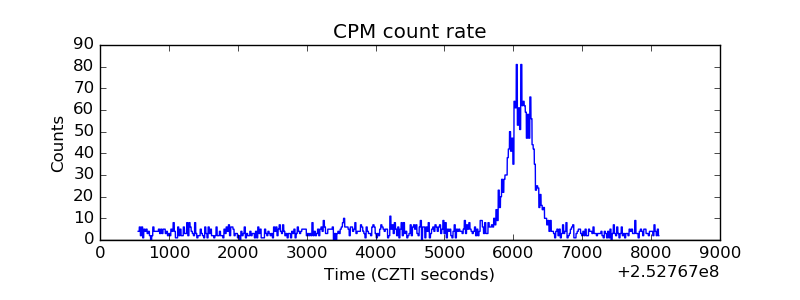 |
| CZT Counter | 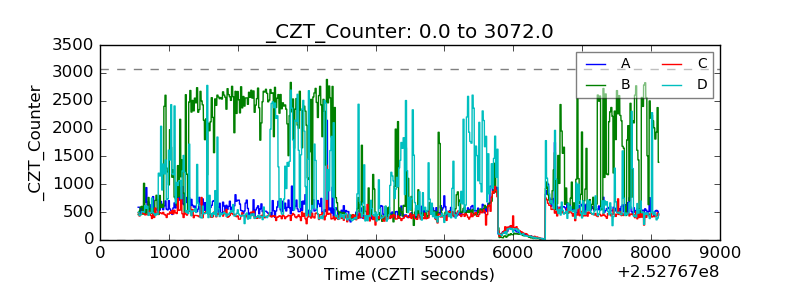 |
| +2.5 Volts monitor |  |
| +5 Volts monitor |  |
| _ROLL_ROT | 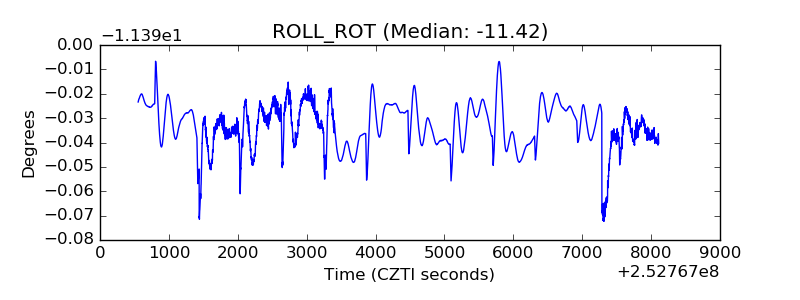 |
| _Roll_DEC | 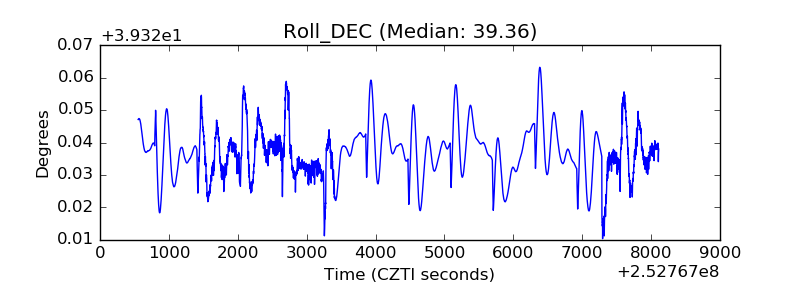 |
| _Roll_RA |  |
| Veto Counter | 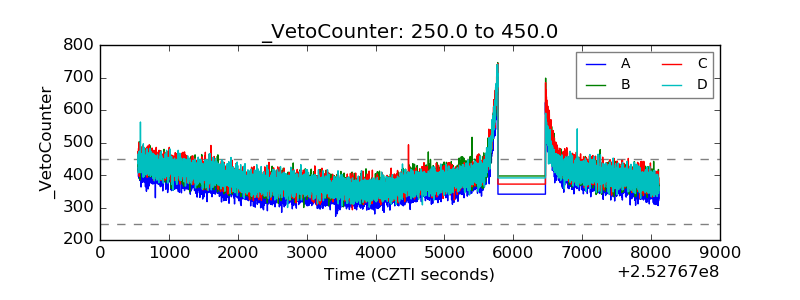 |