| Param | Original file | Final file |
|---|---|---|
| Filename | modeM0/AS1G08_064T01_9000001814_12279cztM0_level2.evt | modeM0/AS1G08_064T01_9000001814_12279cztM0_level2_quad_clean.evt |
| Size (bytes) | 638,544,960 | 82,929,600 |
| Size | 609.0 MB | 79.1 MB |
| Events in quadrant A | 4,323,561 | 505,389 |
| Events in quadrant B | 6,834,940 | 471,503 |
| Events in quadrant C | 3,556,981 | 508,014 |
| Events in quadrant D | 4,101,536 | 491,580 |
| Mode M9 | |||
|---|---|---|---|
| Quadrant | BADHDUFLAG | Total packets | Discarded packets |
| A | 0 | 6 | 0 |
| B | 0 | 6 | 0 |
| C | 0 | 6 | 0 |
| D | 0 | 6 | 0 |
| Mode SS | |||
|---|---|---|---|
| Quadrant | BADHDUFLAG | Total packets | Discarded packets |
| A | 0 | 158 | 0 |
| B | 0 | 158 | 0 |
| C | 0 | 158 | 0 |
| D | 0 | 158 | 0 |
| Mode M0 | |||
|---|---|---|---|
| Quadrant | BADHDUFLAG | Total packets | Discarded packets |
| A | 0 | 17998 | 3 |
| B | 0 | 25527 | 2 |
| C | 0 | 15953 | 2 |
| D | 0 | 17564 | 2 |
| Quadrant | Total seconds | Saturated seconds | Saturation percentage |
|---|---|---|---|
| A | 7684 | 191 | 2.485685% |
| B | 7684 | 1627 | 21.173868% |
| C | 7684 | 117 | 1.522644% |
| D | 7684 | 181 | 2.355544% |
Noise dominated data is calculated using 1-second bins in cleaned event files. If a bin has >2000 counts, and if more than 50% of those come from <1% of pixels, then it is considered to be noise-dominated and hence unusable.
| Quadrant | # 1 sec bins | Bins with >0 counts | Bins with >2000 counts | High rate bins dominated by noise | Noise dominated (total time) | Noise dominated (detector-on time) | Marked lightcurve |
|---|---|---|---|---|---|---|---|
| A | 8290 | 7687 | 1 | 1 | 0.01% | 0.01% | 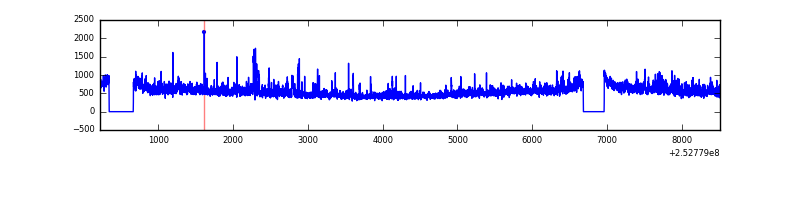 |
| B | 8290 | 7687 | 769 | 769 | 9.28% | 10.00% | 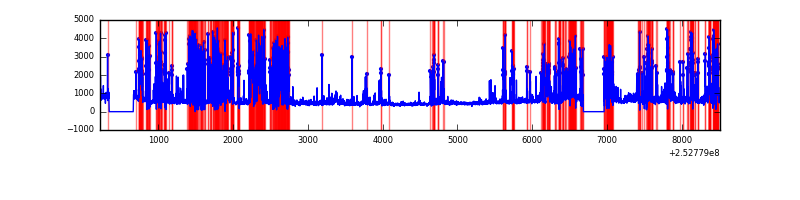 |
| C | 8290 | 7687 | 2 | 2 | 0.02% | 0.03% | 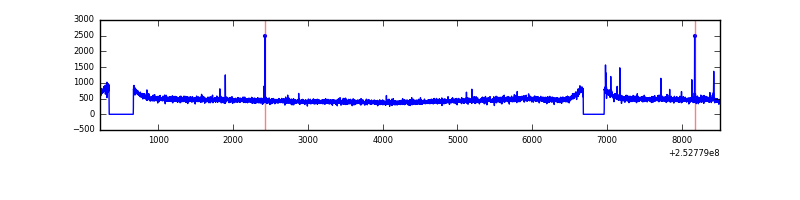 |
| D | 8290 | 7687 | 42 | 42 | 0.51% | 0.55% | 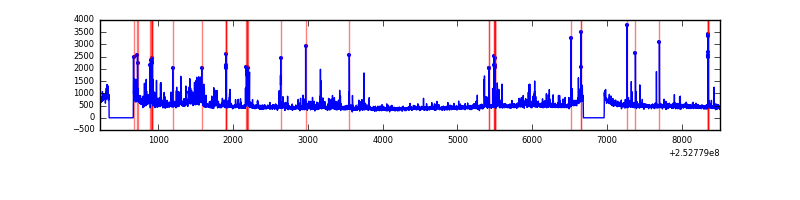 |
Top three noisy pixels from each quadrant. If the there are fewer than three noisy pixels in the level2.evt file, extra rows are filled as -1
| Pixel properties | Quadrant properties | ||||||
|---|---|---|---|---|---|---|---|
| Quadrant | DetID | PixID | Counts | Sigma | Mean | Median | Sigma |
| A | 11 | 29 | 130007 | 675.08 | 926 | 906 | 191.2 |
| A | 1 | 162 | 124231 | 644.87 | 926 | 906 | 191.2 |
| A | 8 | 15 | 99533 | 515.73 | 926 | 906 | 191.2 |
| B | 4 | 239 | 2983336 | 19106.78 | 811 | 789 | 156.1 |
| B | 0 | 85 | 280851 | 1794.13 | 811 | 789 | 156.1 |
| B | 11 | 51 | 169752 | 1082.41 | 811 | 789 | 156.1 |
| C | 1 | 16 | 28515 | 131.83 | 902 | 902 | 209.5 |
| C | 14 | 234 | 9303 | 40.11 | 902 | 902 | 209.5 |
| C | 13 | 61 | 6720 | 27.78 | 902 | 902 | 209.5 |
| D | 13 | 104 | 175502 | 799.1 | 900 | 872 | 218.5 |
| D | 1 | 52 | 171381 | 780.24 | 900 | 872 | 218.5 |
| D | 10 | 50 | 73732 | 333.41 | 900 | 872 | 218.5 |
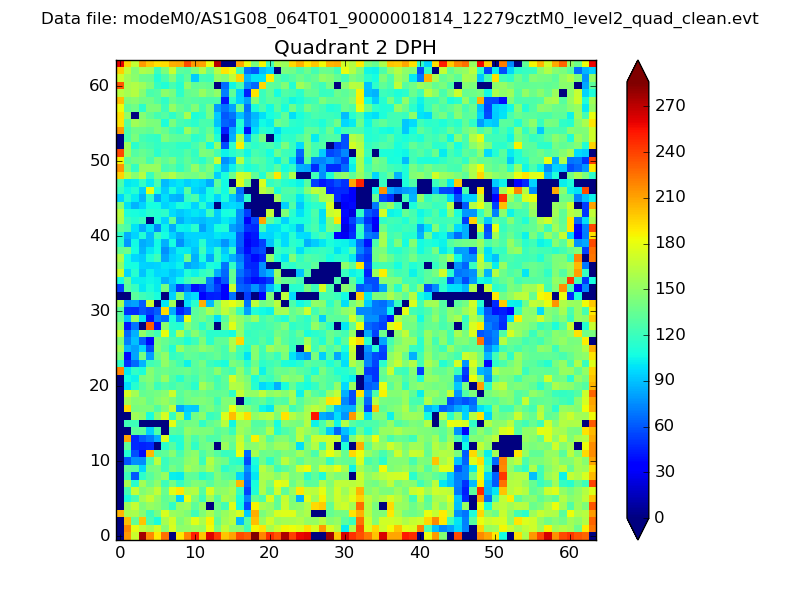
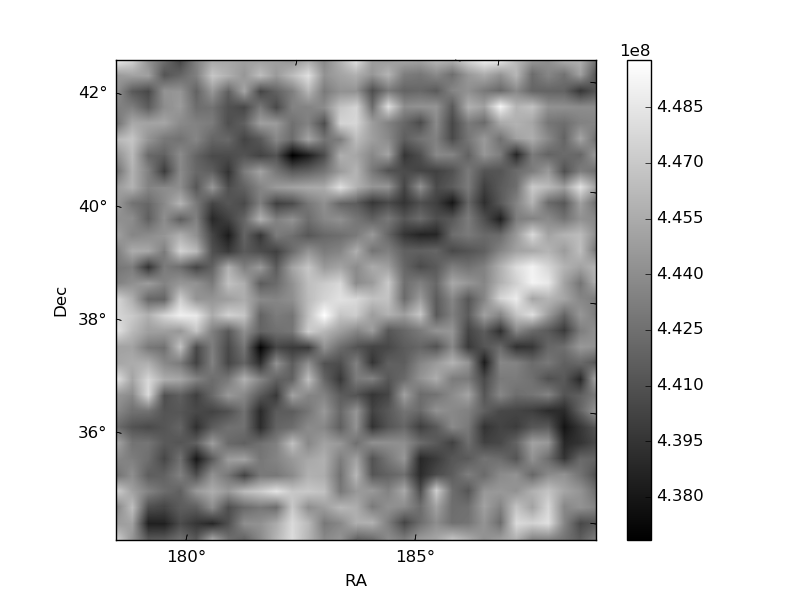
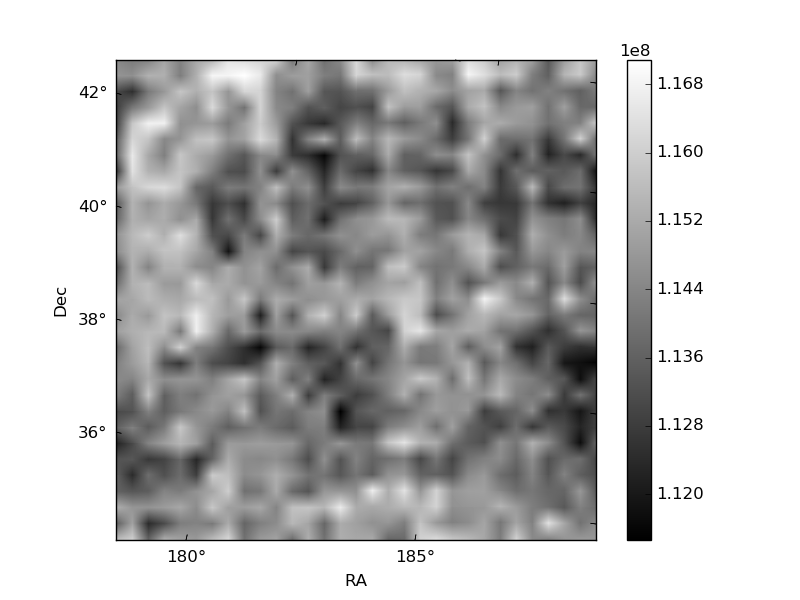
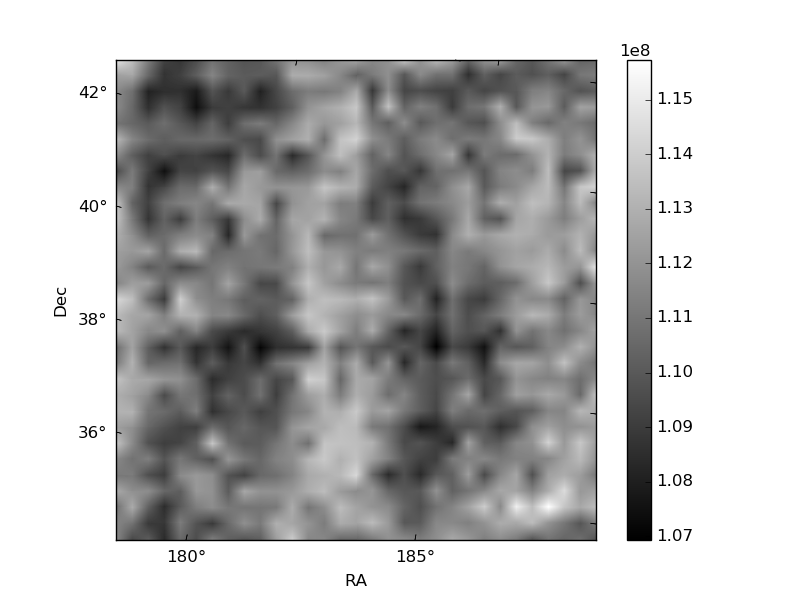
Histogram calculated using DETX and DETY for each event in the final _common_clean file
| Quadrant A | 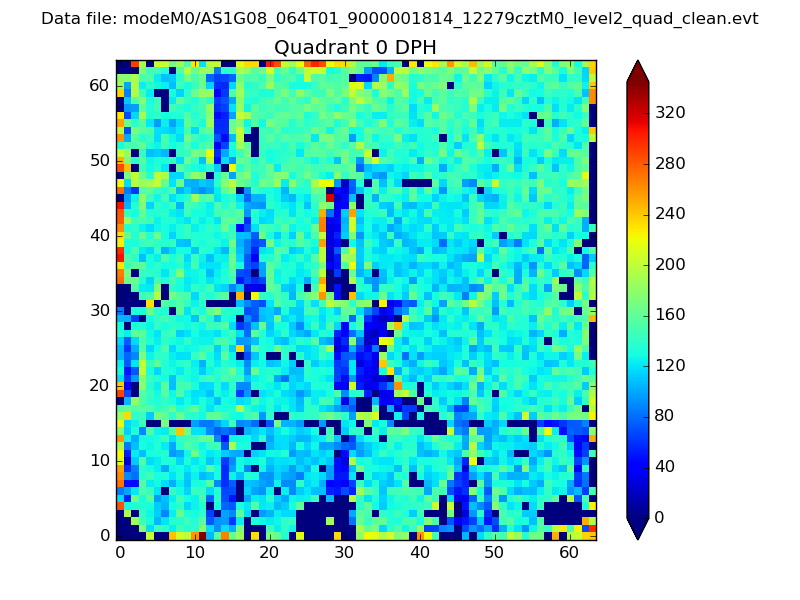 |
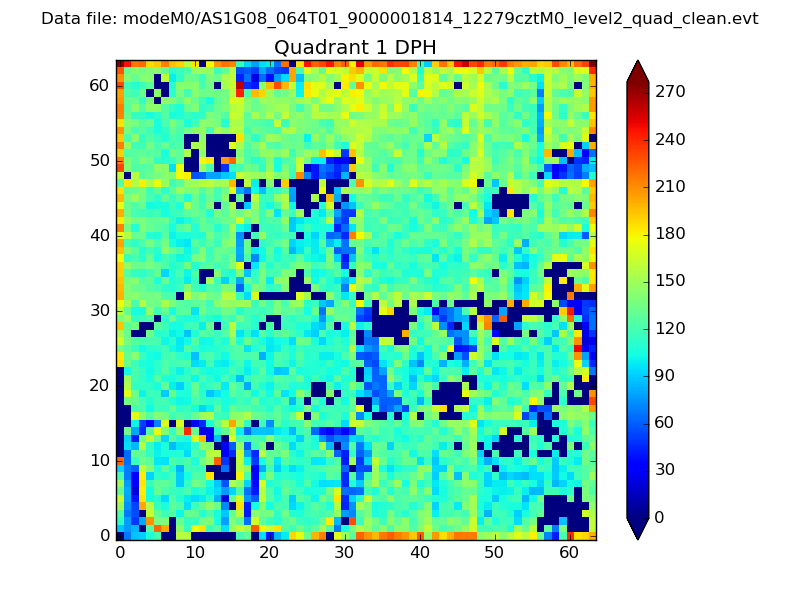 |
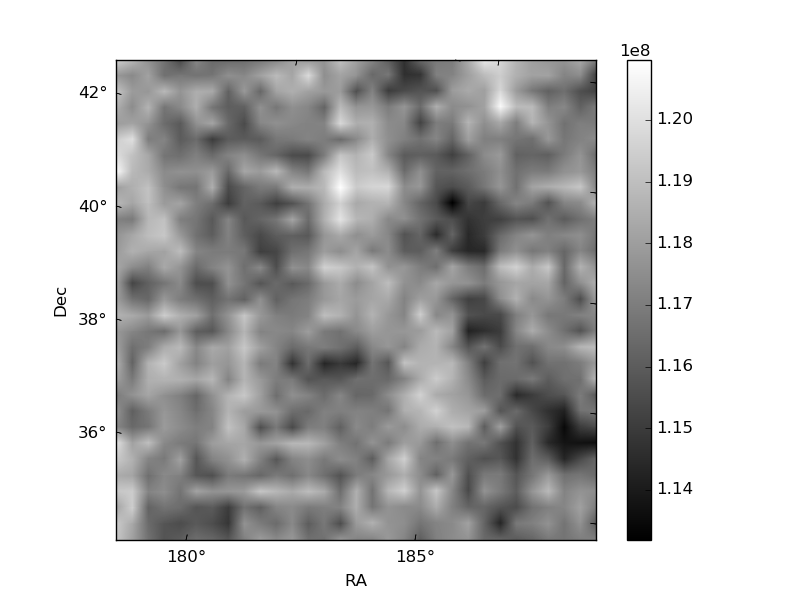
Quadrant B |
|---|---|---|---|
| Quadrant D | 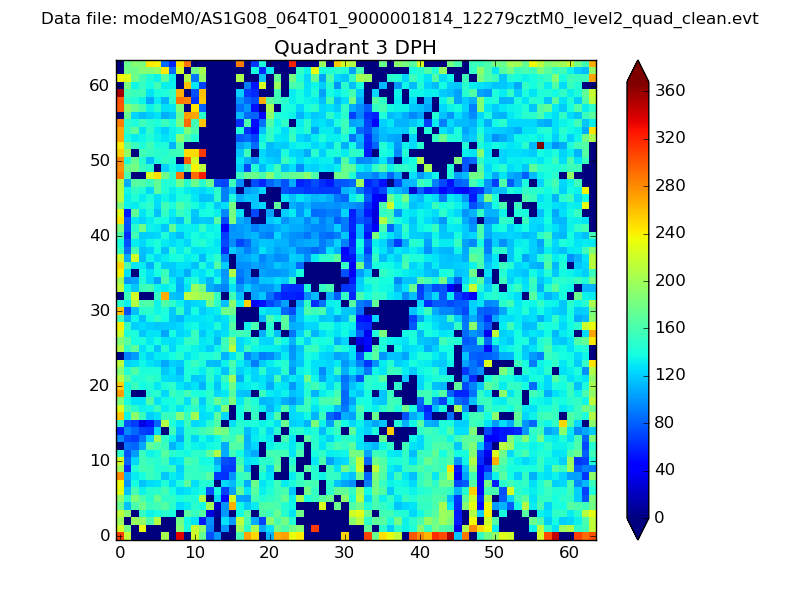 |
 |
Quadrant C |
| Plot type | Count rate plots | Images |
|---|---|---|
| Comparison with Poisson distribution Blue bars denote a histogram of data divided into 1 sec bins. Red curve is a Poisson curve with rate = median count rate of data. |
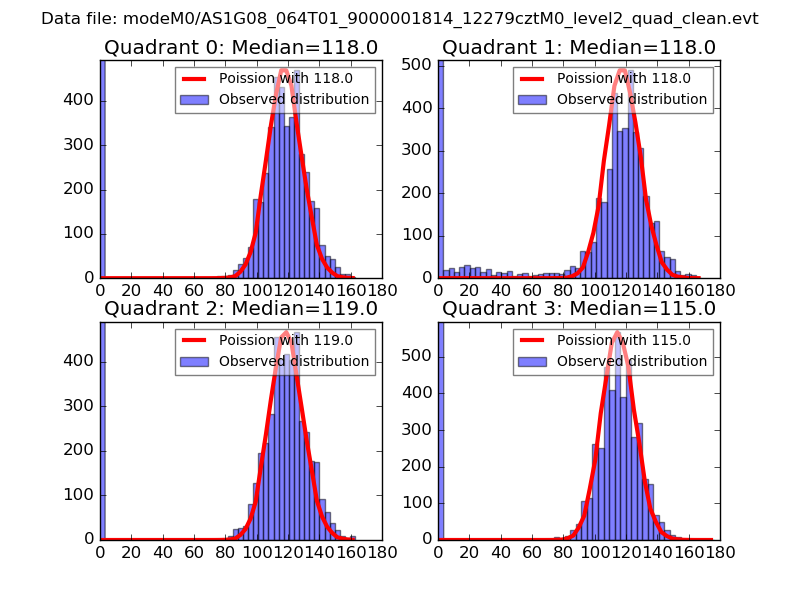 |
 |
| Quadrant-wise count rates Data is divided into 100 sec bins |
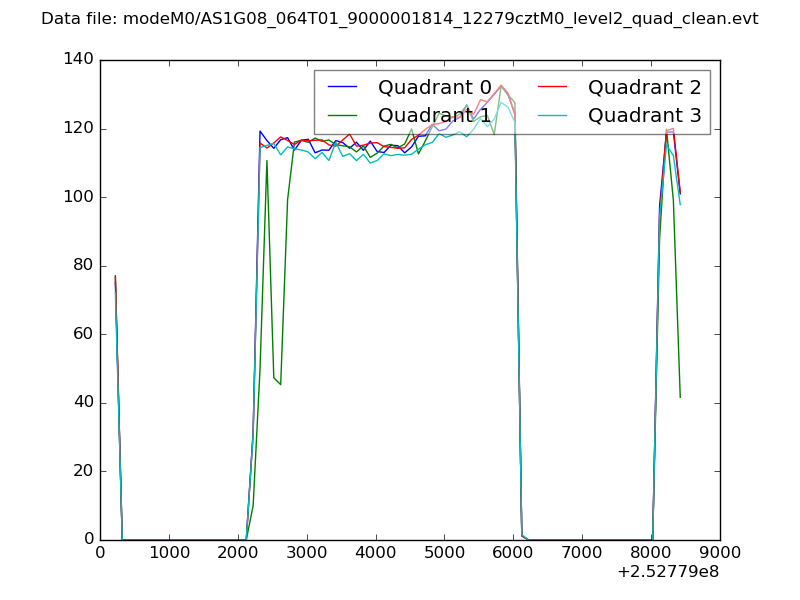 |
|
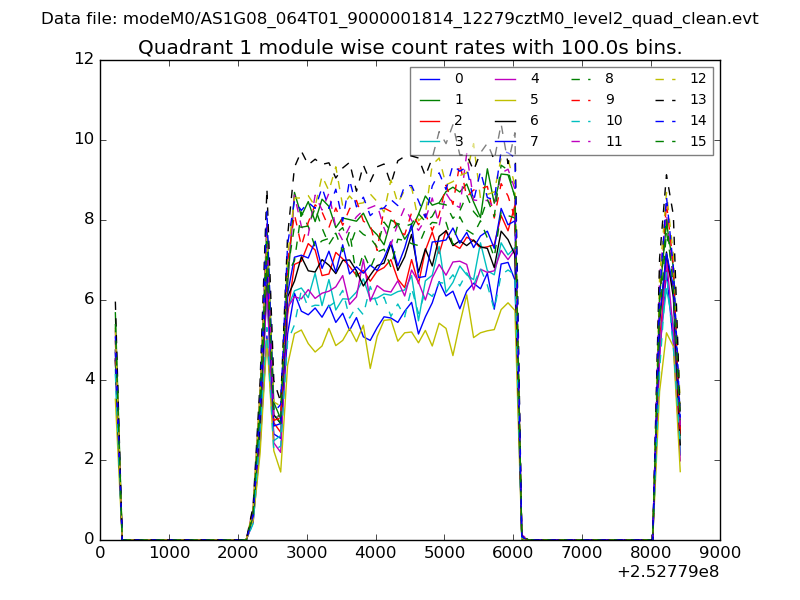
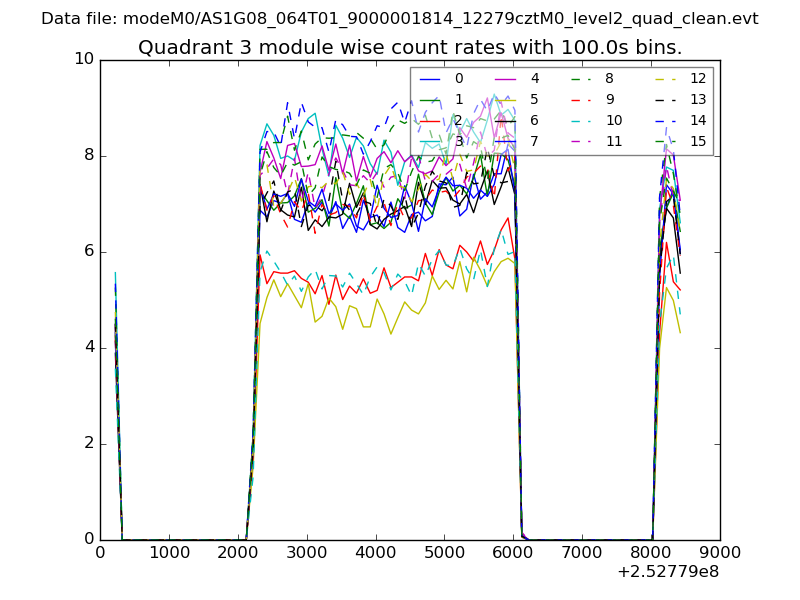
| Module-wise count rates for Quadrant A Data is divided into 100 sec bins |
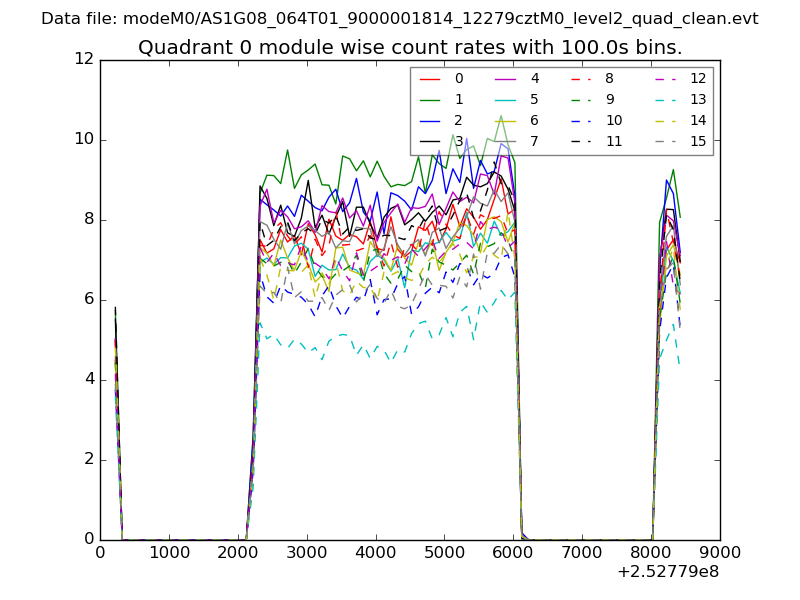 |
 |
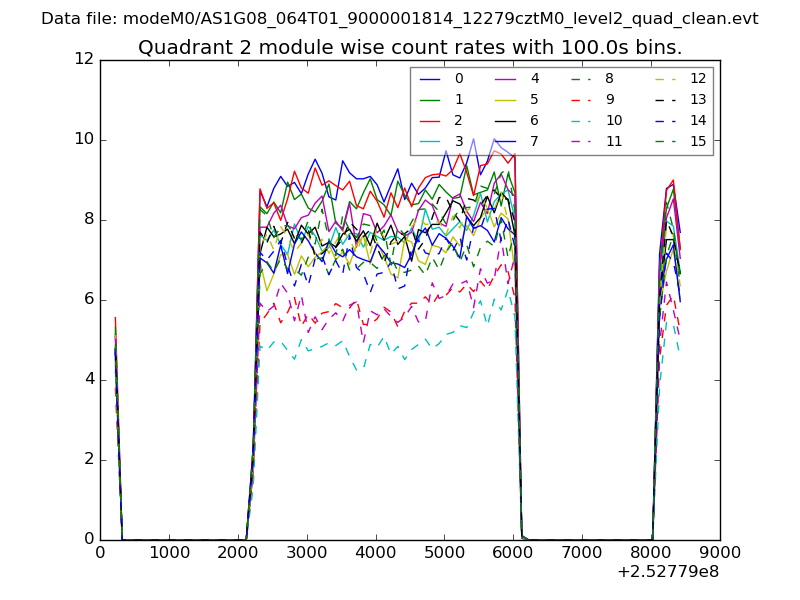
| Module-wise count rates for Quadrant B Data is divided into 100 sec bins |
 |
 |
| Module-wise count rates for Quadrant C Data is divided into 100 sec bins |
 |
 |
| Module-wise count rates for Quadrant D Data is divided into 100 sec bins |
 |
 |
| Parameter | Plot |
|---|---|
| CZT HV Monitor | 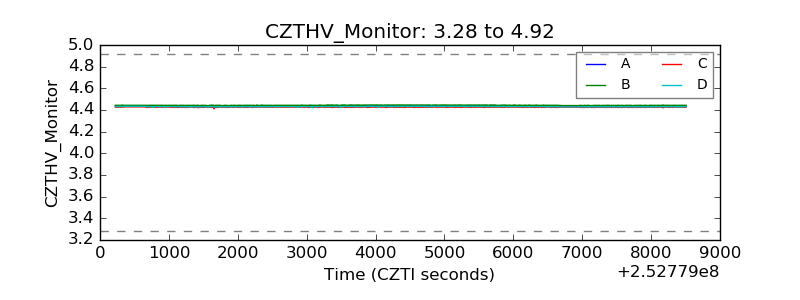 |
| D_VDD | 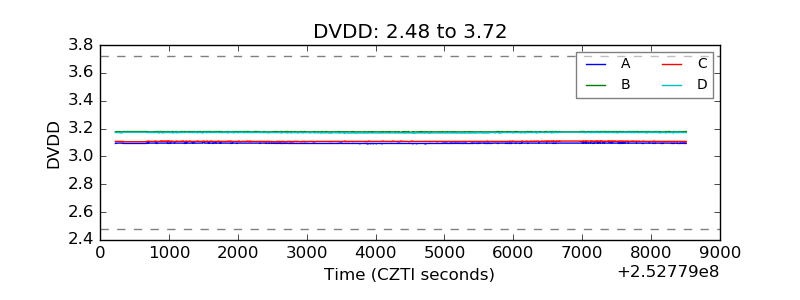 |
| Temperature 1 | 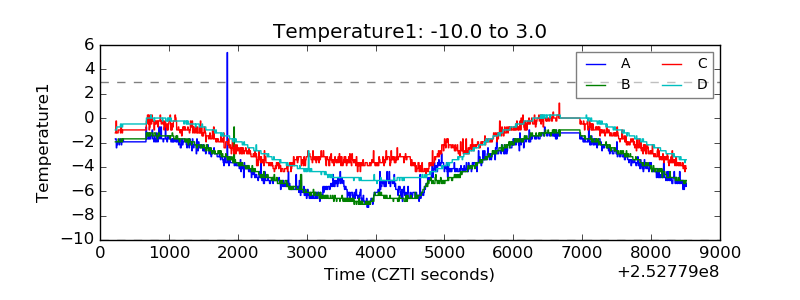 |
| Veto HV Monitor |  |
| Veto LLD | 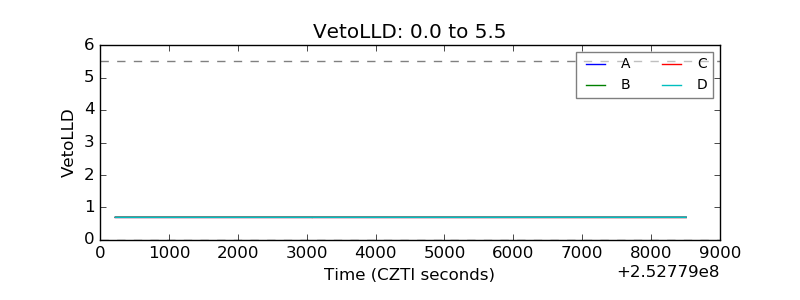 |
| Alpha Counter | 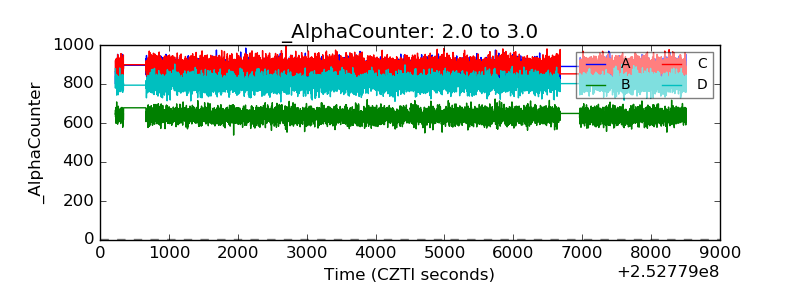 |
| _CPM_Rate | 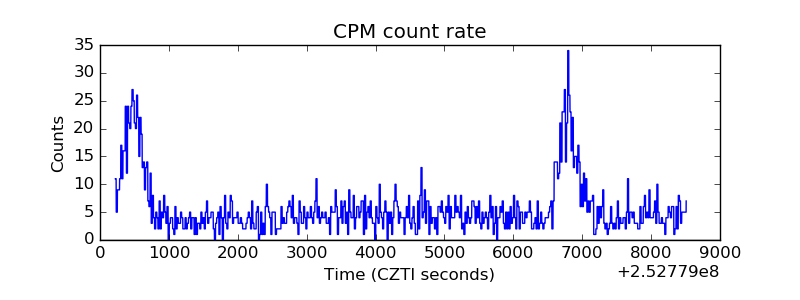 |
| CZT Counter | 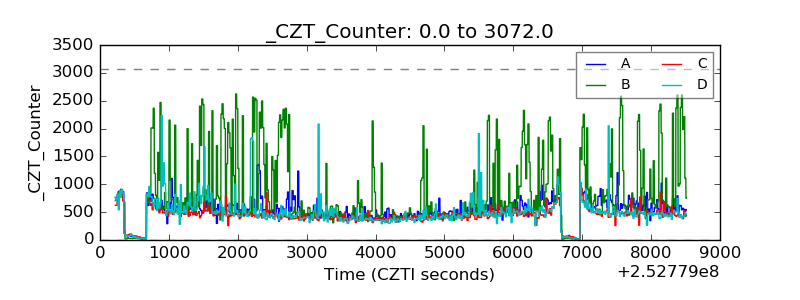 |
| +2.5 Volts monitor |  |
| +5 Volts monitor |  |
| _ROLL_ROT | 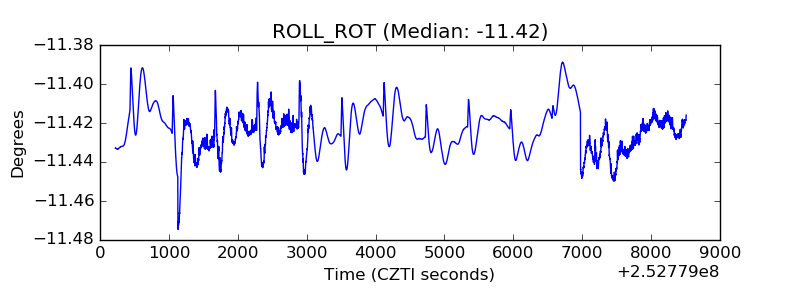 |
| _Roll_DEC | 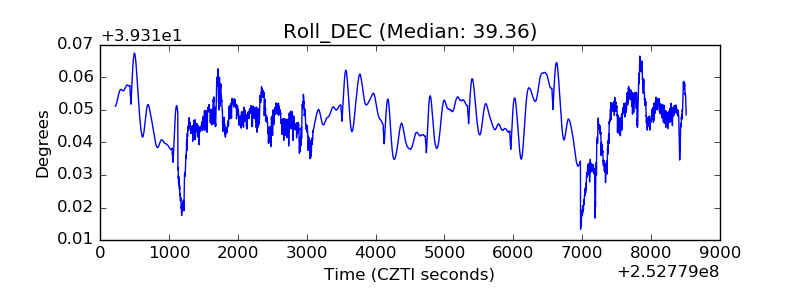 |
| _Roll_RA | 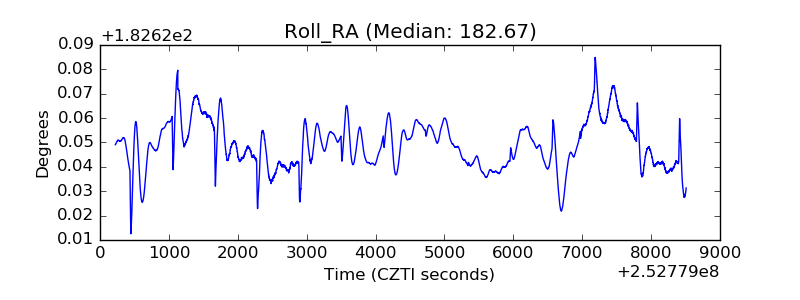 |
| Veto Counter | 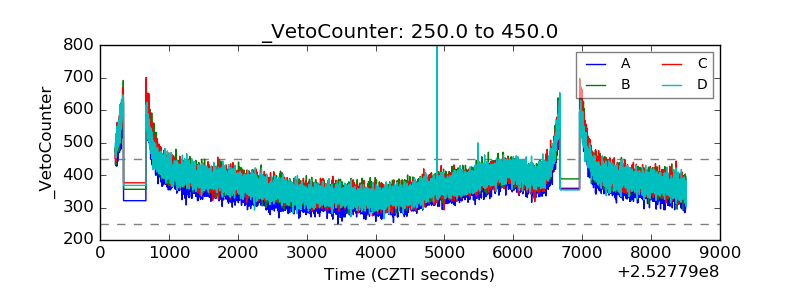 |