| Param | Original file | Final file |
|---|---|---|
| Filename | modeM0/AS1G08_064T01_9000001814_12291cztM0_level2.evt | modeM0/AS1G08_064T01_9000001814_12291cztM0_level2_quad_clean.evt |
| Size (bytes) | 324,411,840 | 45,849,600 |
| Size | 309.4 MB | 43.7 MB |
| Events in quadrant A | 2,217,667 | 276,250 |
| Events in quadrant B | 3,125,329 | 276,051 |
| Events in quadrant C | 1,891,933 | 276,142 |
| Events in quadrant D | 2,304,514 | 264,687 |
| Mode M9 | |||
|---|---|---|---|
| Quadrant | BADHDUFLAG | Total packets | Discarded packets |
| A | 0 | 5 | 0 |
| B | 0 | 5 | 0 |
| C | 0 | 5 | 0 |
| D | 0 | 6 | 0 |
| Mode SS | |||
|---|---|---|---|
| Quadrant | BADHDUFLAG | Total packets | Discarded packets |
| A | 0 | 84 | 0 |
| B | 0 | 84 | 0 |
| C | 0 | 84 | 0 |
| D | 0 | 84 | 0 |
| Mode M0 | |||
|---|---|---|---|
| Quadrant | BADHDUFLAG | Total packets | Discarded packets |
| A | 0 | 9321 | 1 |
| B | 0 | 11968 | 1 |
| C | 0 | 8494 | 1 |
| D | 0 | 9708 | 1 |
| Quadrant | Total seconds | Saturated seconds | Saturation percentage |
|---|---|---|---|
| A | 4182 | 27 | 0.645624% |
| B | 4182 | 458 | 10.951698% |
| C | 4182 | 8 | 0.191296% |
| D | 4182 | 90 | 2.152080% |
Noise dominated data is calculated using 1-second bins in cleaned event files. If a bin has >2000 counts, and if more than 50% of those come from <1% of pixels, then it is considered to be noise-dominated and hence unusable.
| Quadrant | # 1 sec bins | Bins with >0 counts | Bins with >2000 counts | High rate bins dominated by noise | Noise dominated (total time) | Noise dominated (detector-on time) | Marked lightcurve |
|---|---|---|---|---|---|---|---|
| A | 4183 | 4183 | 4 | 4 | 0.10% | 0.10% | 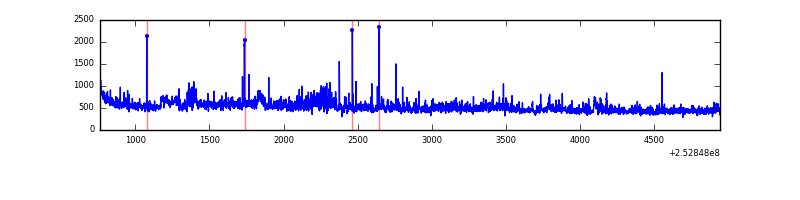 |
| B | 4183 | 4183 | 335 | 335 | 8.01% | 8.01% | 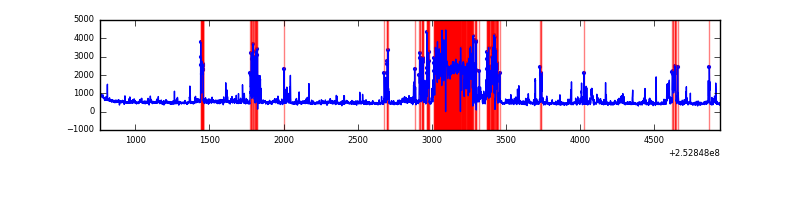 |
| C | 4183 | 4183 | 0 | 0 | 0.00% | 0.00% | 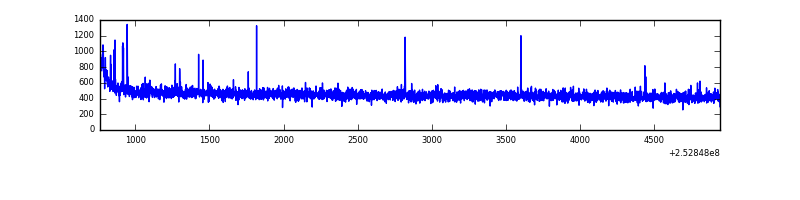 |
| D | 4183 | 4183 | 73 | 73 | 1.75% | 1.75% | 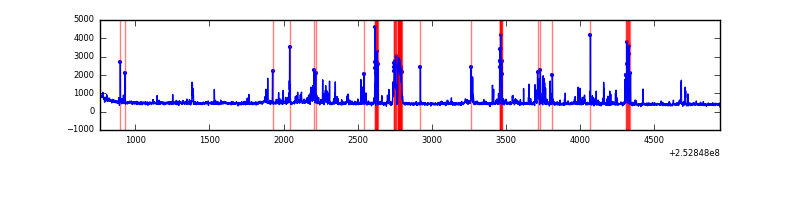 |
Top three noisy pixels from each quadrant. If the there are fewer than three noisy pixels in the level2.evt file, extra rows are filled as -1
| Pixel properties | Quadrant properties | ||||||
|---|---|---|---|---|---|---|---|
| Quadrant | DetID | PixID | Counts | Sigma | Mean | Median | Sigma |
| A | 0 | 23 | 116397 | 1148.59 | 491 | 482 | 100.9 |
| A | 1 | 162 | 65421 | 643.47 | 491 | 482 | 100.9 |
| A | 1 | 178 | 35294 | 344.95 | 491 | 482 | 100.9 |
| B | 4 | 239 | 1018929 | 11668.84 | 455 | 446 | 87.3 |
| B | 0 | 85 | 171928 | 1964.68 | 455 | 446 | 87.3 |
| B | 11 | 51 | 58820 | 668.8 | 455 | 446 | 87.3 |
| C | 15 | 208 | 12720 | 109.16 | 478 | 481 | 112.1 |
| C | 4 | 254 | 8295 | 69.7 | 478 | 481 | 112.1 |
| C | 1 | 16 | 6389 | 52.7 | 478 | 481 | 112.1 |
| D | 1 | 52 | 169024 | 1476.71 | 475 | 462 | 114.1 |
| D | 5 | 222 | 56656 | 492.29 | 475 | 462 | 114.1 |
| D | 10 | 199 | 56526 | 491.16 | 475 | 462 | 114.1 |
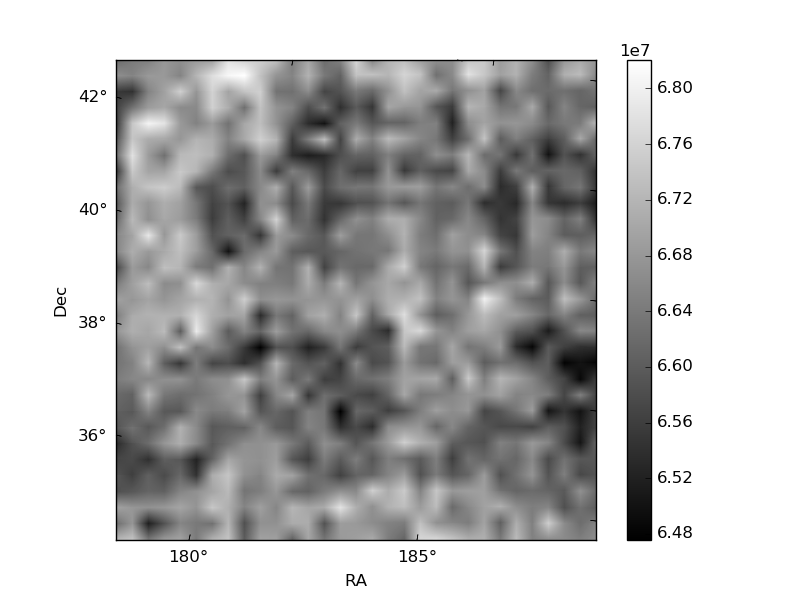
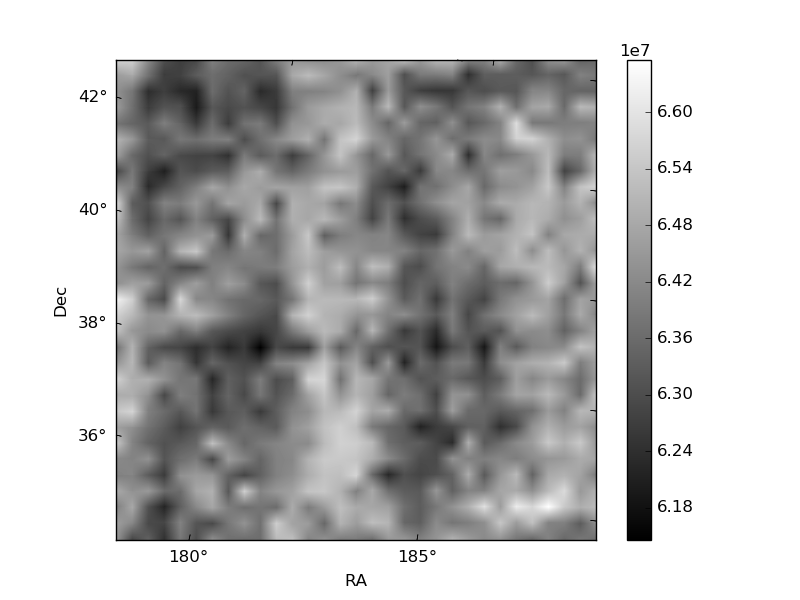
Histogram calculated using DETX and DETY for each event in the final _common_clean file
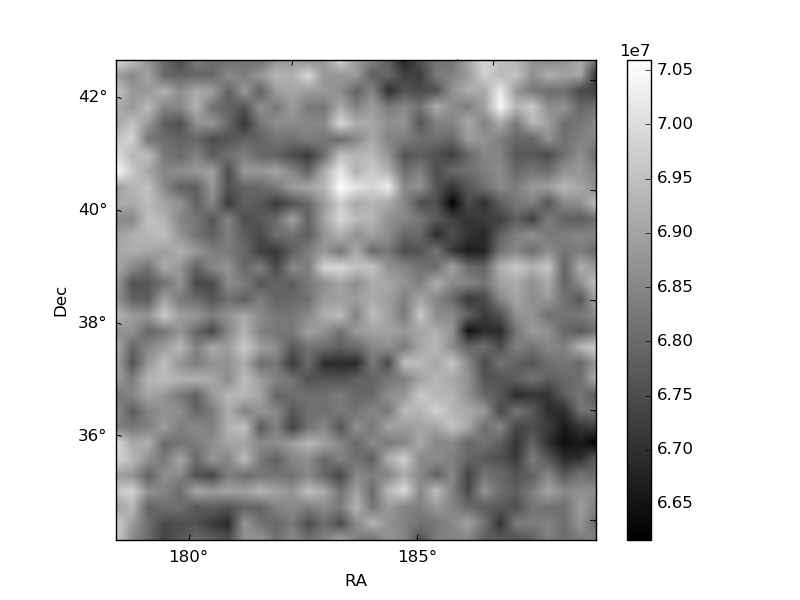
| Quadrant A | 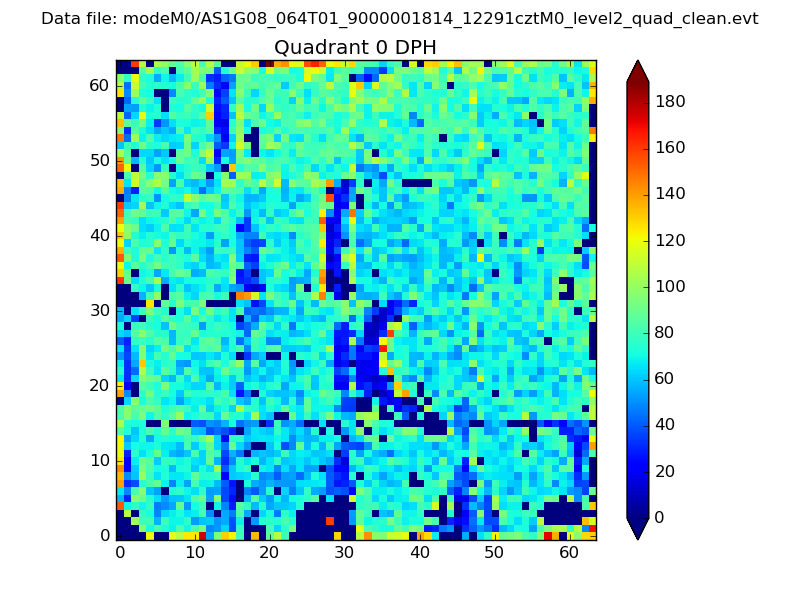 |
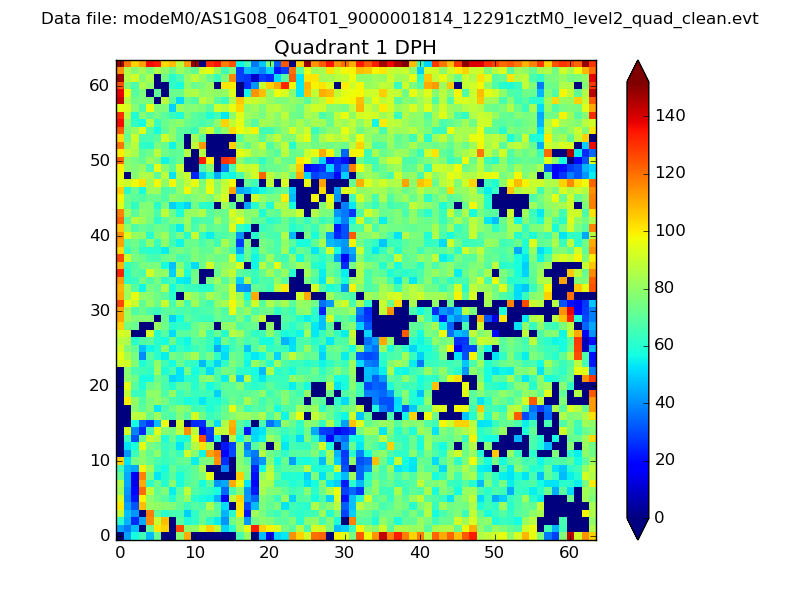 |
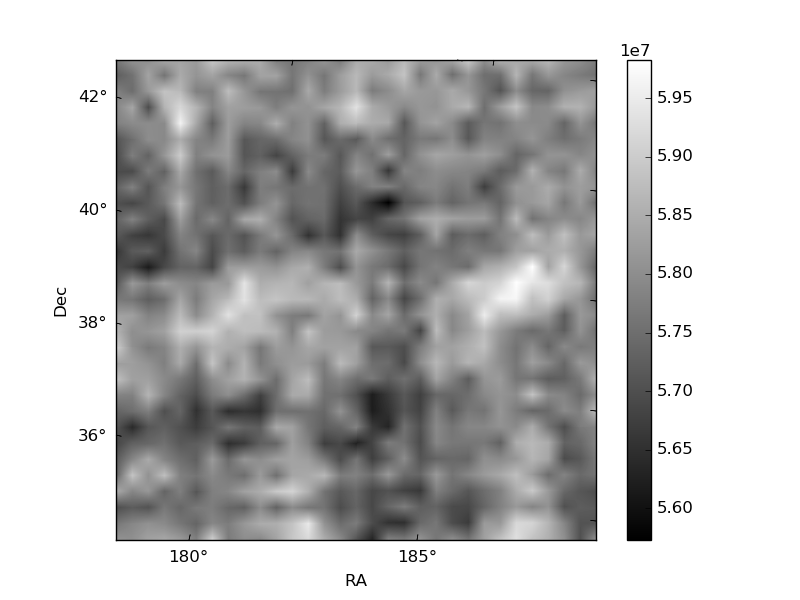
Quadrant B |
|---|---|---|---|
| Quadrant D | 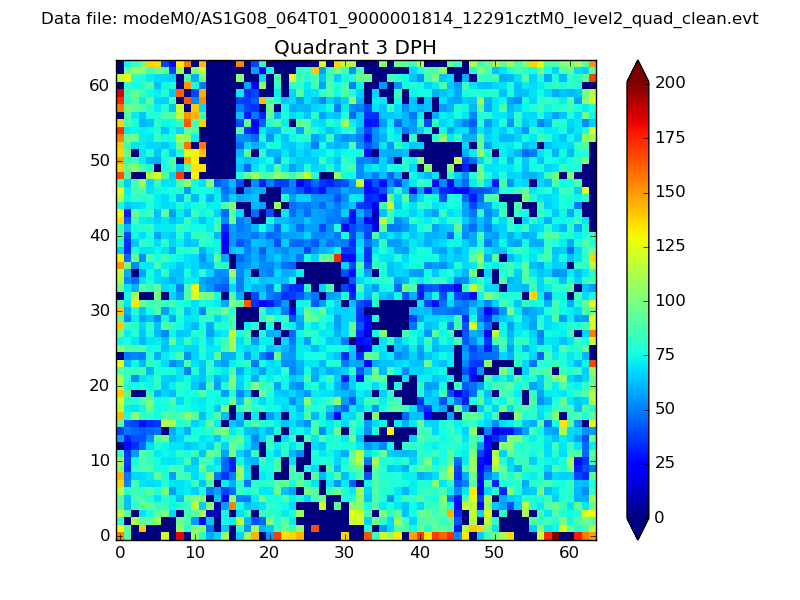 |
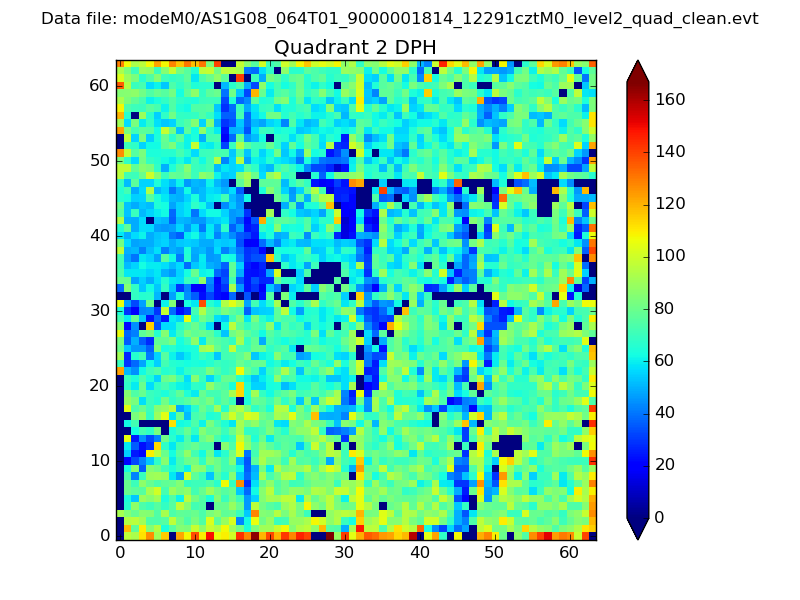 |
Quadrant C |
| Plot type | Count rate plots | Images |
|---|---|---|
| Comparison with Poisson distribution Blue bars denote a histogram of data divided into 1 sec bins. Red curve is a Poisson curve with rate = median count rate of data. |
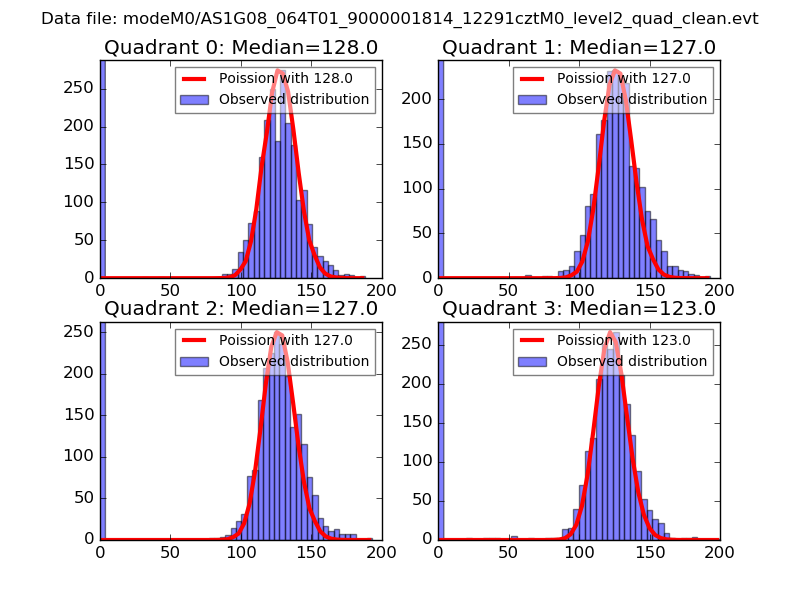 |
 |
| Quadrant-wise count rates Data is divided into 100 sec bins |
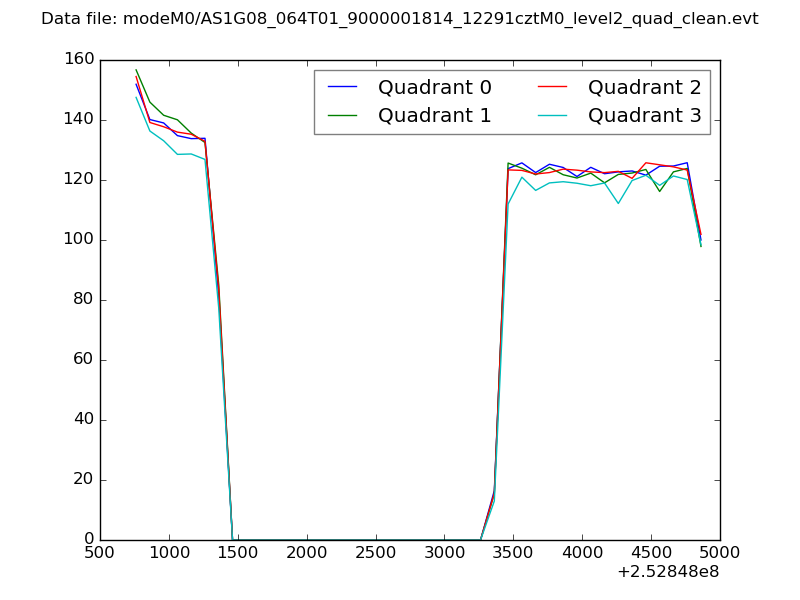 |
|
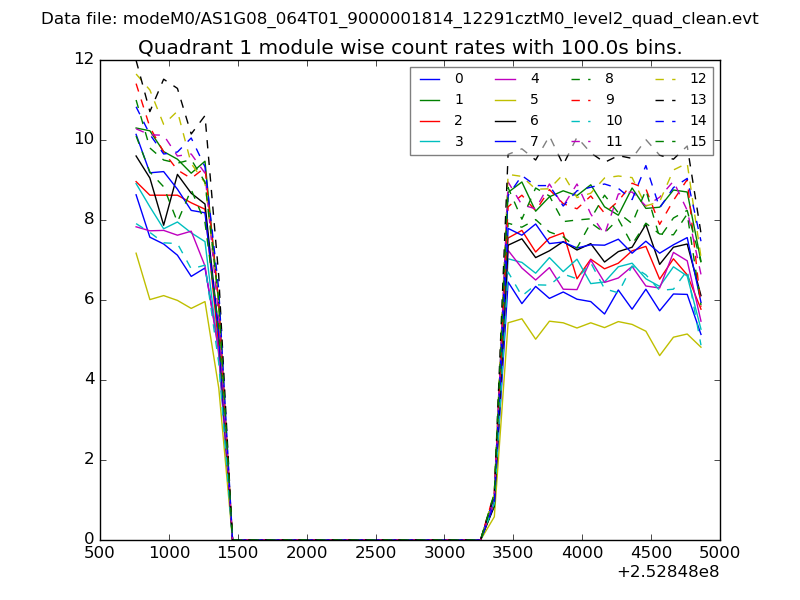
| Module-wise count rates for Quadrant A Data is divided into 100 sec bins |
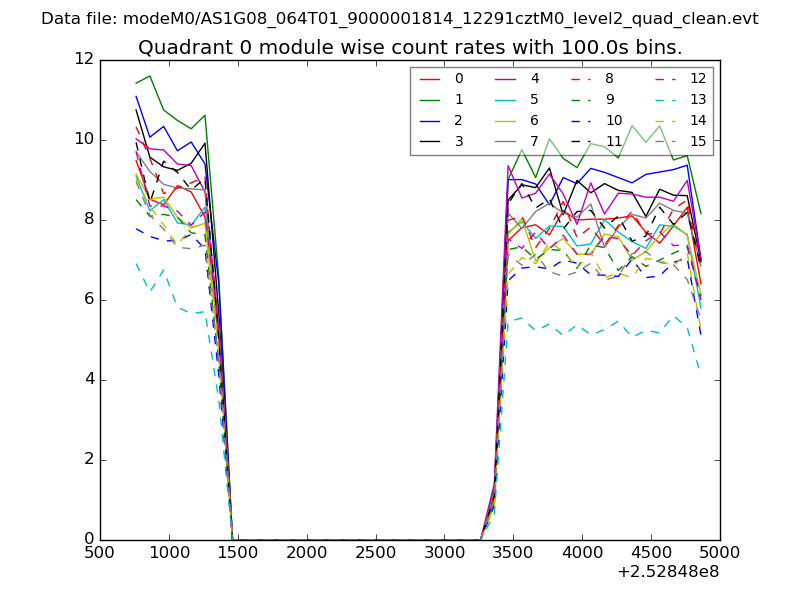 |
 |
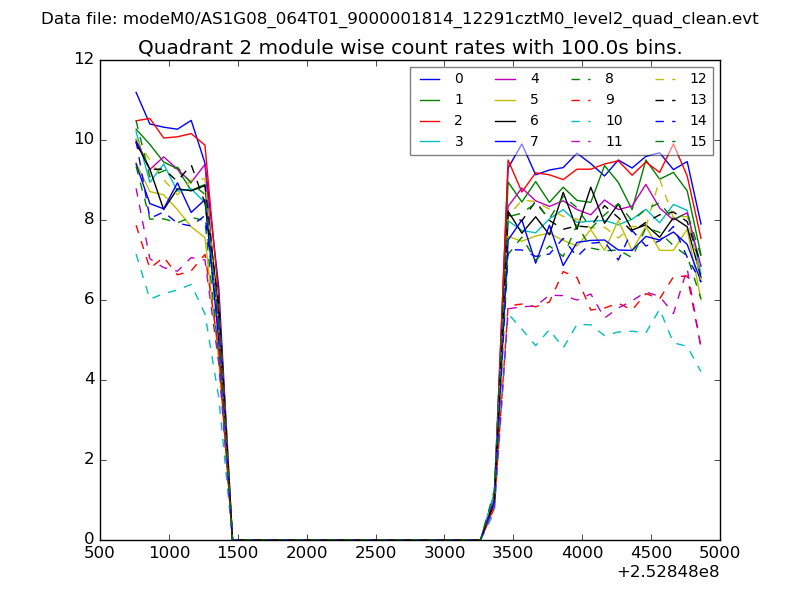
| Module-wise count rates for Quadrant B Data is divided into 100 sec bins |
 |
 |
| Module-wise count rates for Quadrant C Data is divided into 100 sec bins |
 |
 |
| Module-wise count rates for Quadrant D Data is divided into 100 sec bins |
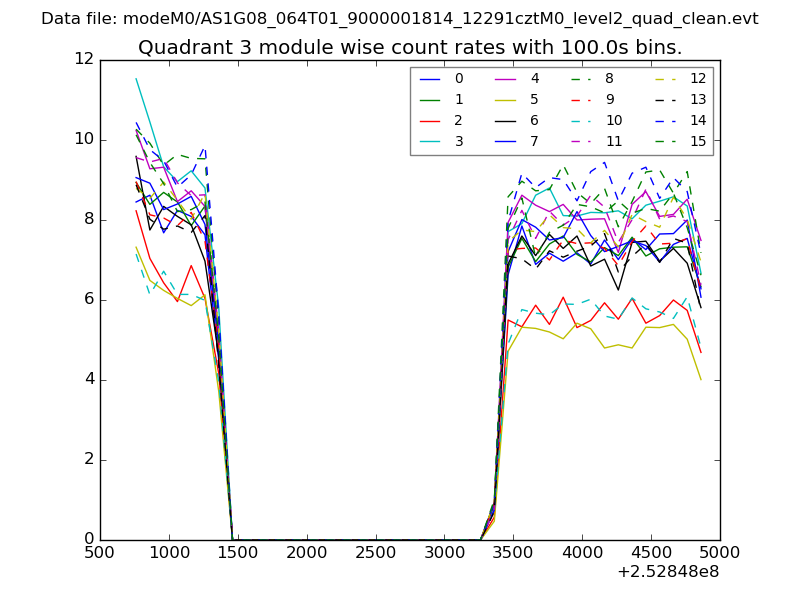 |
 |
| Parameter | Plot |
|---|---|
| CZT HV Monitor | 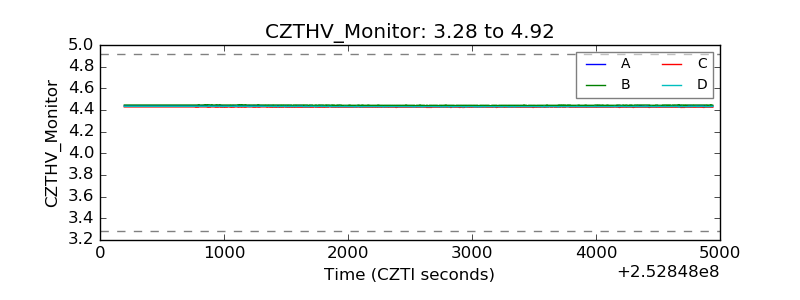 |
| D_VDD | 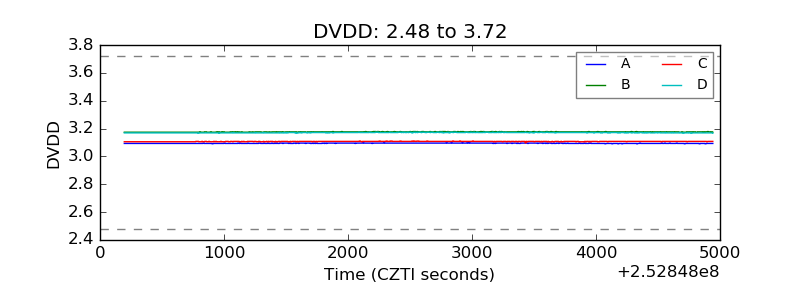 |
| Temperature 1 | 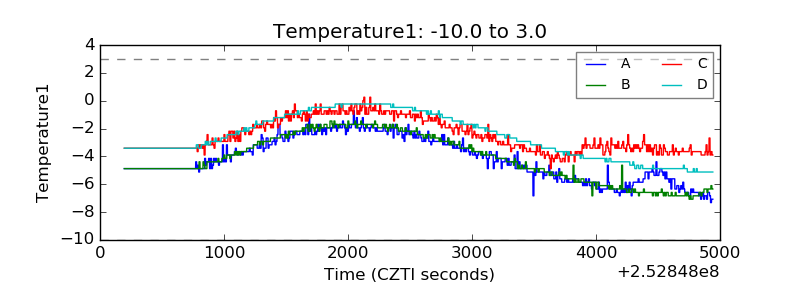 |
| Veto HV Monitor |  |
| Veto LLD | 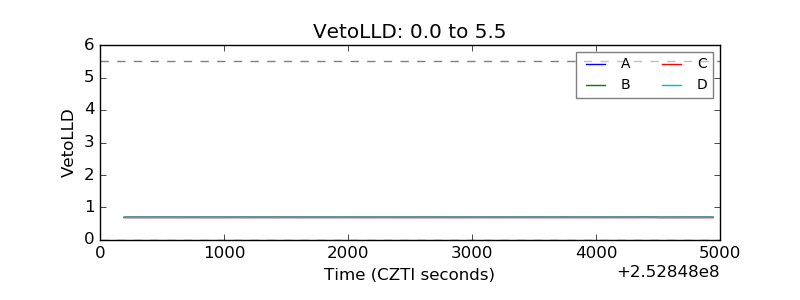 |
| Alpha Counter | 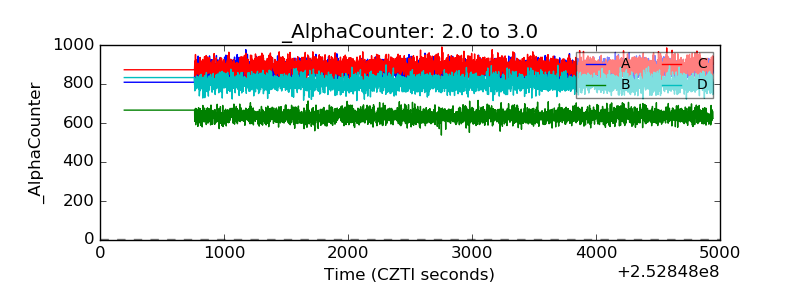 |
| _CPM_Rate |  |
| CZT Counter | 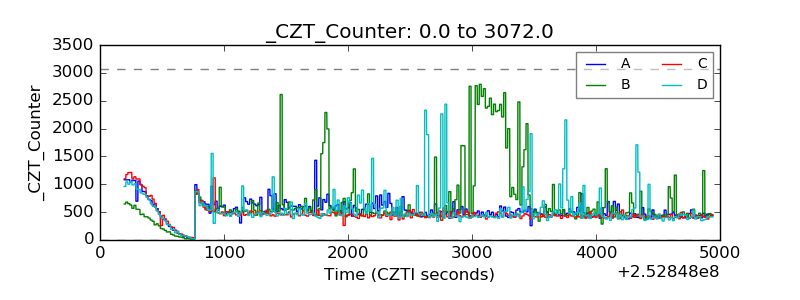 |
| +2.5 Volts monitor |  |
| +5 Volts monitor |  |
| _ROLL_ROT | 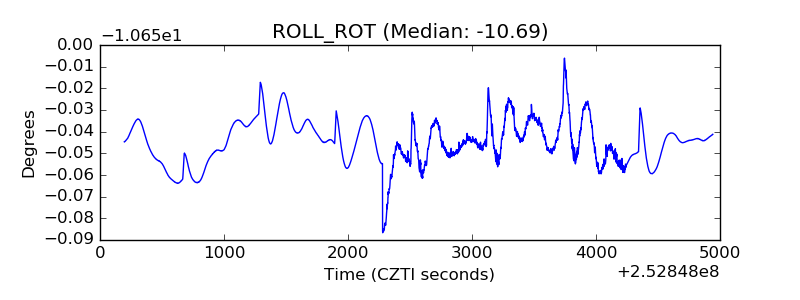 |
| _Roll_DEC | 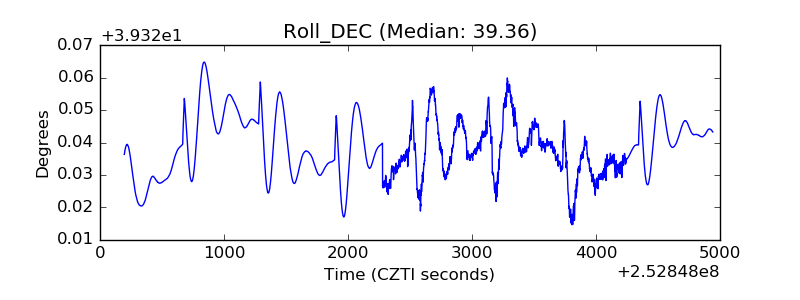 |
| _Roll_RA |  |
| Veto Counter | 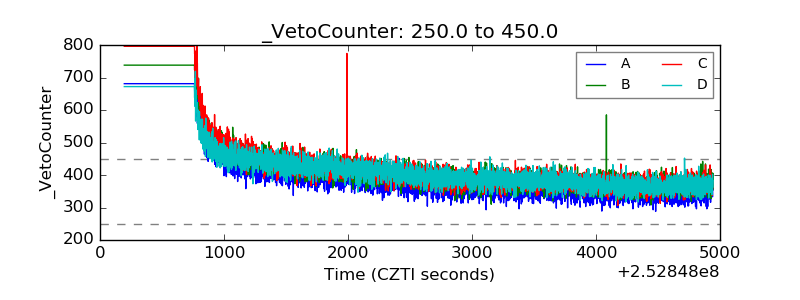 |