| Param | Original file | Final file |
|---|---|---|
| Filename | modeM0/AS1A04_183T02_9000001816_12291cztM0_level2.evt | modeM0/AS1A04_183T02_9000001816_12291cztM0_level2_quad_clean.evt |
| Size (bytes) | 111,470,400 | 17,982,720 |
| Size | 106.3 MB | 17.1 MB |
| Events in quadrant A | 794,117 | 108,582 |
| Events in quadrant B | 995,176 | 106,483 |
| Events in quadrant C | 725,085 | 113,009 |
| Events in quadrant D | 759,488 | 107,472 |
| Mode SS | |||
|---|---|---|---|
| Quadrant | BADHDUFLAG | Total packets | Discarded packets |
| A | 0 | 30 | 0 |
| B | 0 | 30 | 0 |
| C | 0 | 30 | 0 |
| D | 0 | 30 | 0 |
| Mode M9 | |||
|---|---|---|---|
| Quadrant | BADHDUFLAG | Total packets | Discarded packets |
| A | 0 | 6 | 0 |
| B | 0 | 6 | 0 |
| C | 0 | 6 | 0 |
| D | 0 | 6 | 0 |
| Mode M0 | |||
|---|---|---|---|
| Quadrant | BADHDUFLAG | Total packets | Discarded packets |
| A | 0 | 3193 | 2 |
| B | 0 | 3842 | 1 |
| C | 0 | 3068 | 1 |
| D | 0 | 3182 | 1 |
| Quadrant | Total seconds | Saturated seconds | Saturation percentage |
|---|---|---|---|
| A | 1456 | 32 | 2.197802% |
| B | 1456 | 133 | 9.134615% |
| C | 1456 | 15 | 1.030220% |
| D | 1456 | 26 | 1.785714% |
Noise dominated data is calculated using 1-second bins in cleaned event files. If a bin has >2000 counts, and if more than 50% of those come from <1% of pixels, then it is considered to be noise-dominated and hence unusable.
| Quadrant | # 1 sec bins | Bins with >0 counts | Bins with >2000 counts | High rate bins dominated by noise | Noise dominated (total time) | Noise dominated (detector-on time) | Marked lightcurve |
|---|---|---|---|---|---|---|---|
| A | 1457 | 1457 | 0 | 0 | 0.00% | 0.00% | 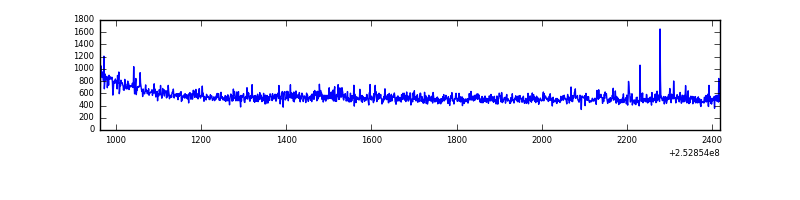 |
| B | 1457 | 1457 | 52 | 52 | 3.57% | 3.57% | 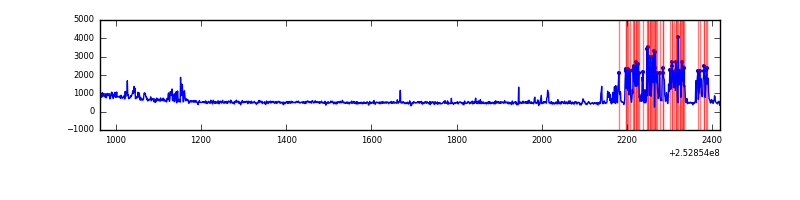 |
| C | 1457 | 1457 | 0 | 0 | 0.00% | 0.00% | 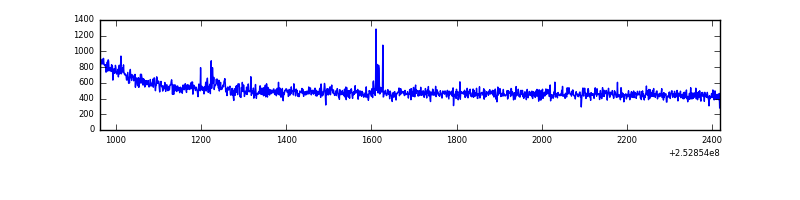 |
| D | 1457 | 1457 | 11 | 11 | 0.75% | 0.75% | 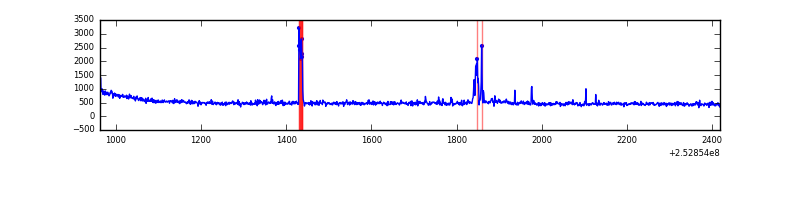 |
Top three noisy pixels from each quadrant. If the there are fewer than three noisy pixels in the level2.evt file, extra rows are filled as -1
| Pixel properties | Quadrant properties | ||||||
|---|---|---|---|---|---|---|---|
| Quadrant | DetID | PixID | Counts | Sigma | Mean | Median | Sigma |
| A | 1 | 162 | 19913 | 480.8 | 190 | 185 | 41.0 |
| A | 1 | 178 | 10247 | 245.23 | 190 | 185 | 41.0 |
| A | 1 | 161 | 8775 | 209.35 | 190 | 185 | 41.0 |
| B | 4 | 239 | 138642 | 3676.05 | 184 | 179 | 37.7 |
| B | 0 | 85 | 125199 | 3319.15 | 184 | 179 | 37.7 |
| B | 0 | 205 | 4782 | 122.19 | 184 | 179 | 37.7 |
| C | 15 | 208 | 8961 | 195.48 | 183 | 184 | 44.9 |
| C | 13 | 61 | 1408 | 27.26 | 183 | 184 | 44.9 |
| C | 4 | 254 | 1088 | 20.13 | 183 | 184 | 44.9 |
| D | 9 | 85 | 24070 | 520.92 | 182 | 176 | 45.9 |
| D | 13 | 112 | 21757 | 470.5 | 182 | 176 | 45.9 |
| D | 10 | 50 | 11911 | 255.84 | 182 | 176 | 45.9 |
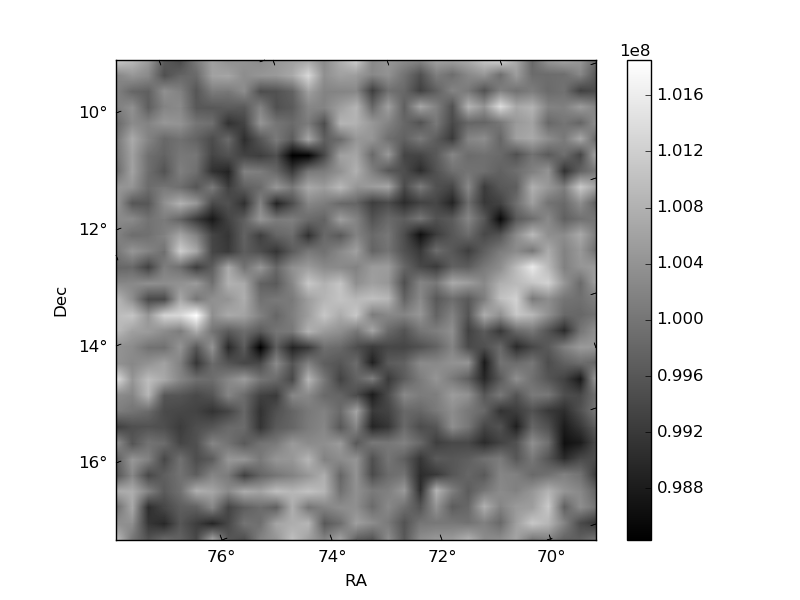
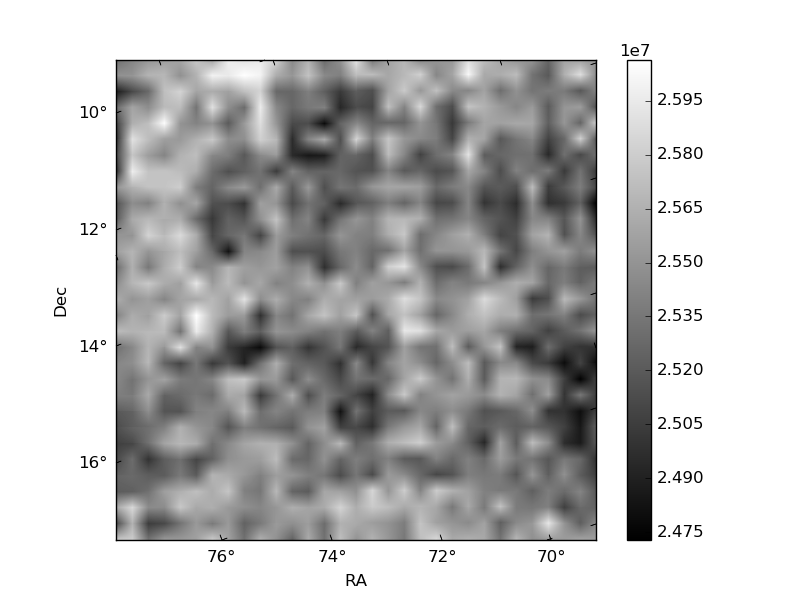
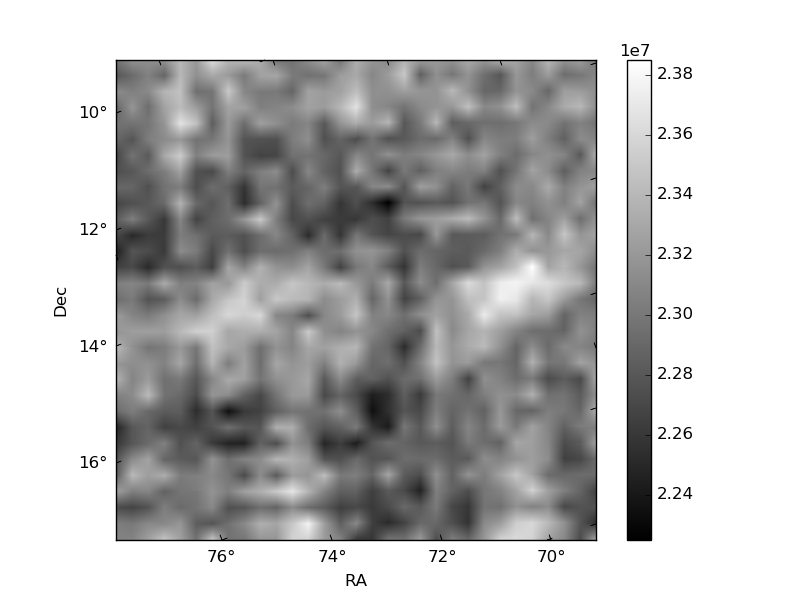
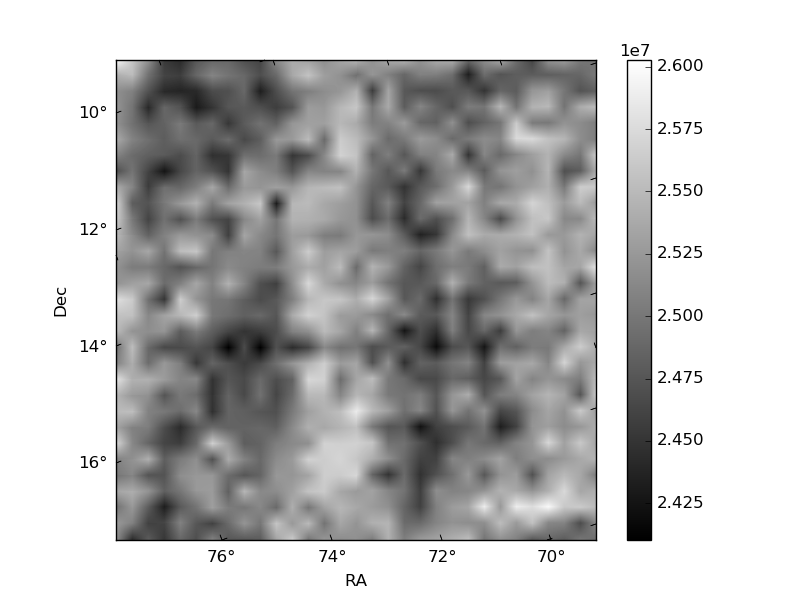
Histogram calculated using DETX and DETY for each event in the final _common_clean file
| Quadrant A | 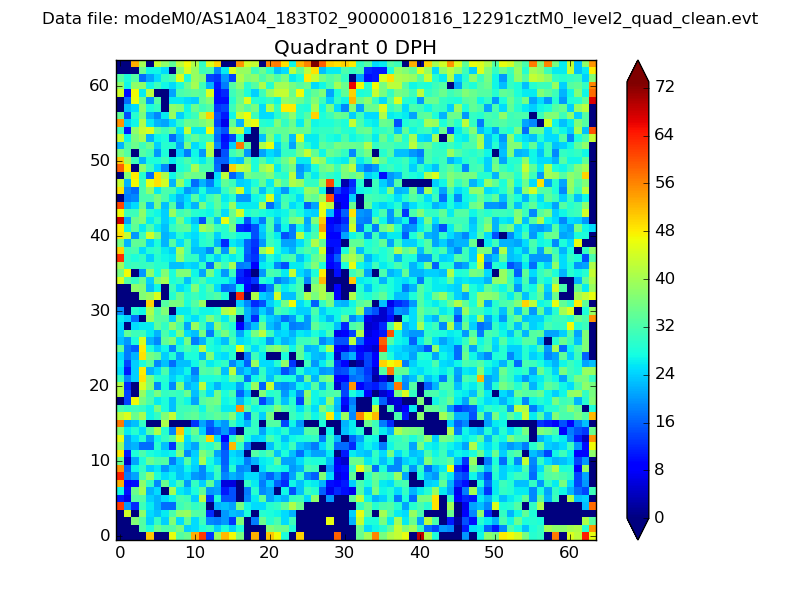 |
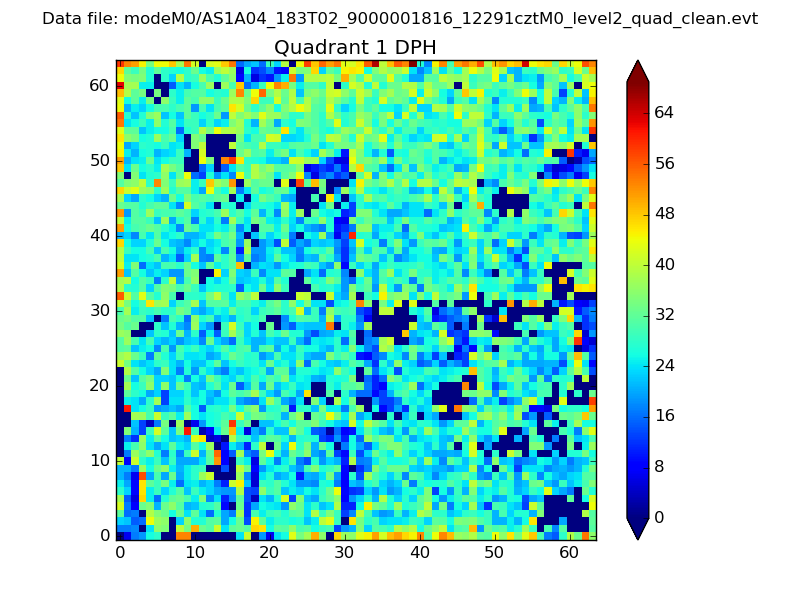 |
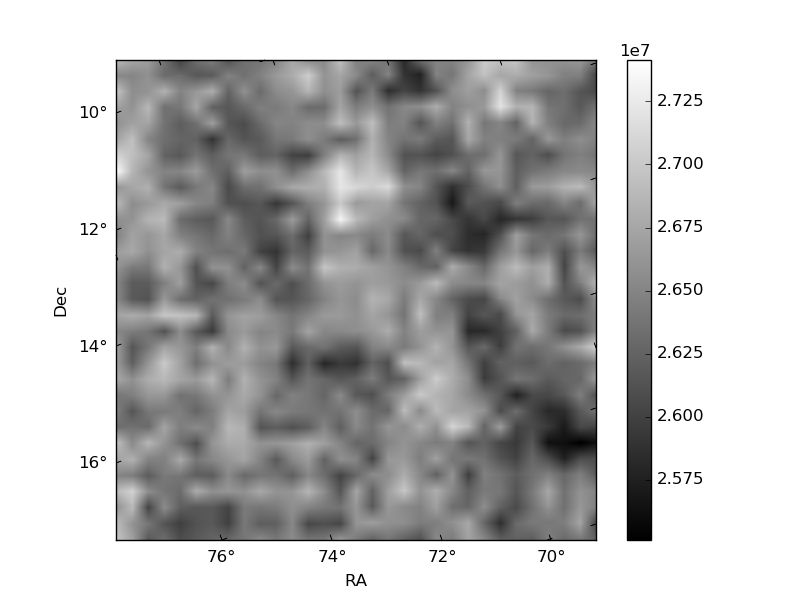
Quadrant B |
|---|---|---|---|
| Quadrant D | 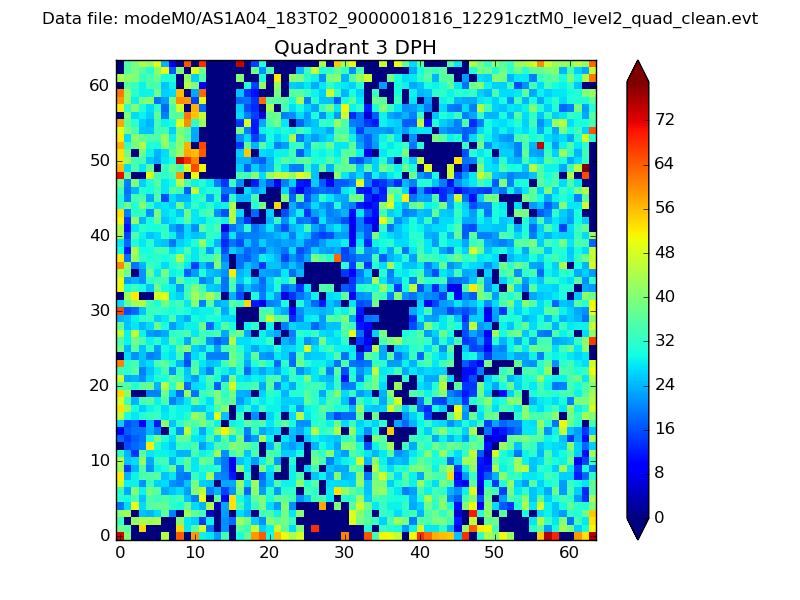 |
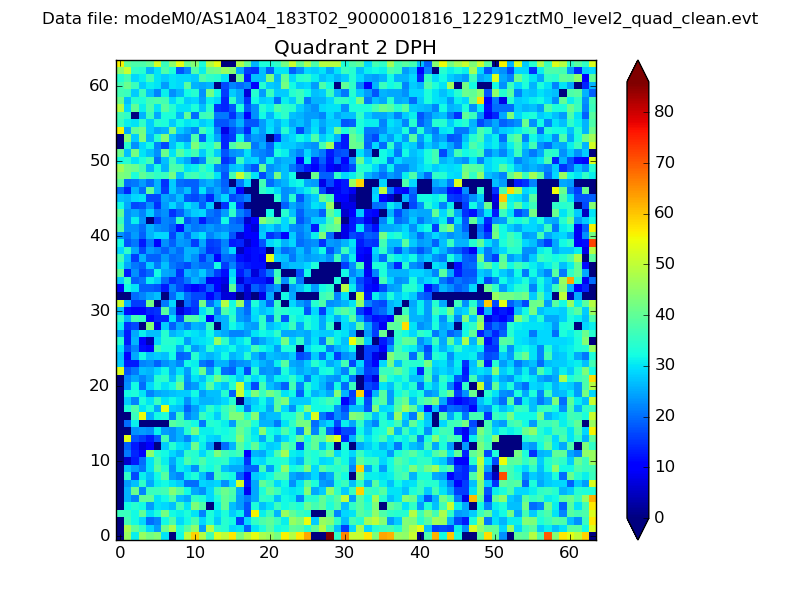 |
Quadrant C |
| Plot type | Count rate plots | Images |
|---|---|---|
| Comparison with Poisson distribution Blue bars denote a histogram of data divided into 1 sec bins. Red curve is a Poisson curve with rate = median count rate of data. |
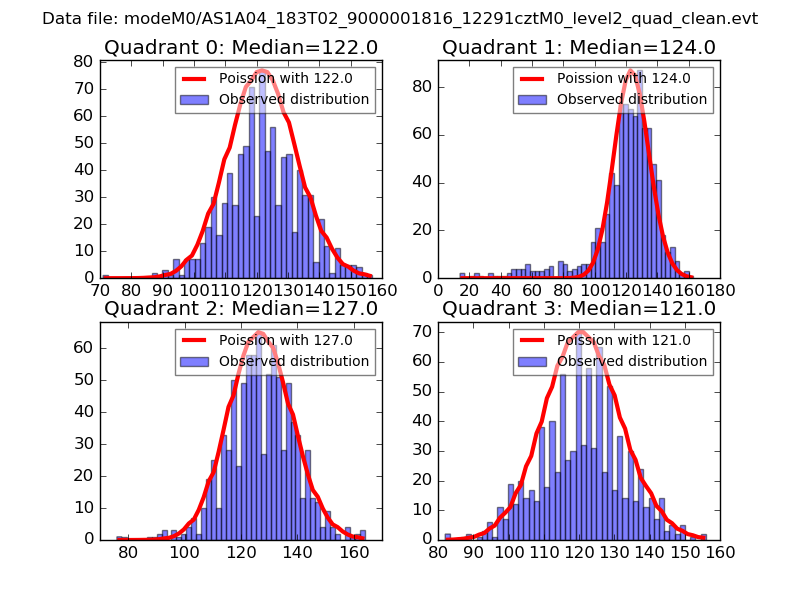 |
 |
| Quadrant-wise count rates Data is divided into 100 sec bins |
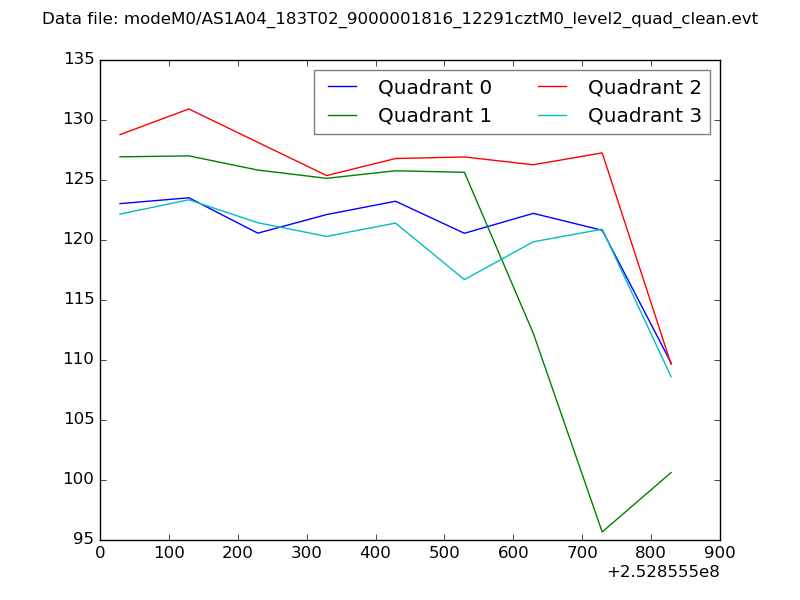 |
|
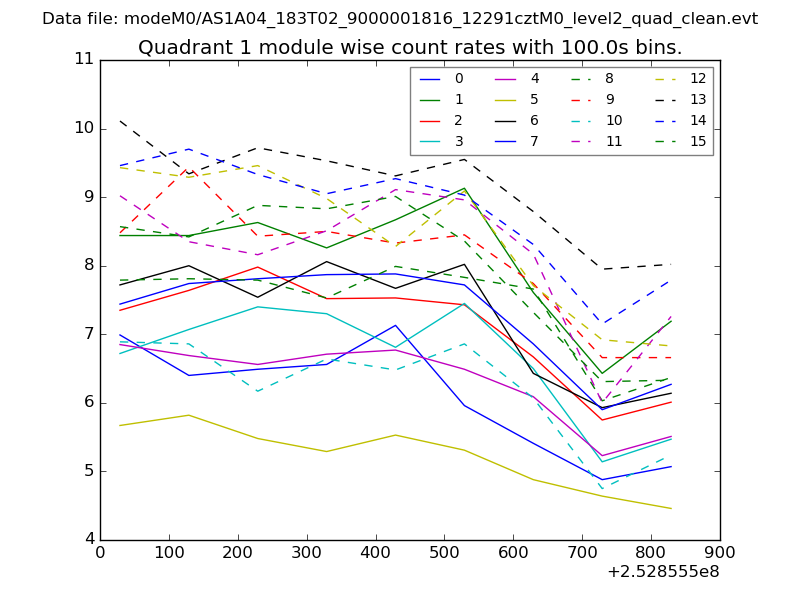
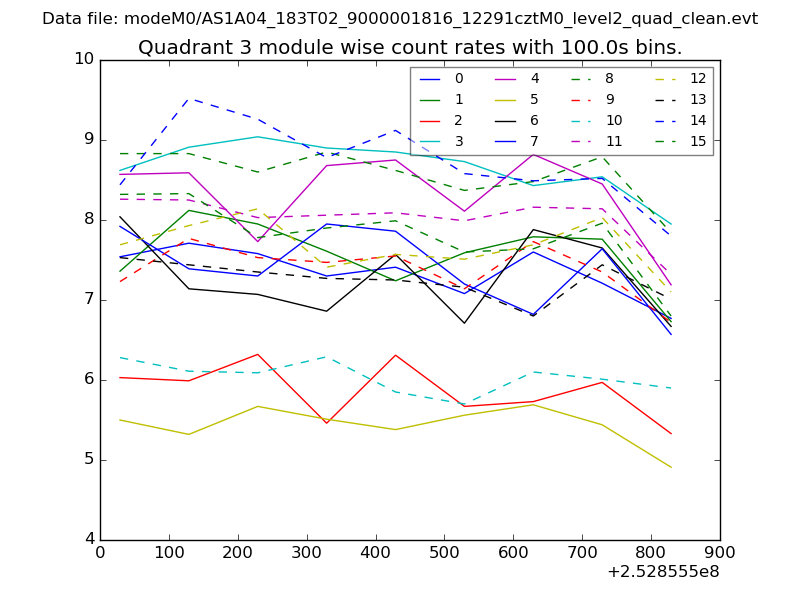
| Module-wise count rates for Quadrant A Data is divided into 100 sec bins |
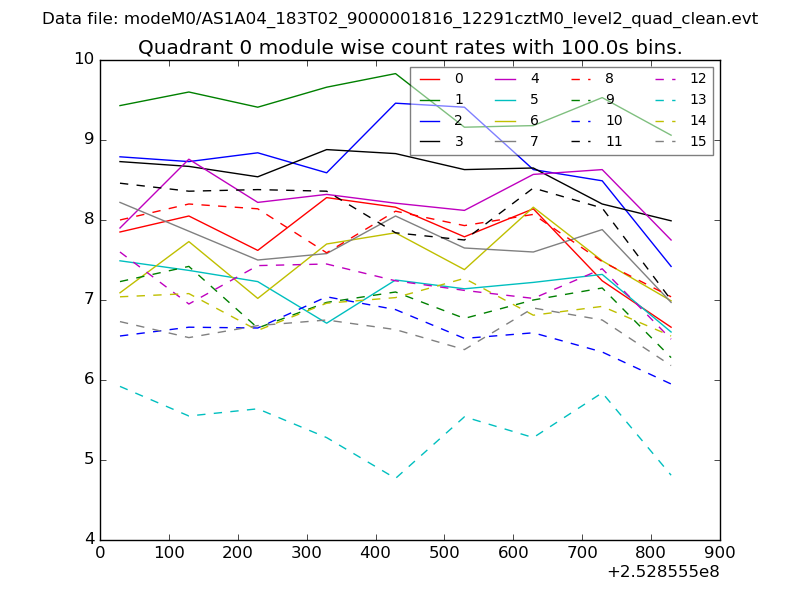 |
 |
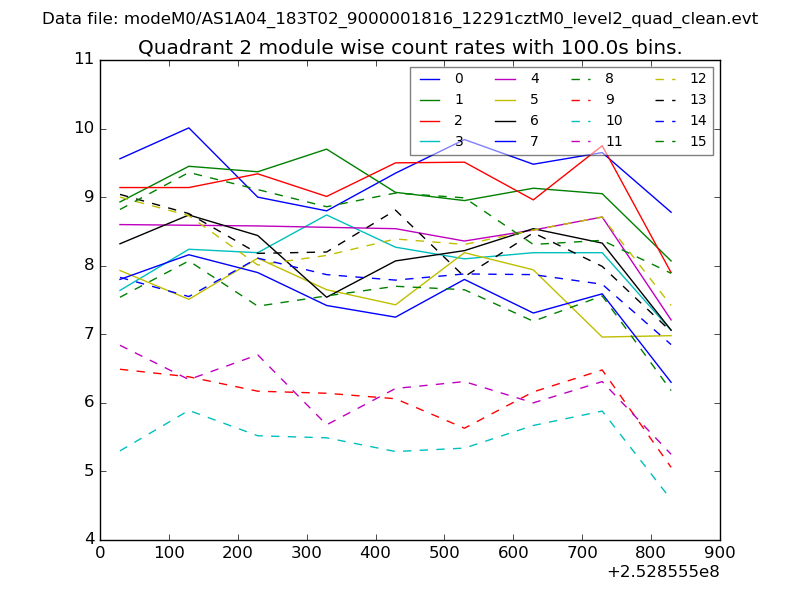
| Module-wise count rates for Quadrant B Data is divided into 100 sec bins |
 |
 |
| Module-wise count rates for Quadrant C Data is divided into 100 sec bins |
 |
 |
| Module-wise count rates for Quadrant D Data is divided into 100 sec bins |
 |
 |
| Parameter | Plot |
|---|---|
| CZT HV Monitor |  |
| D_VDD | 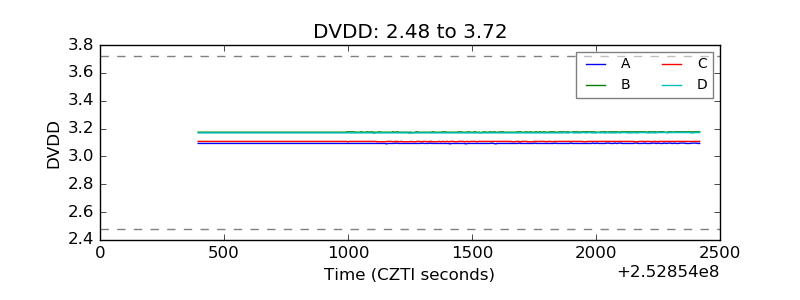 |
| Temperature 1 | 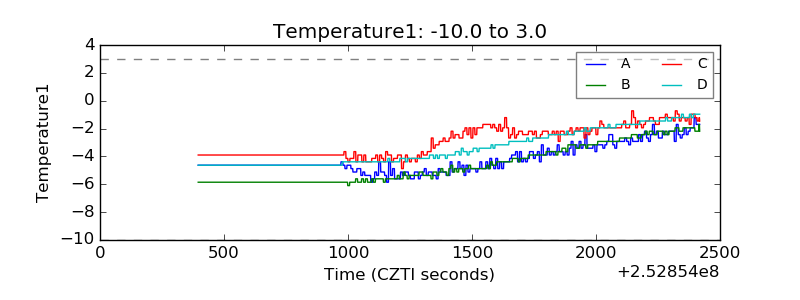 |
| Veto HV Monitor | 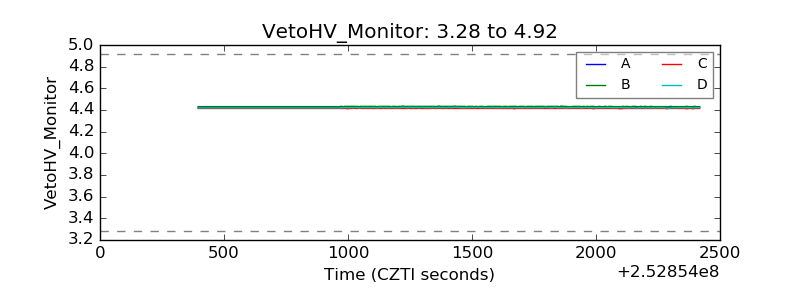 |
| Veto LLD |  |
| Alpha Counter | 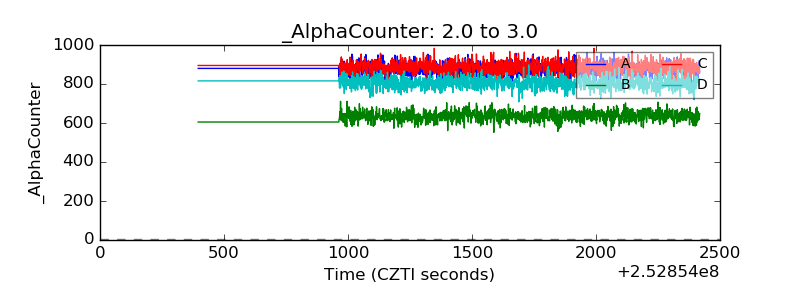 |
| _CPM_Rate | 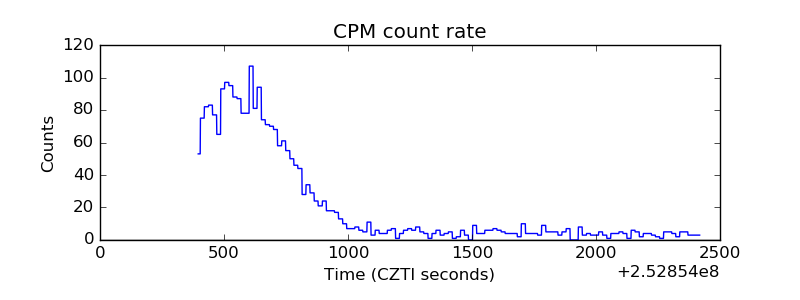 |
| CZT Counter | 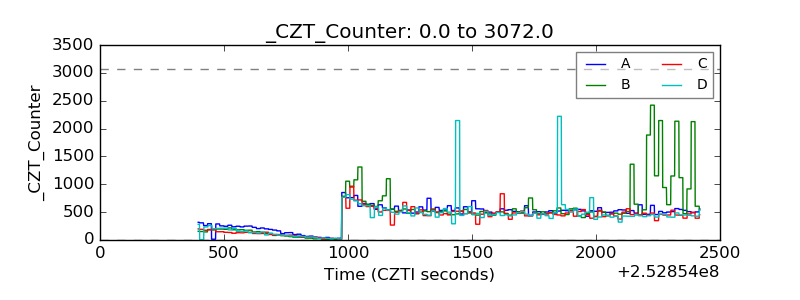 |
| +2.5 Volts monitor |  |
| +5 Volts monitor |  |
| _ROLL_ROT |  |
| _Roll_DEC |  |
| _Roll_RA | 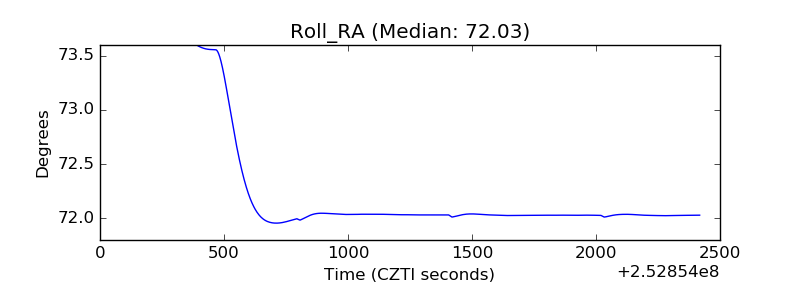 |
| Veto Counter | 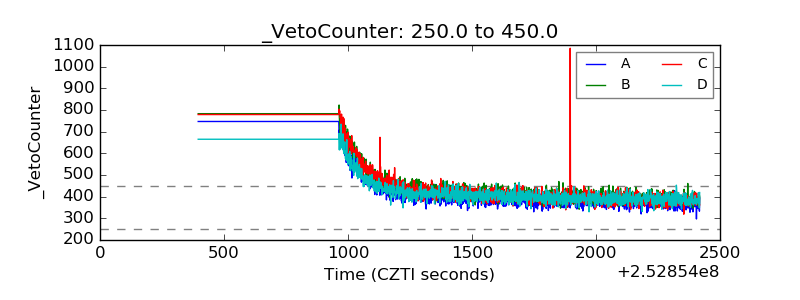 |