| Param | Original file | Final file |
|---|---|---|
| Filename | modeM0/AS1A04_183T02_9000001816_12293cztM0_level2.evt | modeM0/AS1A04_183T02_9000001816_12293cztM0_level2_quad_clean.evt |
| Size (bytes) | 1,234,529,280 | 156,864,960 |
| Size | 1.1 GB | 149.6 MB |
| Events in quadrant A | 7,132,204 | 1,026,016 |
| Events in quadrant B | 9,785,901 | 941,103 |
| Events in quadrant C | 6,016,926 | 1,047,193 |
| Events in quadrant D | 13,591,158 | 853,284 |
| Mode SS | |||
|---|---|---|---|
| Quadrant | BADHDUFLAG | Total packets | Discarded packets |
| A | 0 | 260 | 0 |
| B | 0 | 260 | 0 |
| C | 0 | 260 | 0 |
| D | 0 | 260 | 0 |
| Mode M9 | |||
|---|---|---|---|
| Quadrant | BADHDUFLAG | Total packets | Discarded packets |
| A | 0 | 4 | 0 |
| B | 0 | 4 | 0 |
| C | 0 | 4 | 0 |
| D | 0 | 4 | 0 |
| Mode M0 | |||
|---|---|---|---|
| Quadrant | BADHDUFLAG | Total packets | Discarded packets |
| A | 0 | 29222 | 4 |
| B | 0 | 37340 | 3 |
| C | 0 | 26838 | 3 |
| D | 0 | 49114 | 3 |
| Quadrant | Total seconds | Saturated seconds | Saturation percentage |
|---|---|---|---|
| A | 12751 | 473 | 3.709513% |
| B | 12751 | 1723 | 13.512666% |
| C | 12751 | 220 | 1.725355% |
| D | 12751 | 3270 | 25.645047% |
Noise dominated data is calculated using 1-second bins in cleaned event files. If a bin has >2000 counts, and if more than 50% of those come from <1% of pixels, then it is considered to be noise-dominated and hence unusable.
| Quadrant | # 1 sec bins | Bins with >0 counts | Bins with >2000 counts | High rate bins dominated by noise | Noise dominated (total time) | Noise dominated (detector-on time) | Marked lightcurve |
|---|---|---|---|---|---|---|---|
| A | 13202 | 12756 | 68 | 68 | 0.52% | 0.53% | 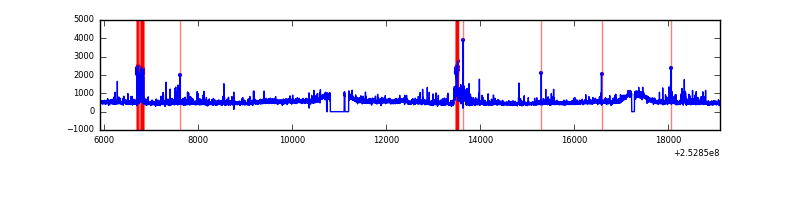 |
| B | 13202 | 12756 | 869 | 869 | 6.58% | 6.81% | 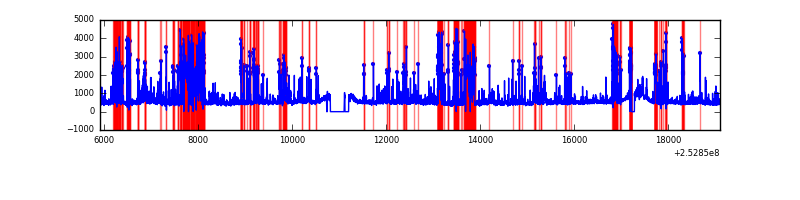 |
| C | 13202 | 12756 | 13 | 13 | 0.10% | 0.10% | 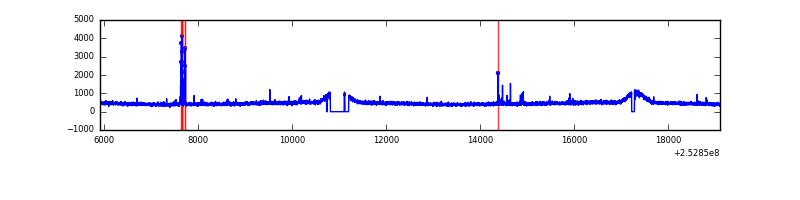 |
| D | 13201 | 12754 | 2309 | 2309 | 17.49% | 18.10% | 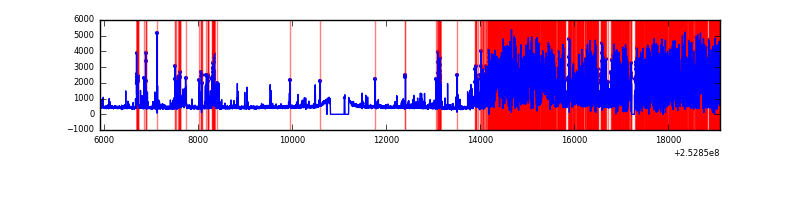 |
Top three noisy pixels from each quadrant. If the there are fewer than three noisy pixels in the level2.evt file, extra rows are filled as -1
| Pixel properties | Quadrant properties | ||||||
|---|---|---|---|---|---|---|---|
| Quadrant | DetID | PixID | Counts | Sigma | Mean | Median | Sigma |
| A | 0 | 23 | 473054 | 1488.04 | 1546 | 1510 | 316.9 |
| A | 1 | 162 | 236287 | 740.88 | 1546 | 1510 | 316.9 |
| A | 1 | 178 | 124660 | 388.62 | 1546 | 1510 | 316.9 |
| B | 4 | 239 | 2752641 | 9924.25 | 1445 | 1409 | 277.2 |
| B | 3 | 64 | 670485 | 2413.49 | 1445 | 1409 | 277.2 |
| B | 0 | 85 | 295930 | 1062.4 | 1445 | 1409 | 277.2 |
| C | 15 | 208 | 116295 | 323.29 | 1510 | 1520 | 355.0 |
| C | 13 | 61 | 11003 | 26.71 | 1510 | 1520 | 355.0 |
| C | 4 | 254 | 6110 | 12.93 | 1510 | 1520 | 355.0 |
| D | 1 | 52 | 7908560 | 25123.43 | 1301 | 1266 | 314.7 |
| D | 10 | 199 | 328476 | 1039.63 | 1301 | 1266 | 314.7 |
| D | 7 | 71 | 82985 | 259.64 | 1301 | 1266 | 314.7 |
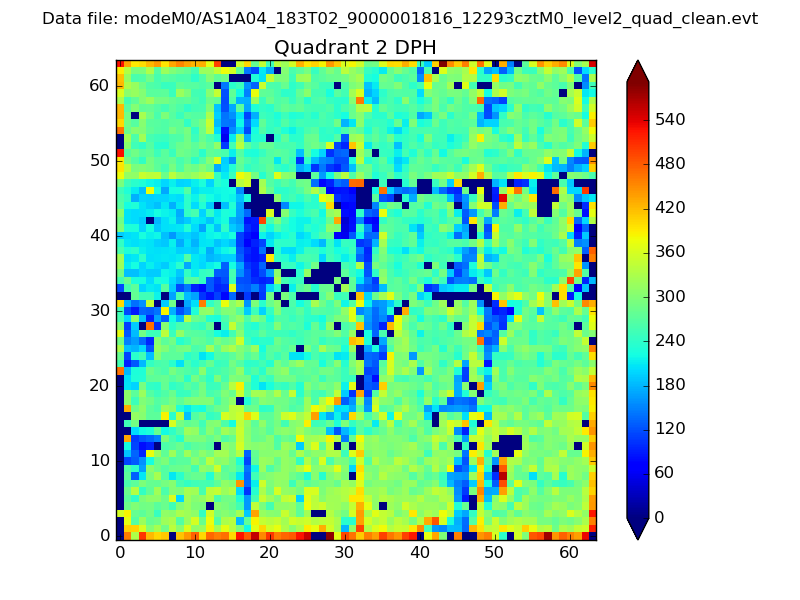
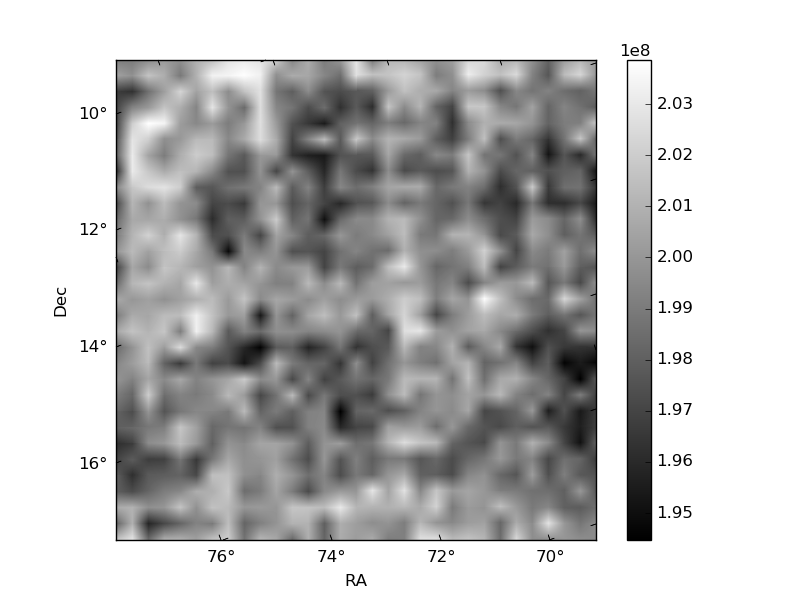
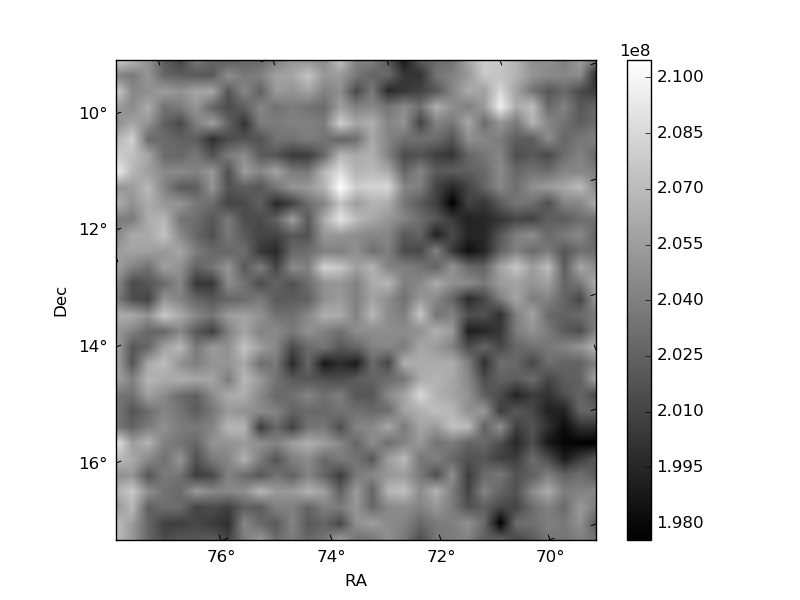
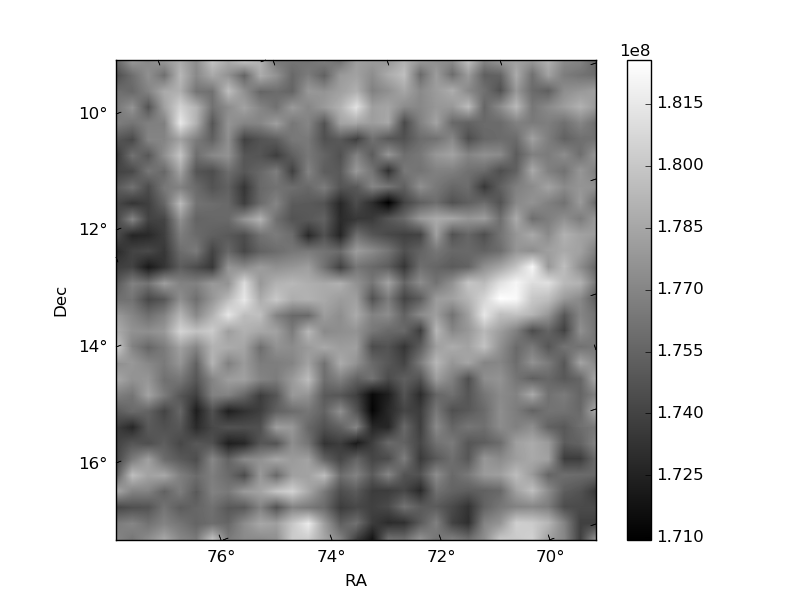
Histogram calculated using DETX and DETY for each event in the final _common_clean file
| Quadrant A | 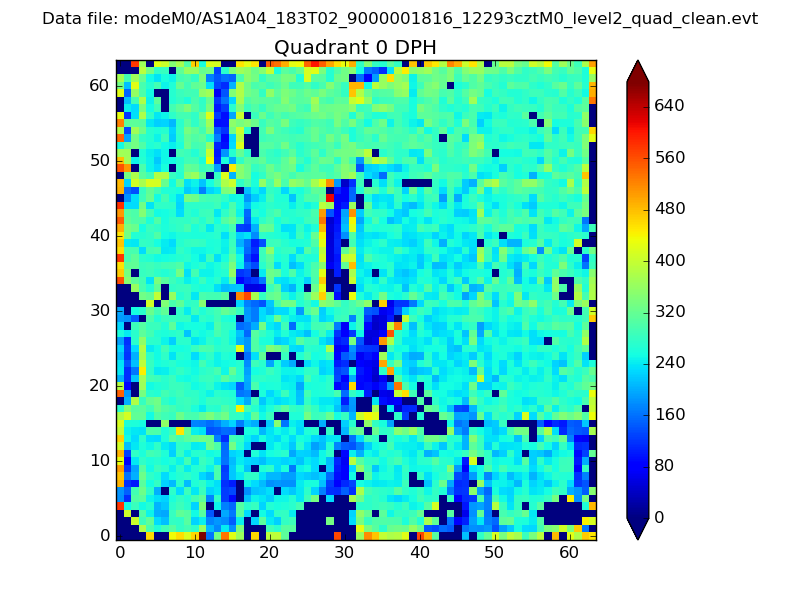 |
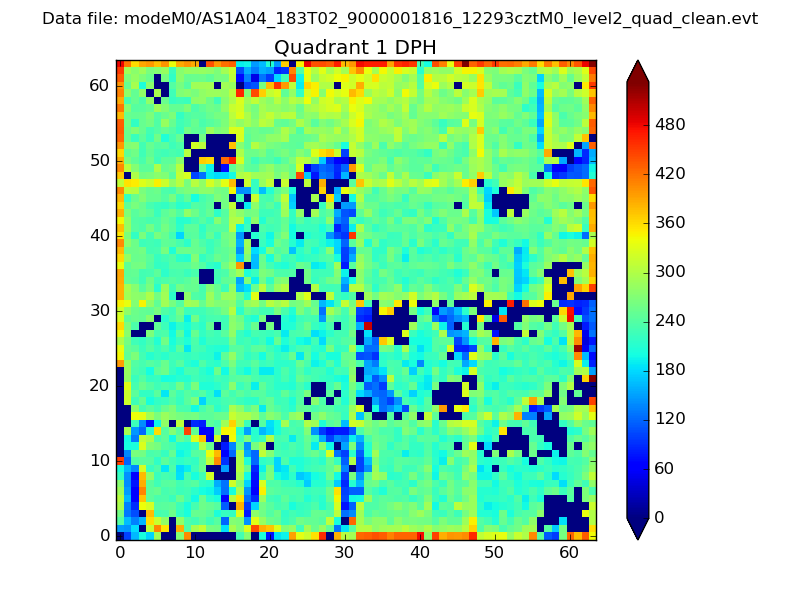 |
Quadrant B |
|---|---|---|---|
| Quadrant D | 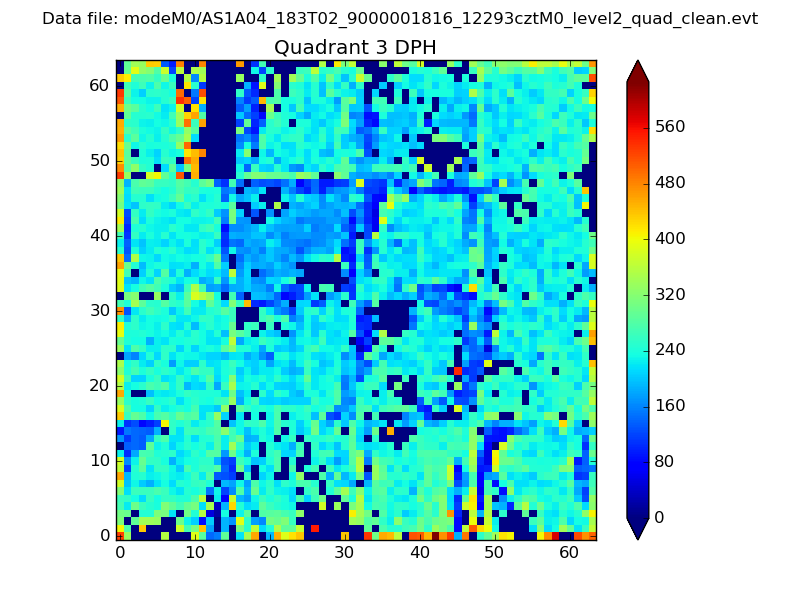 |
 |
Quadrant C |
| Plot type | Count rate plots | Images |
|---|---|---|
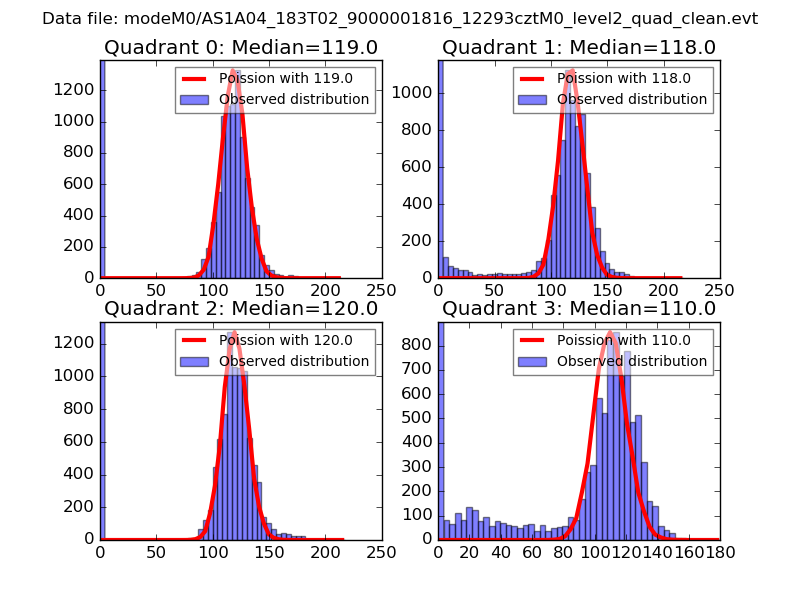
| Comparison with Poisson distribution Blue bars denote a histogram of data divided into 1 sec bins. Red curve is a Poisson curve with rate = median count rate of data. |
 |
 |
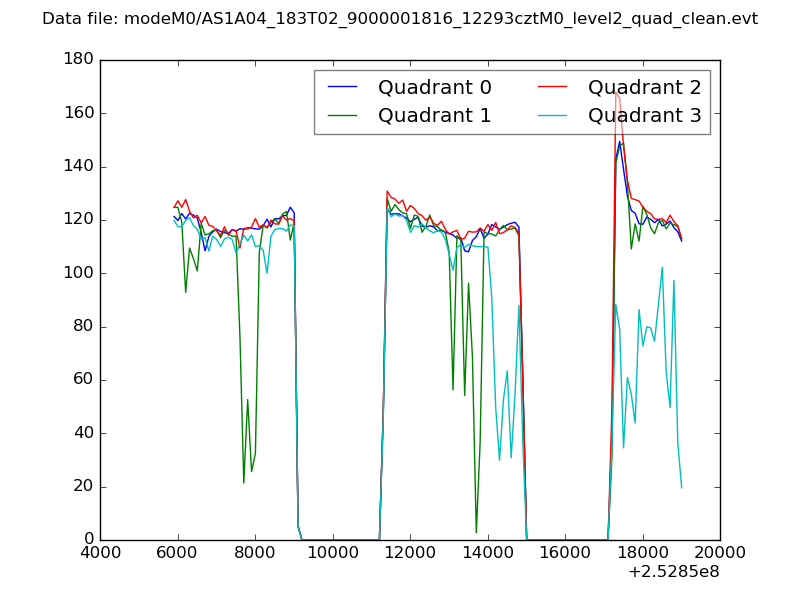
| Quadrant-wise count rates Data is divided into 100 sec bins |
 |
|
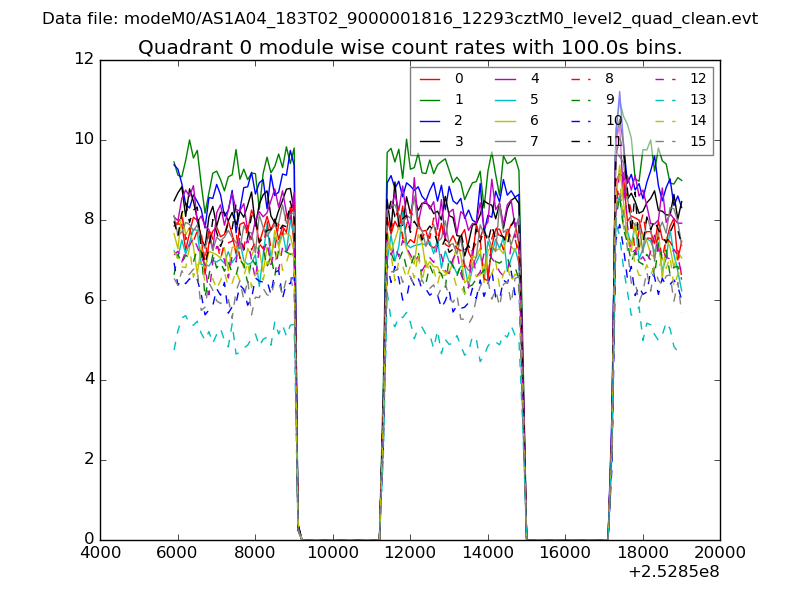
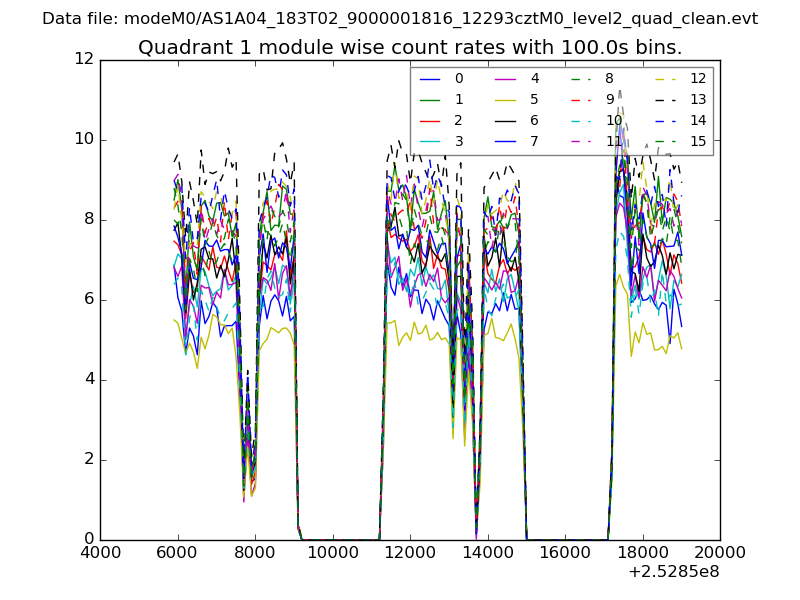
| Module-wise count rates for Quadrant A Data is divided into 100 sec bins |
 |
 |
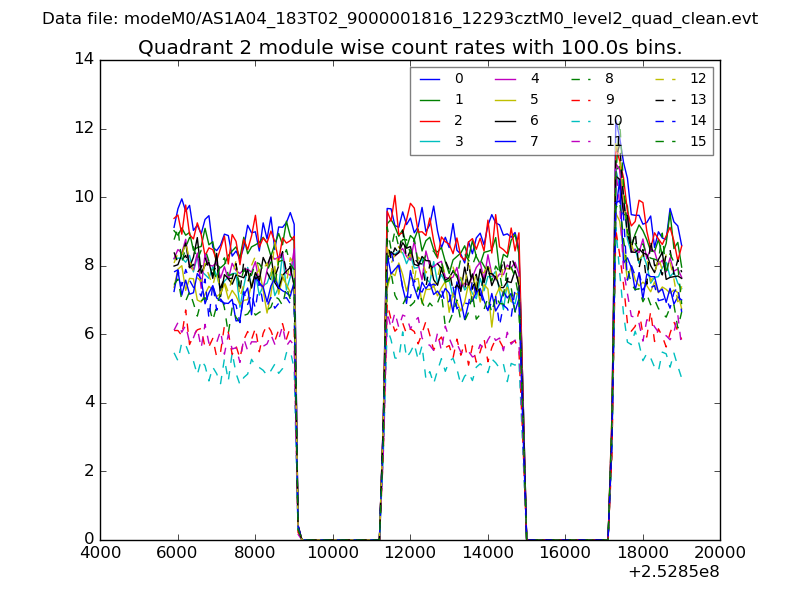
| Module-wise count rates for Quadrant B Data is divided into 100 sec bins |
 |
 |
| Module-wise count rates for Quadrant C Data is divided into 100 sec bins |
 |
 |
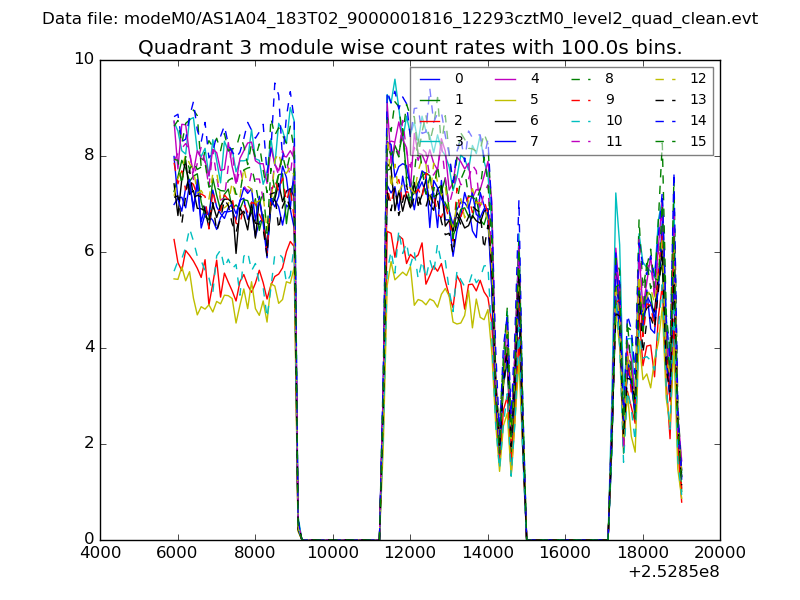
| Module-wise count rates for Quadrant D Data is divided into 100 sec bins |
 |
 |
| Parameter | Plot |
|---|---|
| CZT HV Monitor | 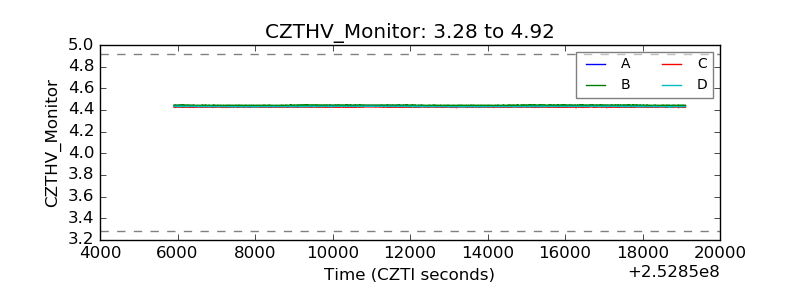 |
| D_VDD | 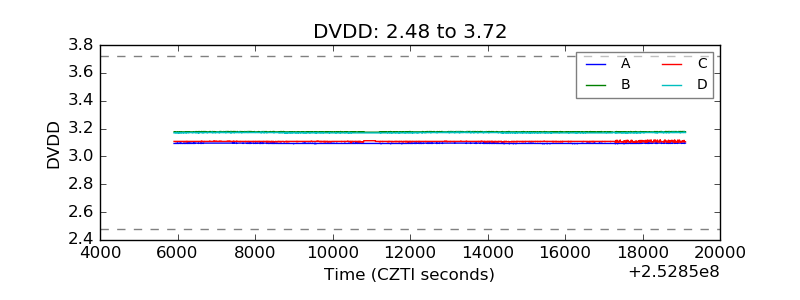 |
| Temperature 1 | 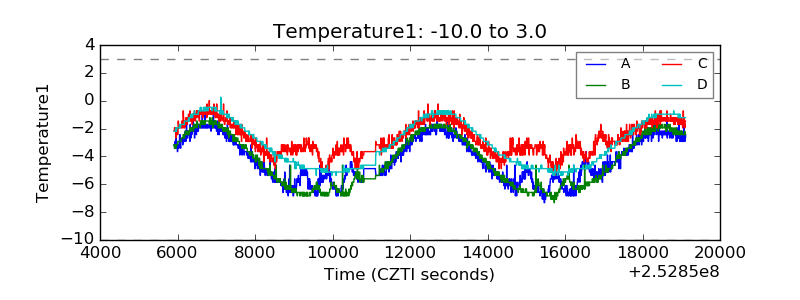 |
| Veto HV Monitor |  |
| Veto LLD | 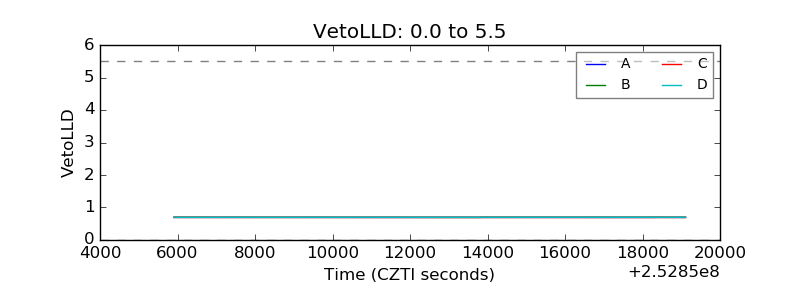 |
| Alpha Counter | 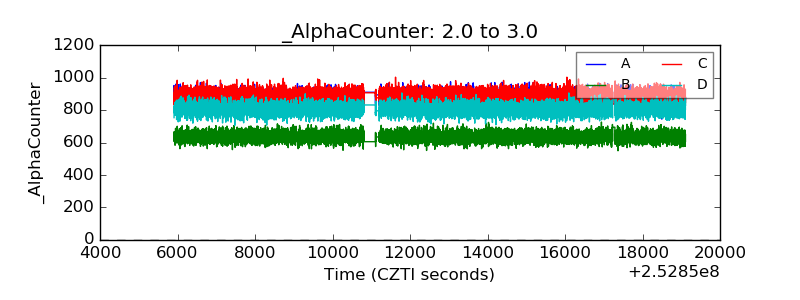 |
| _CPM_Rate | 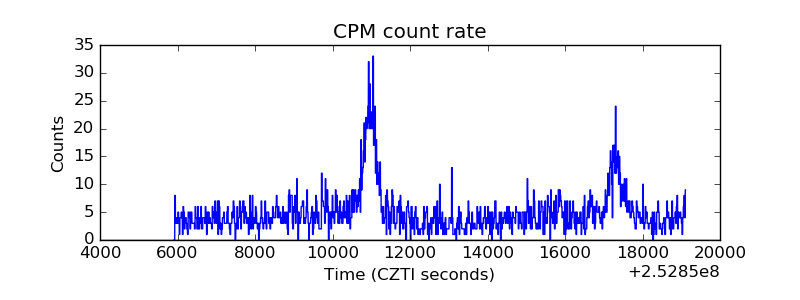 |
| CZT Counter | 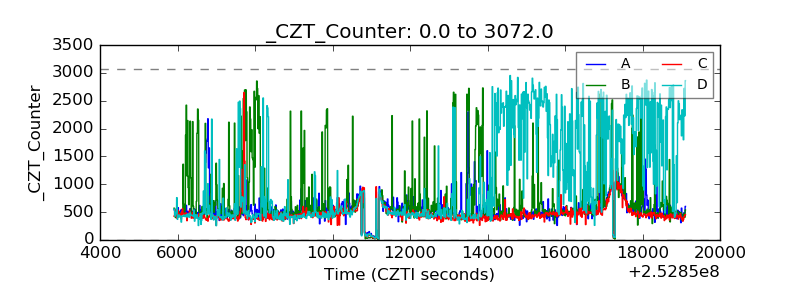 |
| +2.5 Volts monitor |  |
| +5 Volts monitor |  |
| _ROLL_ROT | 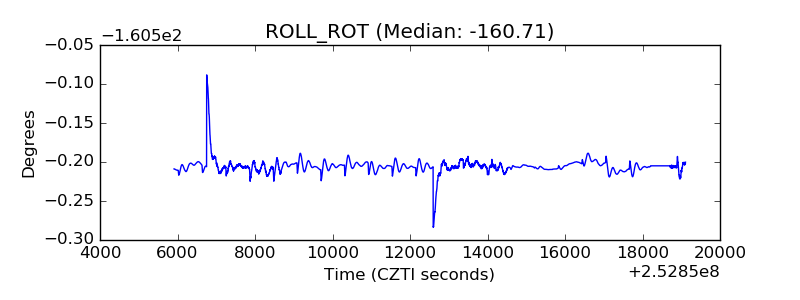 |
| _Roll_DEC | 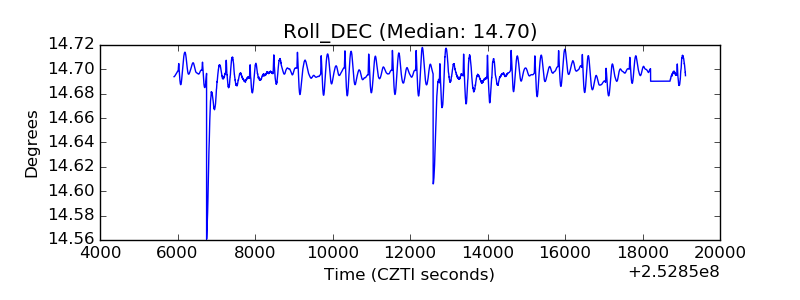 |
| _Roll_RA | 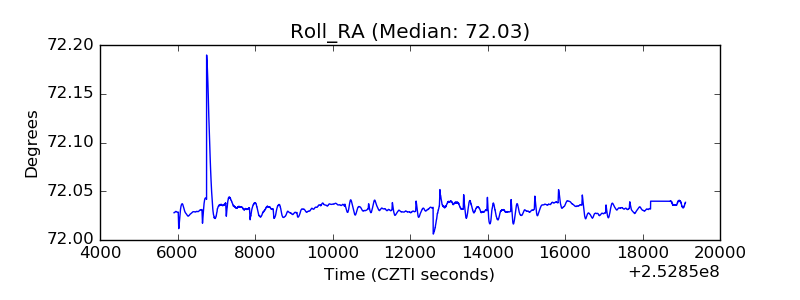 |
| Veto Counter | 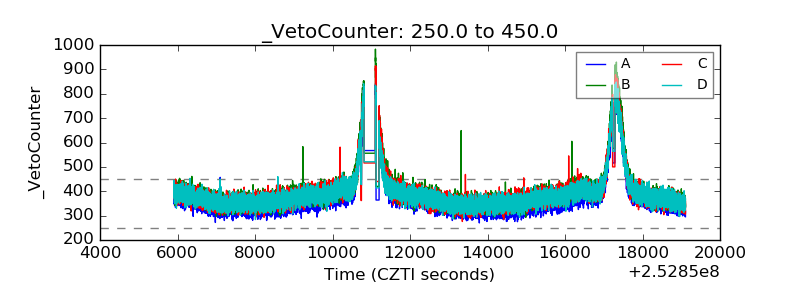 |