| Param | Original file | Final file |
|---|---|---|
| Filename | modeM0/AS1A04_183T02_9000001816_12294cztM0_level2.evt | modeM0/AS1A04_183T02_9000001816_12294cztM0_level2_quad_clean.evt |
| Size (bytes) | 814,743,360 | 91,131,840 |
| Size | 777.0 MB | 86.9 MB |
| Events in quadrant A | 3,930,370 | 614,656 |
| Events in quadrant B | 4,522,514 | 609,644 |
| Events in quadrant C | 3,407,272 | 625,767 |
| Events in quadrant D | 12,312,282 | 392,006 |
| Mode SS | |||
|---|---|---|---|
| Quadrant | BADHDUFLAG | Total packets | Discarded packets |
| A | 0 | 150 | 0 |
| B | 0 | 150 | 0 |
| C | 0 | 150 | 0 |
| D | 0 | 150 | 0 |
| Mode M9 | |||
|---|---|---|---|
| Quadrant | BADHDUFLAG | Total packets | Discarded packets |
| A | 0 | 3 | 0 |
| B | 0 | 3 | 0 |
| C | 0 | 3 | 0 |
| D | 0 | 3 | 0 |
| Mode M0 | |||
|---|---|---|---|
| Quadrant | BADHDUFLAG | Total packets | Discarded packets |
| A | 0 | 16398 | 2 |
| B | 0 | 18237 | 1 |
| C | 0 | 15313 | 1 |
| D | 0 | 41592 | 1 |
| Quadrant | Total seconds | Saturated seconds | Saturation percentage |
|---|---|---|---|
| A | 7420 | 124 | 1.671159% |
| B | 7420 | 337 | 4.541779% |
| C | 7420 | 52 | 0.700809% |
| D | 7420 | 3847 | 51.846361% |
Noise dominated data is calculated using 1-second bins in cleaned event files. If a bin has >2000 counts, and if more than 50% of those come from <1% of pixels, then it is considered to be noise-dominated and hence unusable.
| Quadrant | # 1 sec bins | Bins with >0 counts | Bins with >2000 counts | High rate bins dominated by noise | Noise dominated (total time) | Noise dominated (detector-on time) | Marked lightcurve |
|---|---|---|---|---|---|---|---|
| A | 7741 | 7422 | 10 | 10 | 0.13% | 0.13% | 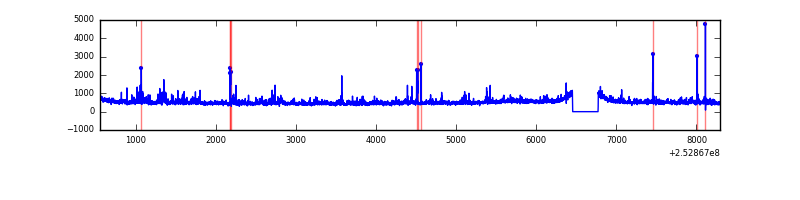 |
| B | 7741 | 7422 | 153 | 153 | 1.98% | 2.06% | 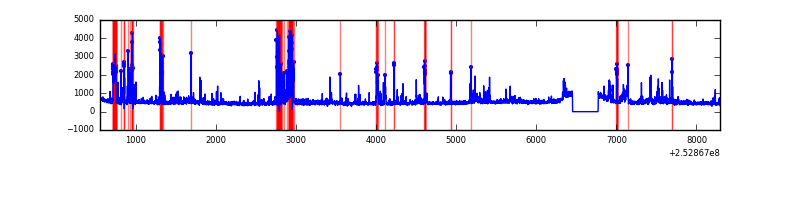 |
| C | 7741 | 7422 | 1 | 1 | 0.01% | 0.01% | 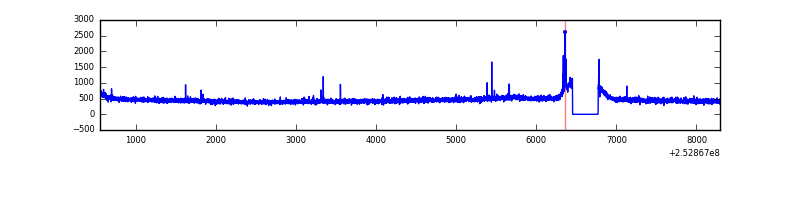 |
| D | 7741 | 7421 | 2770 | 2770 | 35.78% | 37.33% | 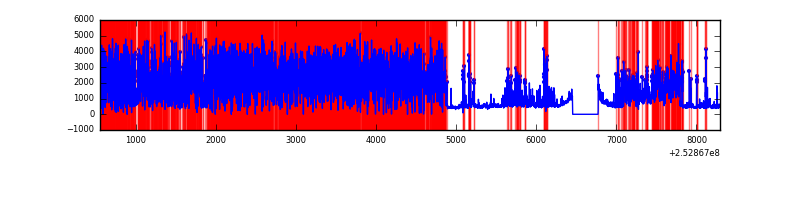 |
Top three noisy pixels from each quadrant. If the there are fewer than three noisy pixels in the level2.evt file, extra rows are filled as -1
| Pixel properties | Quadrant properties | ||||||
|---|---|---|---|---|---|---|---|
| Quadrant | DetID | PixID | Counts | Sigma | Mean | Median | Sigma |
| A | 1 | 162 | 123098 | 670.05 | 886 | 867 | 182.4 |
| A | 1 | 178 | 60829 | 328.7 | 886 | 867 | 182.4 |
| A | 0 | 23 | 58527 | 316.08 | 886 | 867 | 182.4 |
| B | 4 | 239 | 610885 | 3641.54 | 873 | 850 | 167.5 |
| B | 11 | 51 | 132608 | 786.52 | 873 | 850 | 167.5 |
| B | 0 | 85 | 103743 | 614.21 | 873 | 850 | 167.5 |
| C | 14 | 234 | 24945 | 119.19 | 859 | 863 | 202.1 |
| C | 15 | 208 | 13082 | 60.47 | 859 | 863 | 202.1 |
| C | 8 | 128 | 9919 | 44.82 | 859 | 863 | 202.1 |
| D | 1 | 52 | 9145574 | 62286.55 | 604 | 585 | 146.8 |
| D | 5 | 222 | 442516 | 3009.99 | 604 | 585 | 146.8 |
| D | 7 | 71 | 129815 | 880.19 | 604 | 585 | 146.8 |
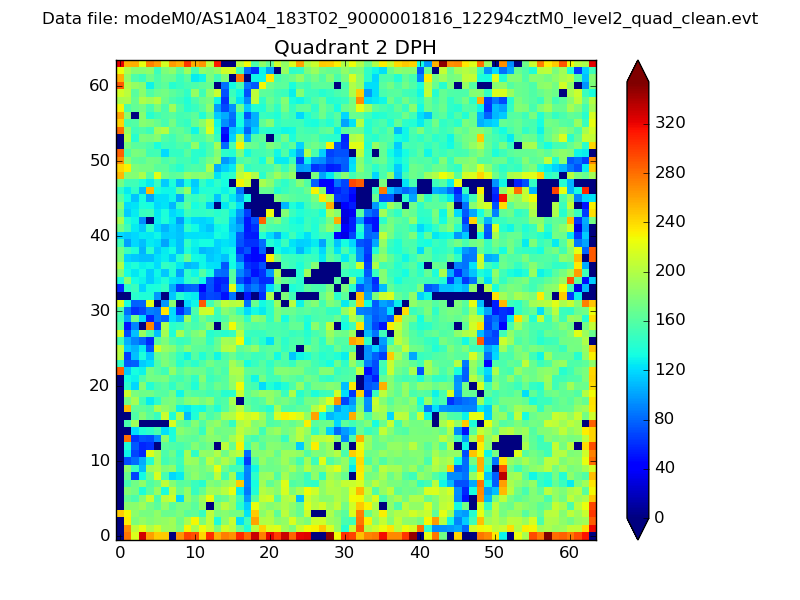
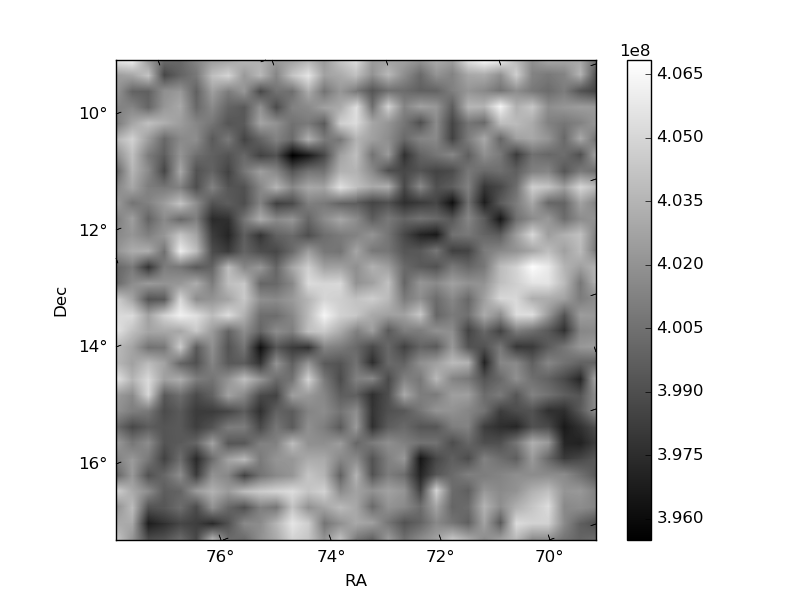
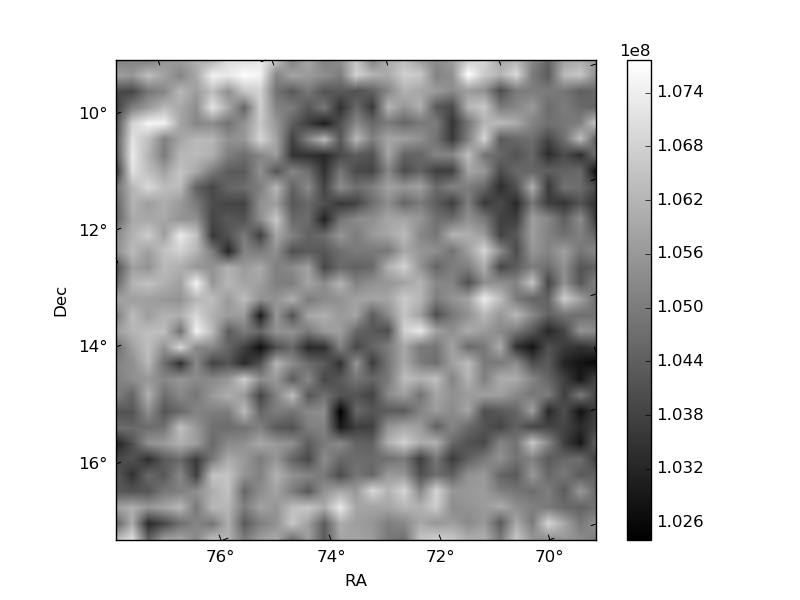
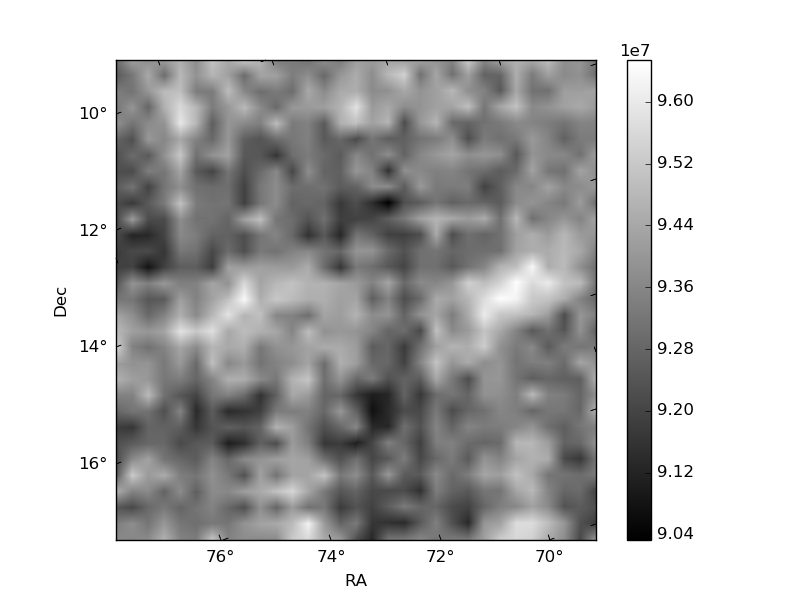
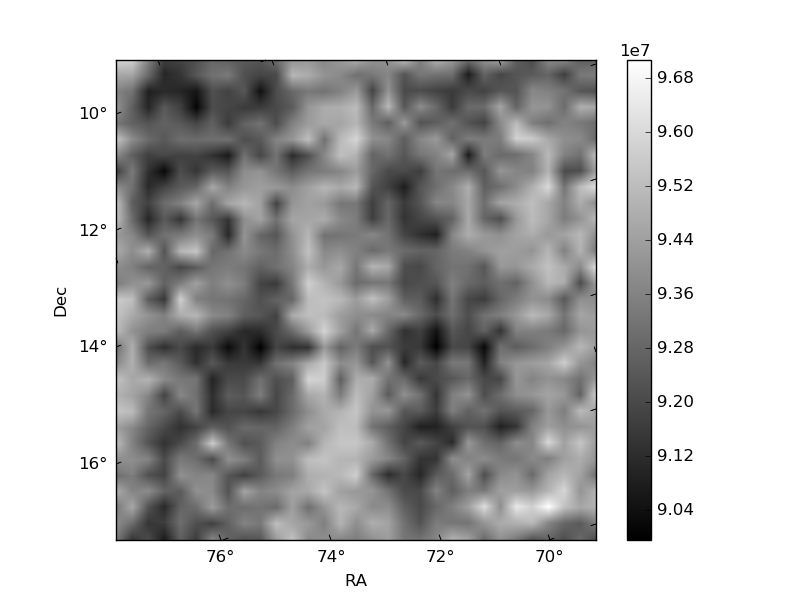
Histogram calculated using DETX and DETY for each event in the final _common_clean file
| Quadrant A | 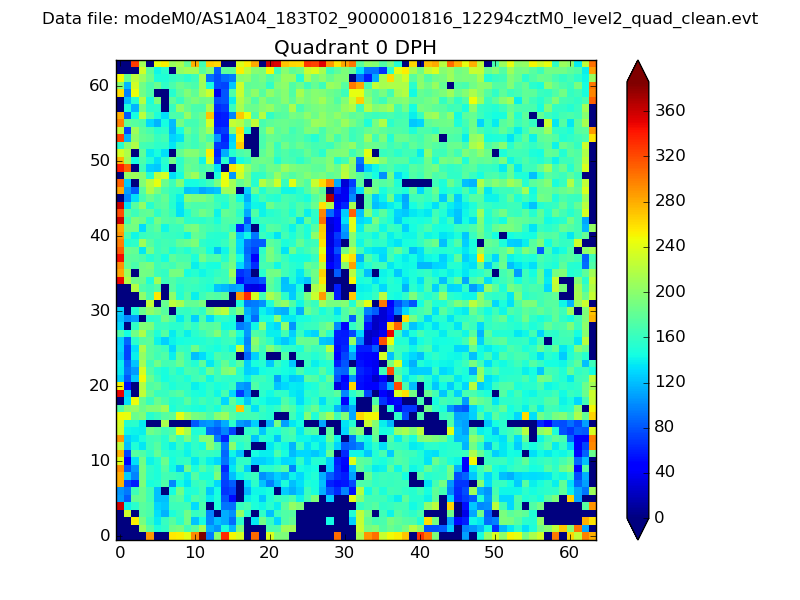 |
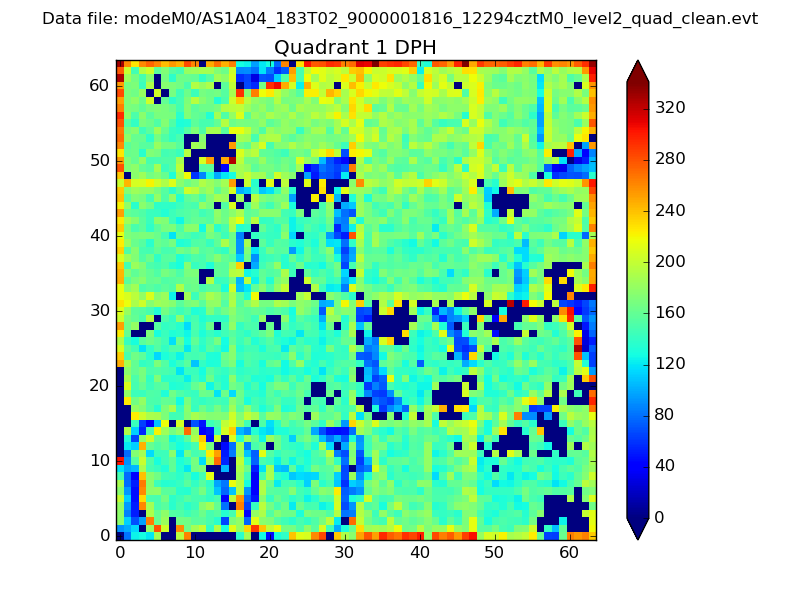 |
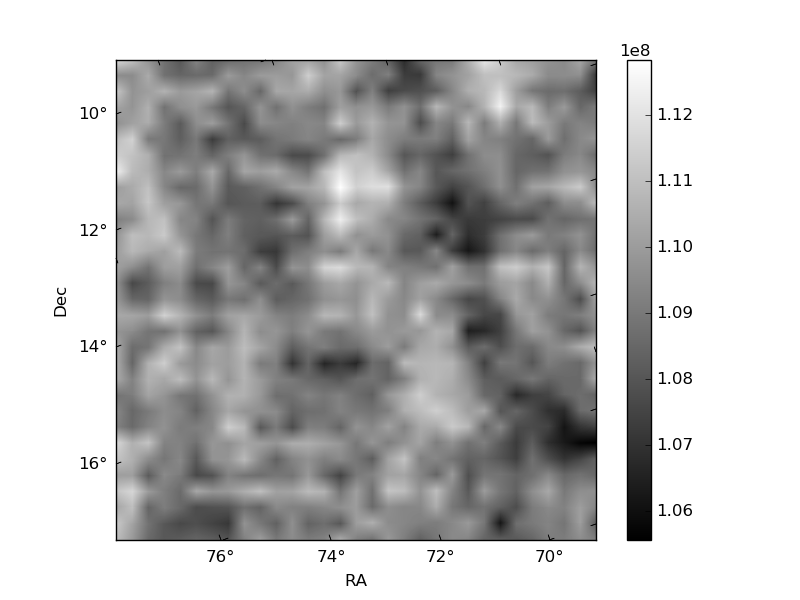
Quadrant B |
|---|---|---|---|
| Quadrant D | 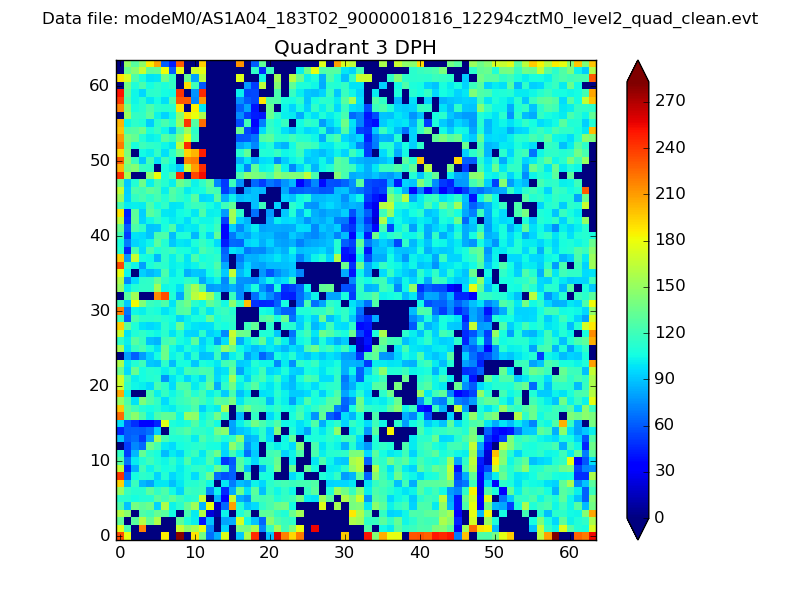 |
 |
Quadrant C |
| Plot type | Count rate plots | Images |
|---|---|---|
| Comparison with Poisson distribution Blue bars denote a histogram of data divided into 1 sec bins. Red curve is a Poisson curve with rate = median count rate of data. |
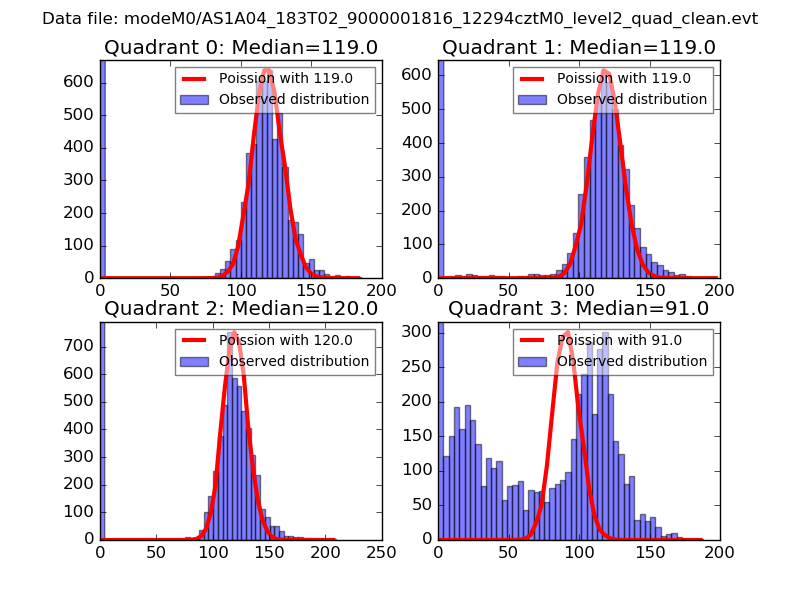 |
 |
| Quadrant-wise count rates Data is divided into 100 sec bins |
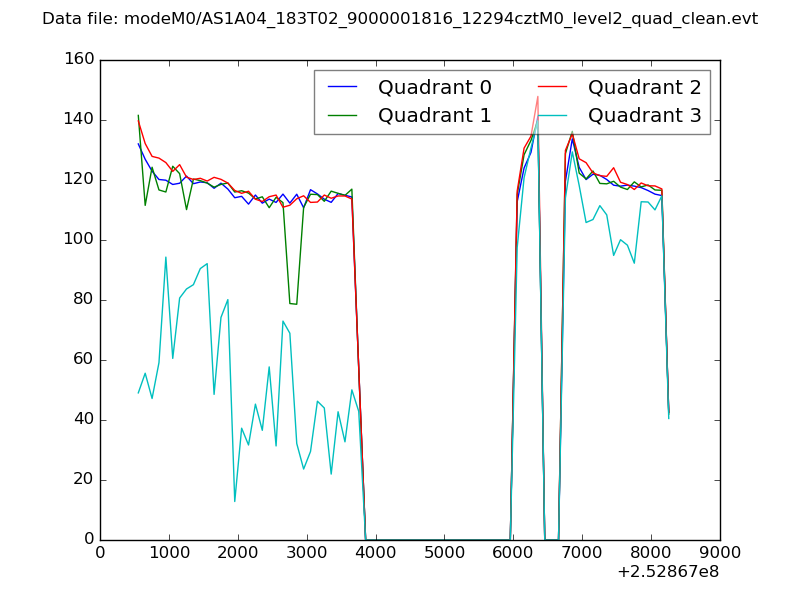 |
|
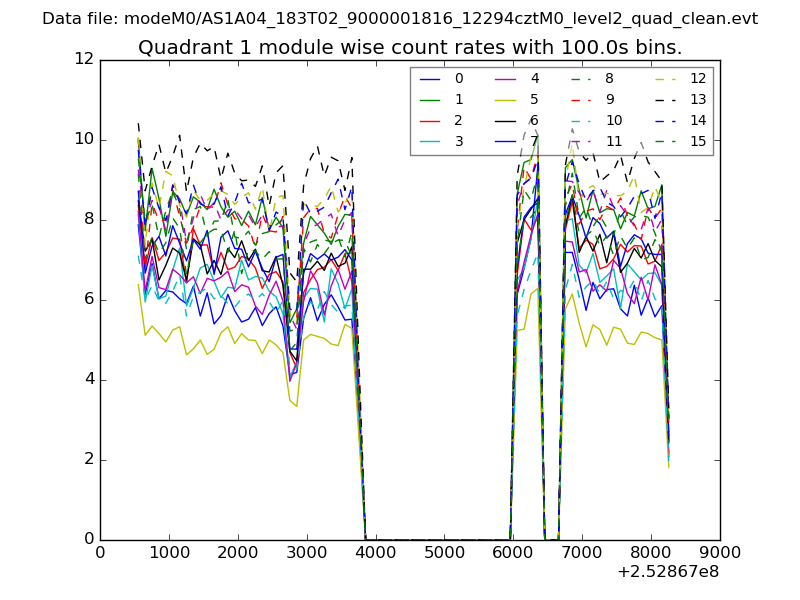
| Module-wise count rates for Quadrant A Data is divided into 100 sec bins |
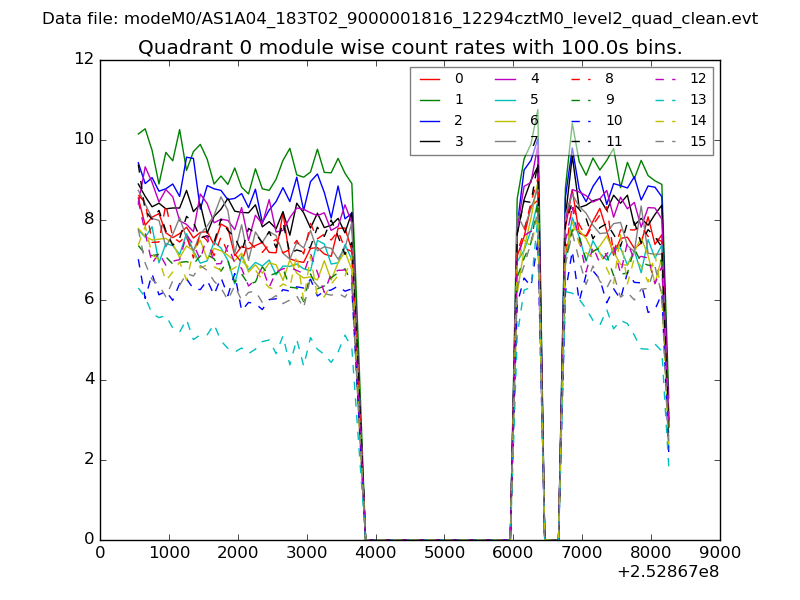 |
 |
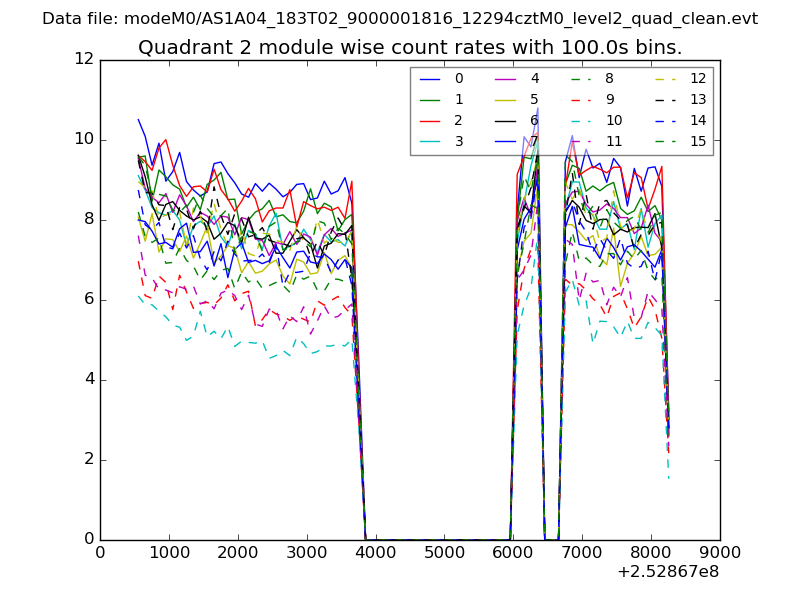
| Module-wise count rates for Quadrant B Data is divided into 100 sec bins |
 |
 |
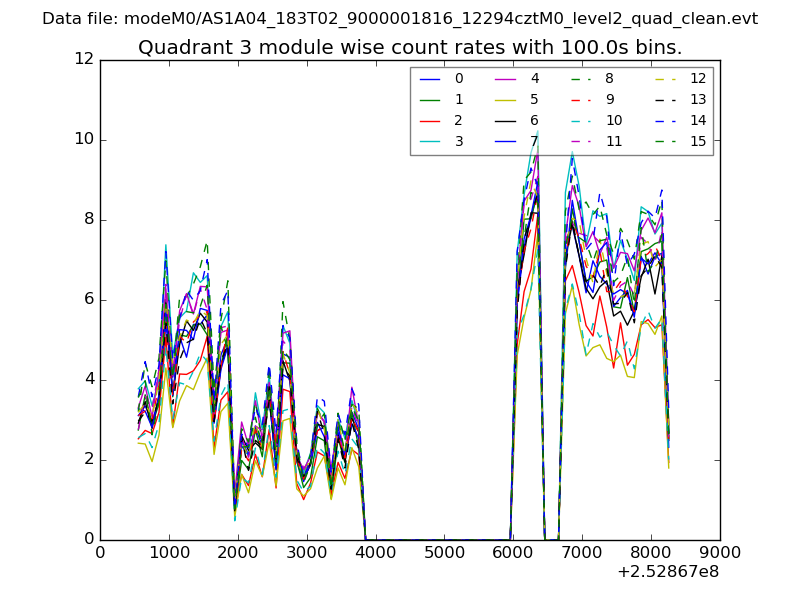
| Module-wise count rates for Quadrant C Data is divided into 100 sec bins |
 |
 |
| Module-wise count rates for Quadrant D Data is divided into 100 sec bins |
 |
 |
| Parameter | Plot |
|---|---|
| CZT HV Monitor | 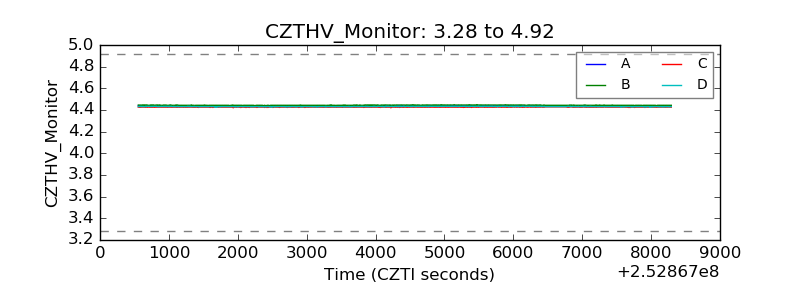 |
| D_VDD | 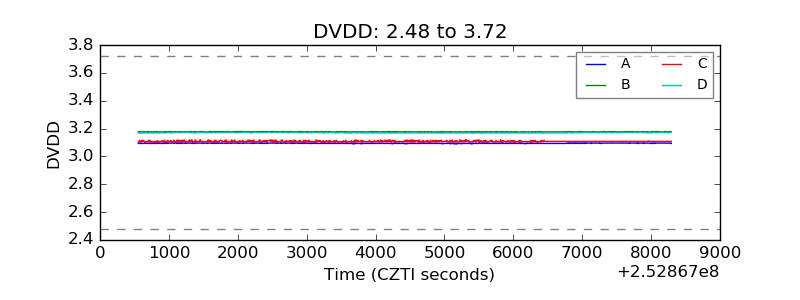 |
| Temperature 1 | 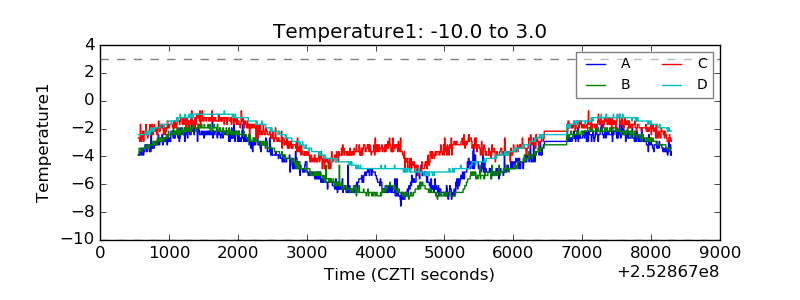 |
| Veto HV Monitor | 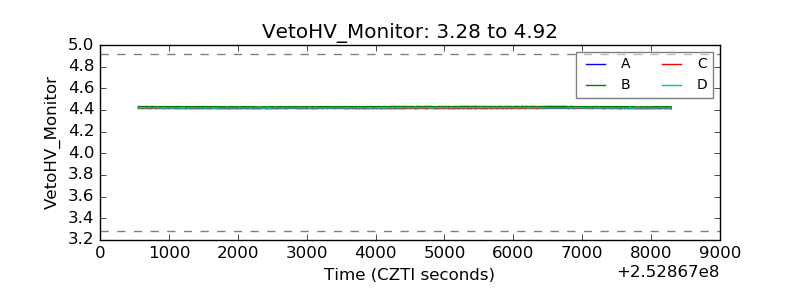 |
| Veto LLD | 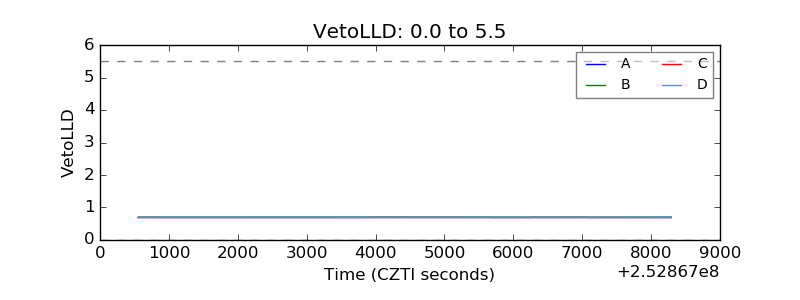 |
| Alpha Counter | 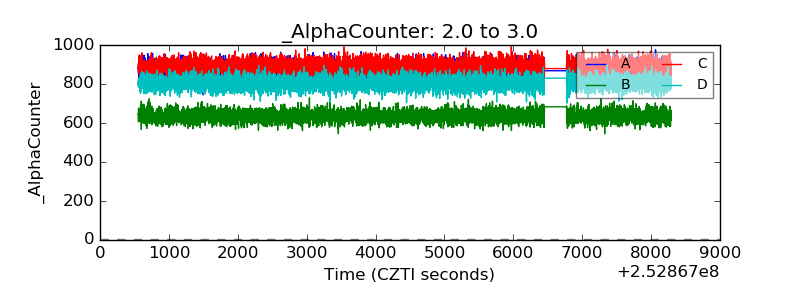 |
| _CPM_Rate | 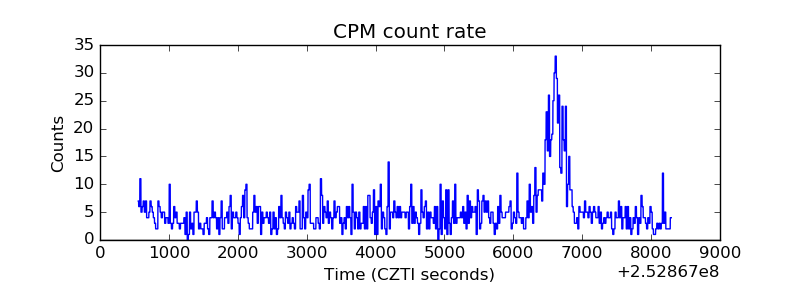 |
| CZT Counter | 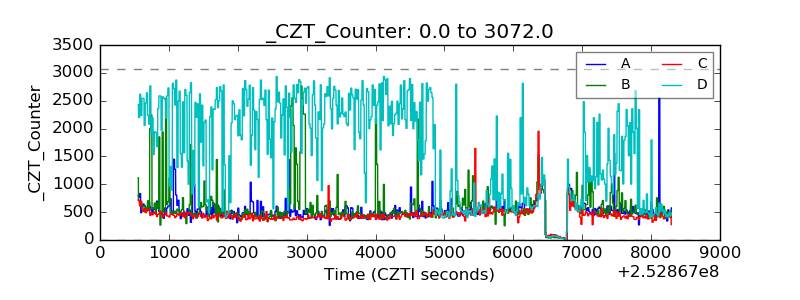 |
| +2.5 Volts monitor |  |
| +5 Volts monitor |  |
| _ROLL_ROT | 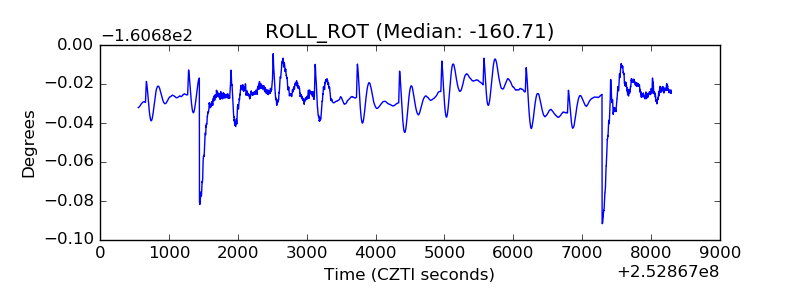 |
| _Roll_DEC | 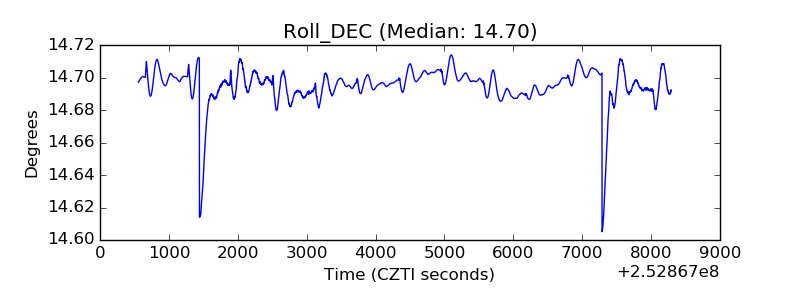 |
| _Roll_RA | 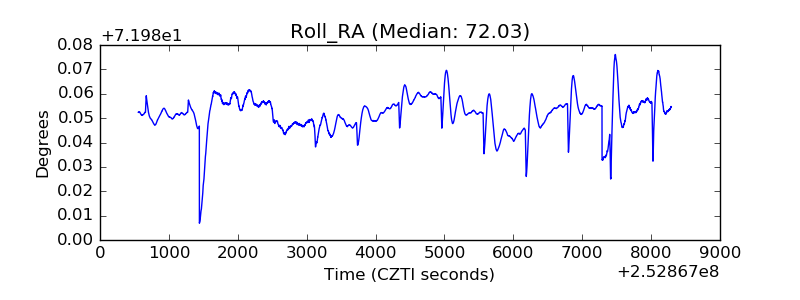 |
| Veto Counter | 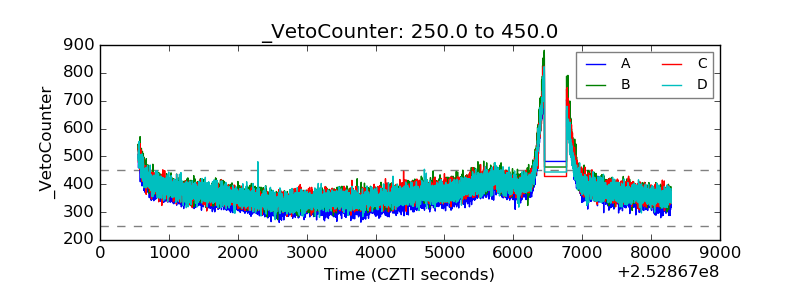 |