| Param | Original file | Final file |
|---|---|---|
| Filename | modeM0/AS1A04_183T02_9000001816_12297cztM0_level2.evt | modeM0/AS1A04_183T02_9000001816_12297cztM0_level2_quad_clean.evt |
| Size (bytes) | 1,451,638,080 | 225,887,040 |
| Size | 1.4 GB | 215.4 MB |
| Events in quadrant A | 11,119,637 | 1,386,343 |
| Events in quadrant B | 10,374,775 | 1,411,384 |
| Events in quadrant C | 8,428,647 | 1,432,333 |
| Events in quadrant D | 12,797,248 | 1,341,921 |
| Mode SS | |||
|---|---|---|---|
| Quadrant | BADHDUFLAG | Total packets | Discarded packets |
| A | 0 | 374 | 0 |
| B | 0 | 374 | 0 |
| C | 0 | 374 | 0 |
| D | 0 | 374 | 0 |
| Mode M9 | |||
|---|---|---|---|
| Quadrant | BADHDUFLAG | Total packets | Discarded packets |
| A | 0 | 25 | 0 |
| B | 0 | 25 | 0 |
| C | 0 | 25 | 0 |
| D | 0 | 25 | 0 |
| Mode M0 | |||
|---|---|---|---|
| Quadrant | BADHDUFLAG | Total packets | Discarded packets |
| A | 0 | 45069 | 5 |
| B | 0 | 42818 | 4 |
| C | 0 | 37988 | 4 |
| D | 0 | 50275 | 4 |
| Quadrant | Total seconds | Saturated seconds | Saturation percentage |
|---|---|---|---|
| A | 18419 | 650 | 3.528965% |
| B | 18419 | 546 | 2.964330% |
| C | 18419 | 108 | 0.586351% |
| D | 18419 | 749 | 4.066453% |
Noise dominated data is calculated using 1-second bins in cleaned event files. If a bin has >2000 counts, and if more than 50% of those come from <1% of pixels, then it is considered to be noise-dominated and hence unusable.
| Quadrant | # 1 sec bins | Bins with >0 counts | Bins with >2000 counts | High rate bins dominated by noise | Noise dominated (total time) | Noise dominated (detector-on time) | Marked lightcurve |
|---|---|---|---|---|---|---|---|
| A | 20800 | 18424 | 376 | 376 | 1.81% | 2.04% | 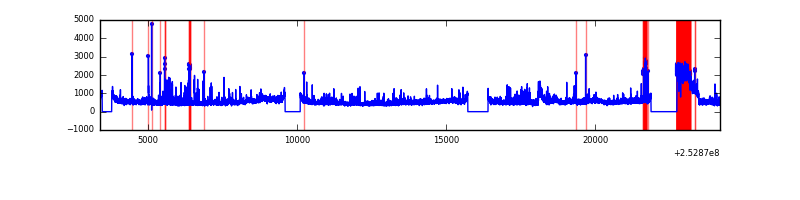 |
| B | 20800 | 18424 | 207 | 207 | 1.00% | 1.12% | 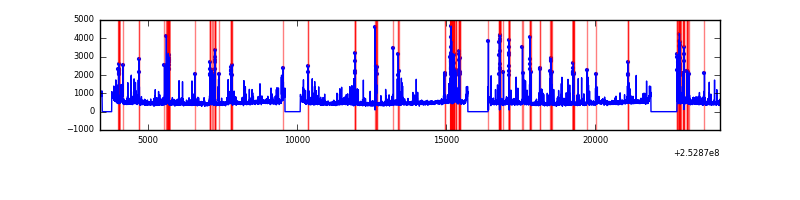 |
| C | 20800 | 18424 | 22 | 22 | 0.11% | 0.12% | 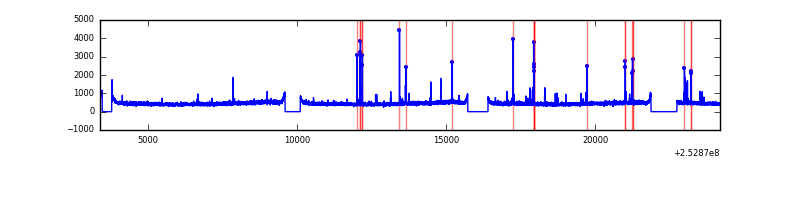 |
| D | 20800 | 18424 | 603 | 603 | 2.90% | 3.27% | 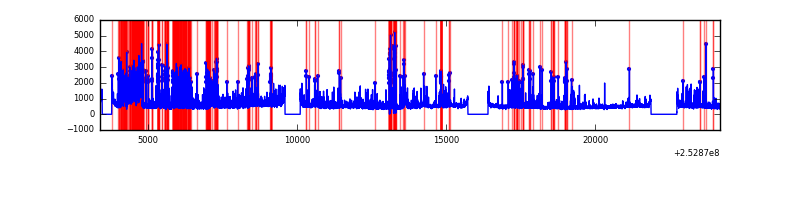 |
Top three noisy pixels from each quadrant. If the there are fewer than three noisy pixels in the level2.evt file, extra rows are filled as -1
| Pixel properties | Quadrant properties | ||||||
|---|---|---|---|---|---|---|---|
| Quadrant | DetID | PixID | Counts | Sigma | Mean | Median | Sigma |
| A | 0 | 23 | 1627146 | 3706.0 | 2148 | 2109 | 438.5 |
| A | 1 | 162 | 305064 | 690.91 | 2148 | 2109 | 438.5 |
| A | 1 | 178 | 162101 | 364.87 | 2148 | 2109 | 438.5 |
| B | 4 | 239 | 984951 | 2401.68 | 2150 | 2099 | 409.2 |
| B | 3 | 64 | 288188 | 699.08 | 2150 | 2099 | 409.2 |
| B | 0 | 85 | 226812 | 549.1 | 2150 | 2099 | 409.2 |
| C | 14 | 234 | 172257 | 347.69 | 2108 | 2122 | 489.3 |
| C | 15 | 208 | 28939 | 54.8 | 2108 | 2122 | 489.3 |
| C | 13 | 61 | 15139 | 26.6 | 2108 | 2122 | 489.3 |
| D | 1 | 52 | 1970492 | 3923.3 | 2077 | 2018 | 501.7 |
| D | 5 | 222 | 1876467 | 3735.9 | 2077 | 2018 | 501.7 |
| D | 9 | 85 | 245899 | 486.07 | 2077 | 2018 | 501.7 |
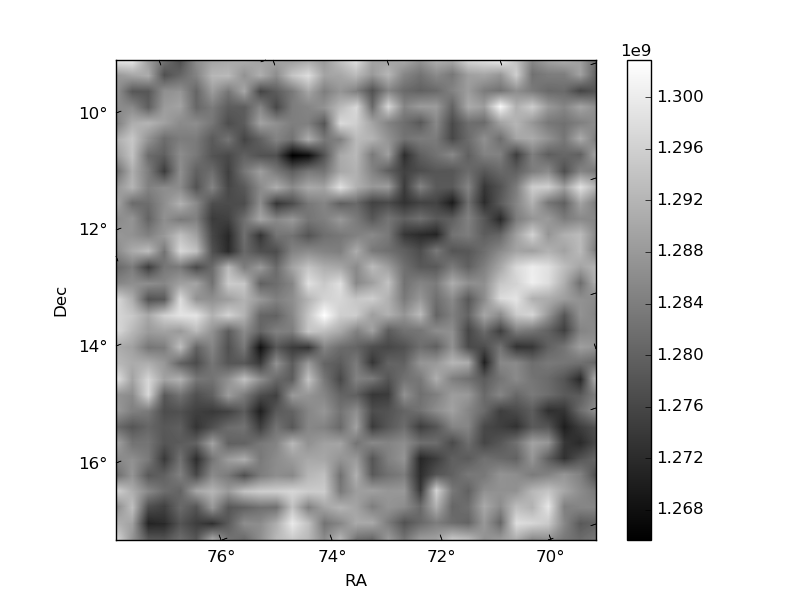
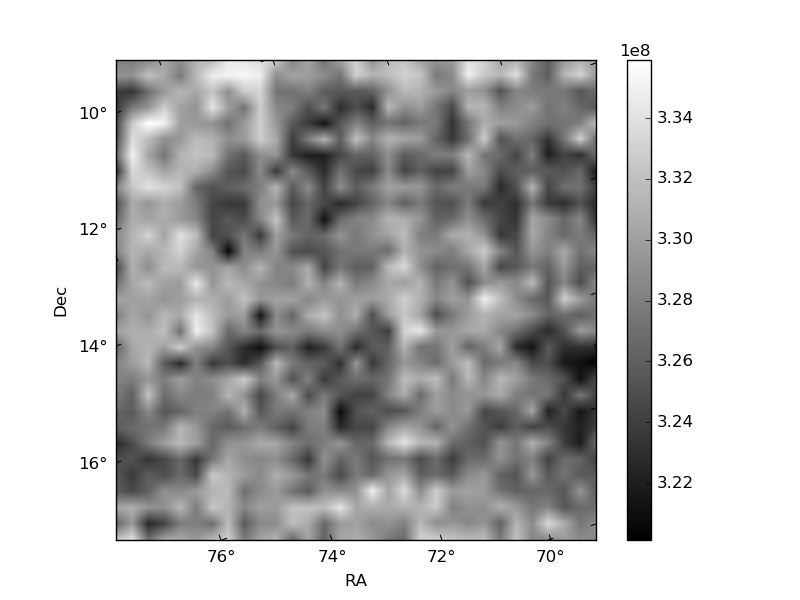
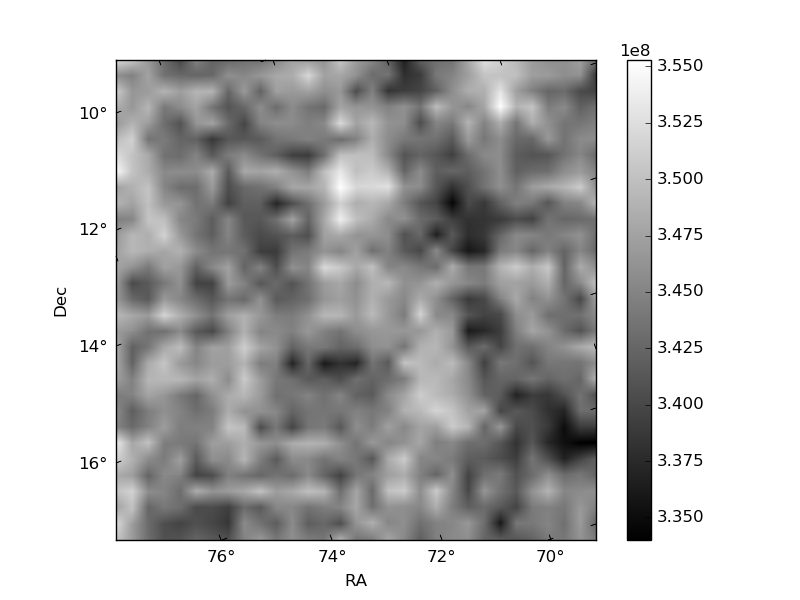
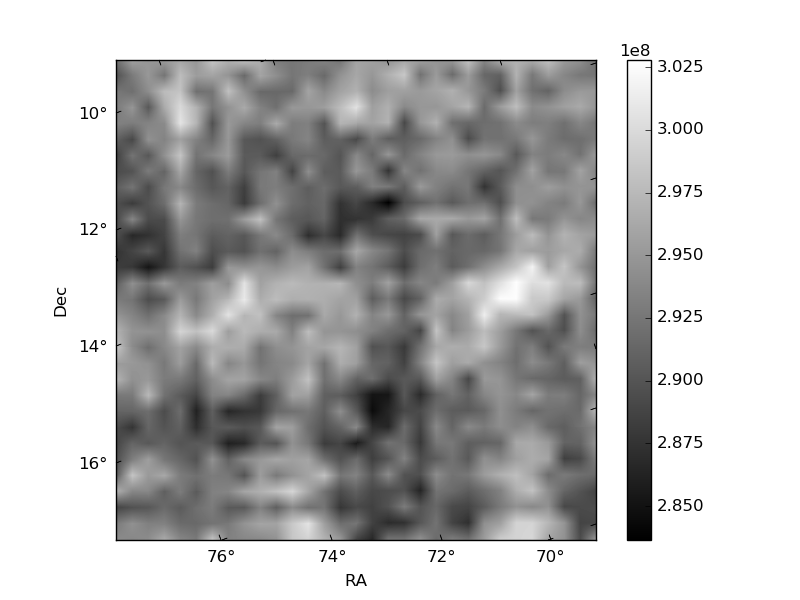
Histogram calculated using DETX and DETY for each event in the final _common_clean file
| Quadrant A | 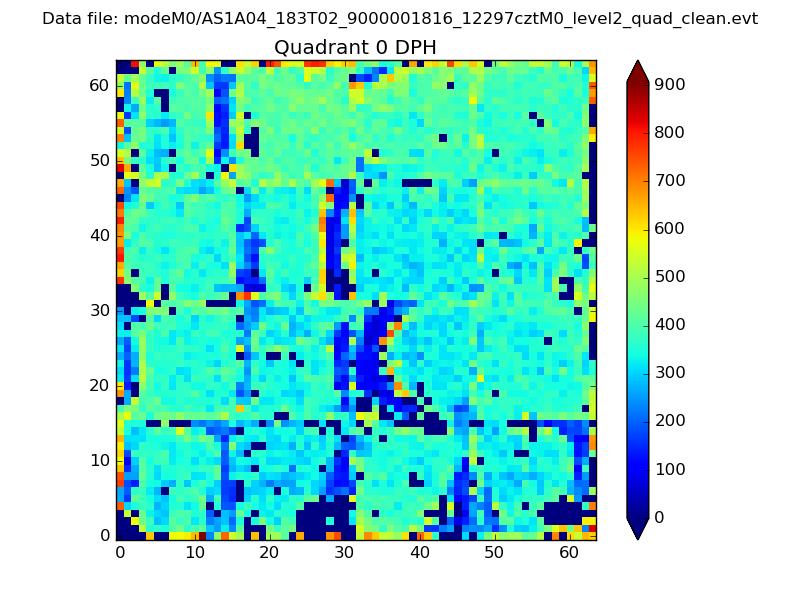 |
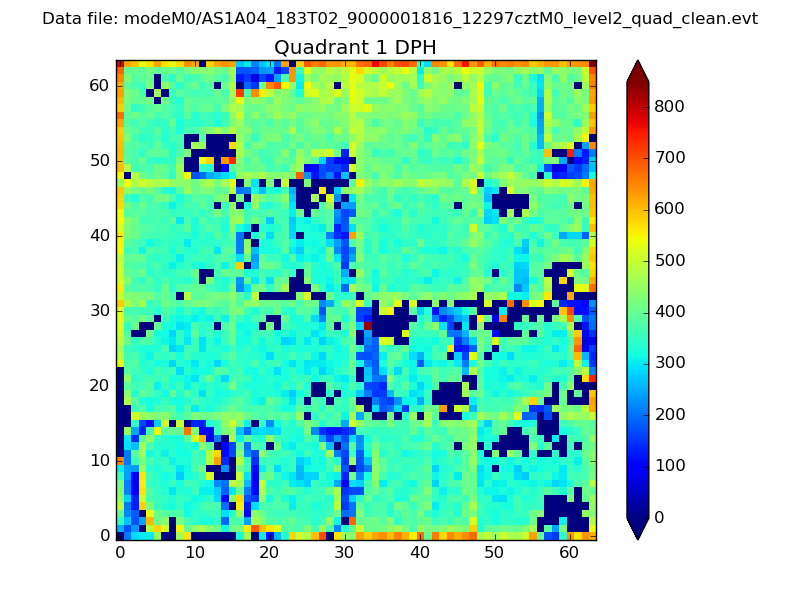 |
Quadrant B |
|---|---|---|---|
| Quadrant D | 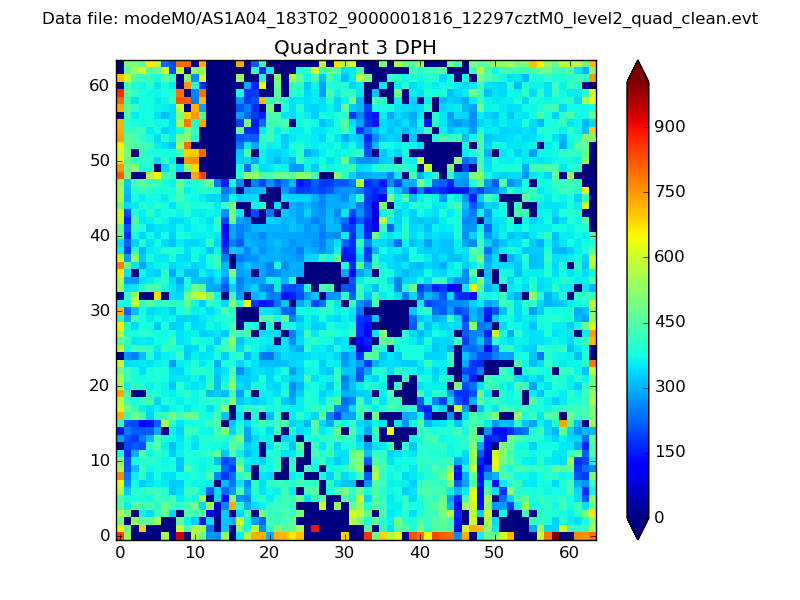 |
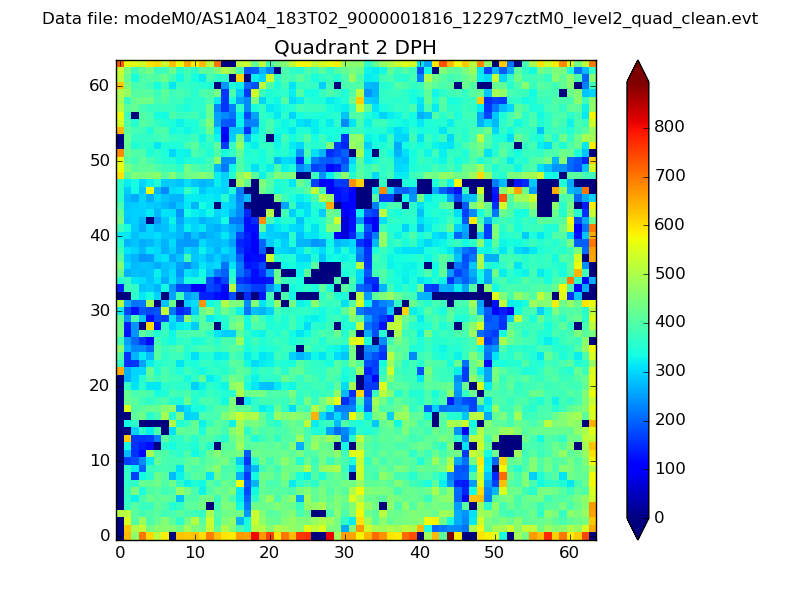 |
Quadrant C |
| Plot type | Count rate plots | Images |
|---|---|---|
| Comparison with Poisson distribution Blue bars denote a histogram of data divided into 1 sec bins. Red curve is a Poisson curve with rate = median count rate of data. |
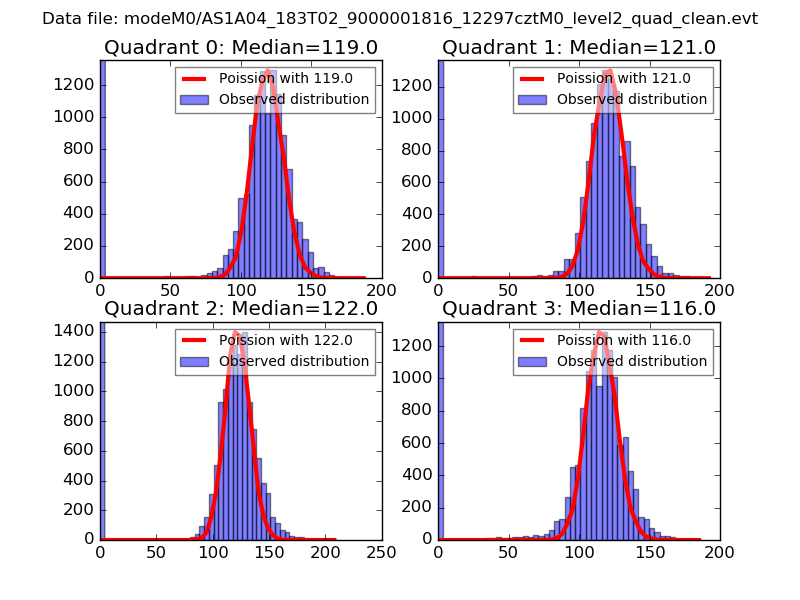 |
 |
| Quadrant-wise count rates Data is divided into 100 sec bins |
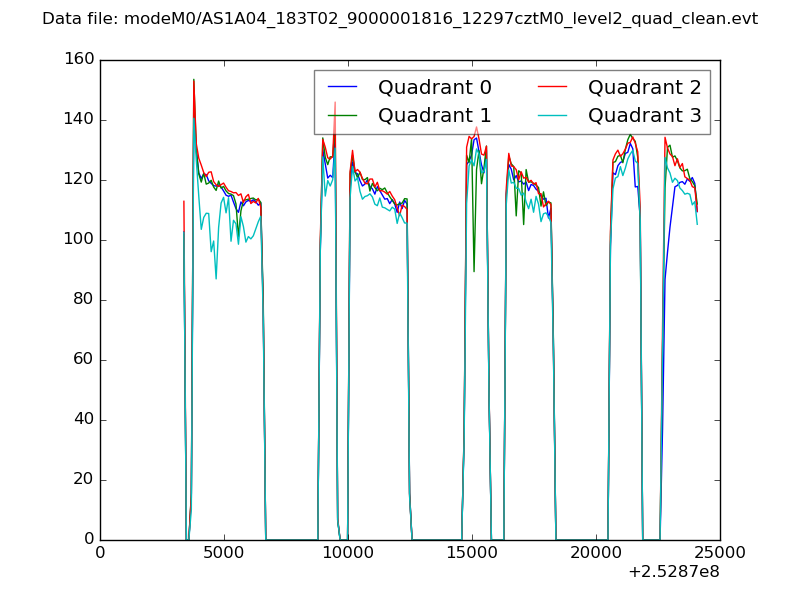 |
|
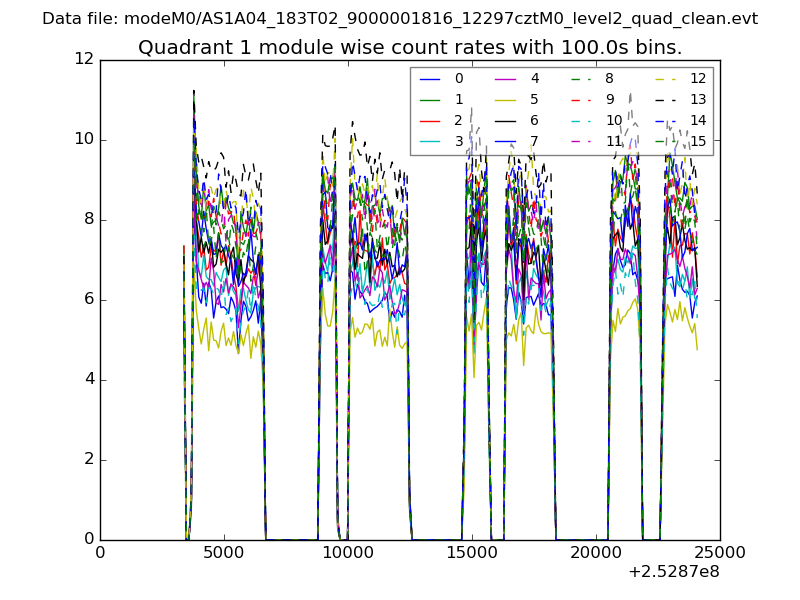
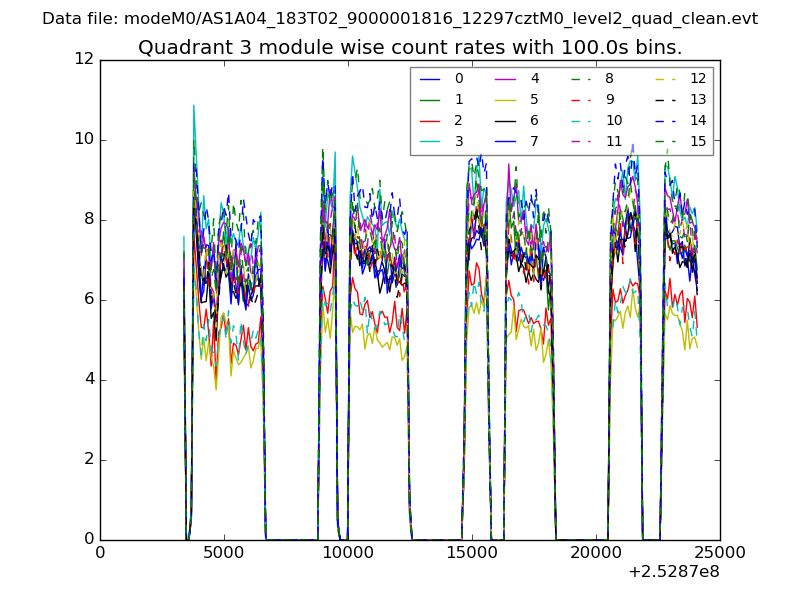
| Module-wise count rates for Quadrant A Data is divided into 100 sec bins |
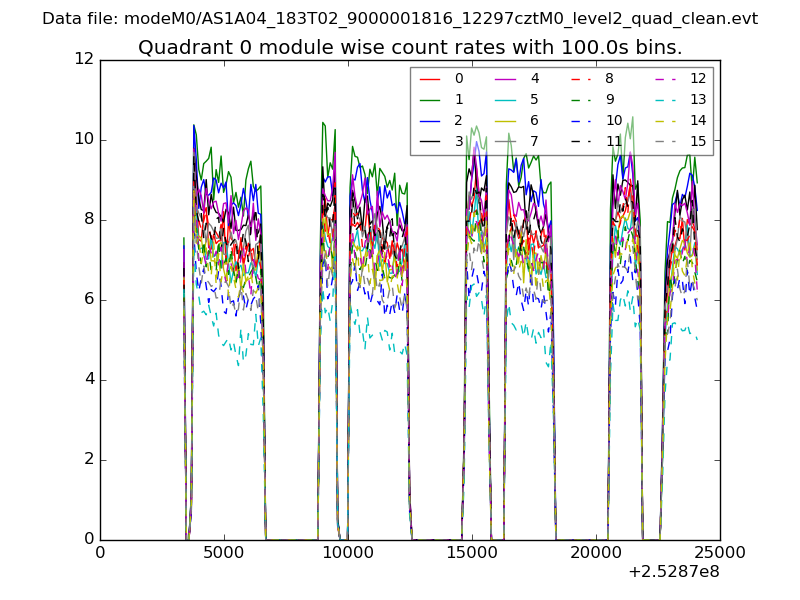 |
 |
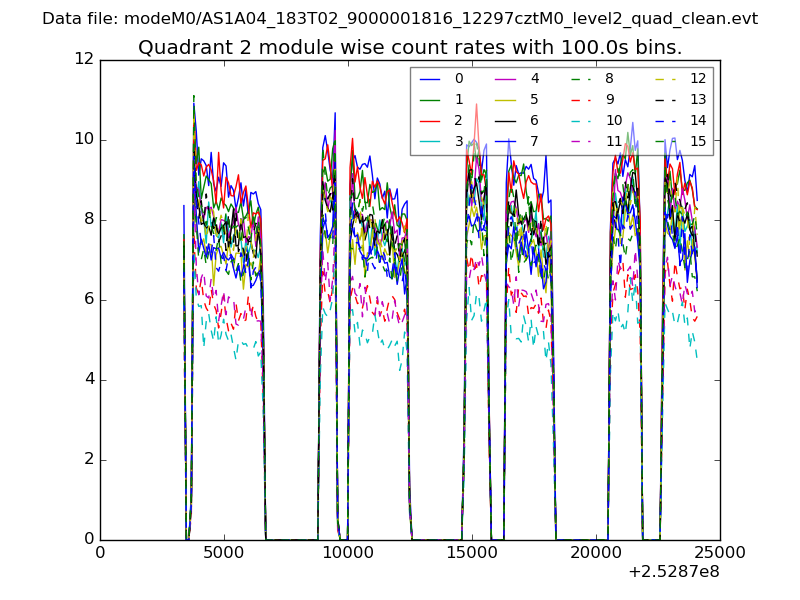
| Module-wise count rates for Quadrant B Data is divided into 100 sec bins |
 |
 |
| Module-wise count rates for Quadrant C Data is divided into 100 sec bins |
 |
 |
| Module-wise count rates for Quadrant D Data is divided into 100 sec bins |
 |
 |
| Parameter | Plot |
|---|---|
| CZT HV Monitor | 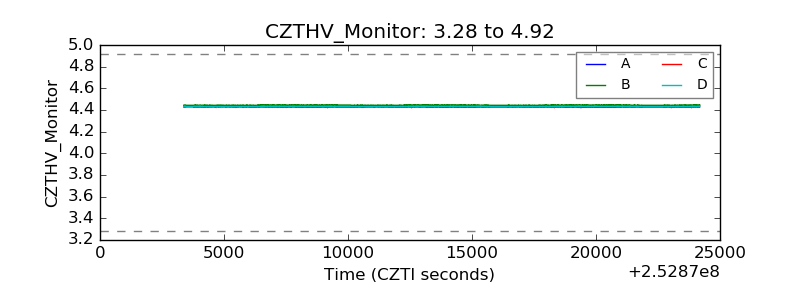 |
| D_VDD | 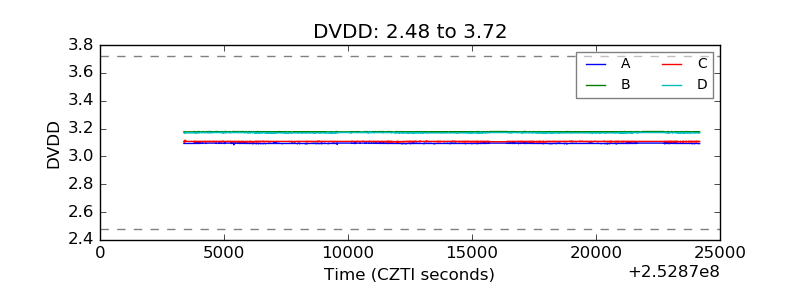 |
| Temperature 1 | 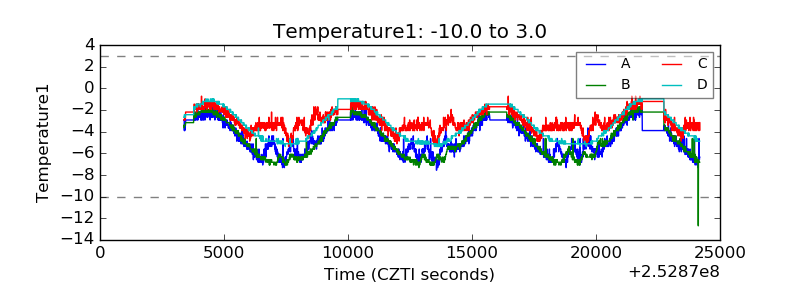 |
| Veto HV Monitor | 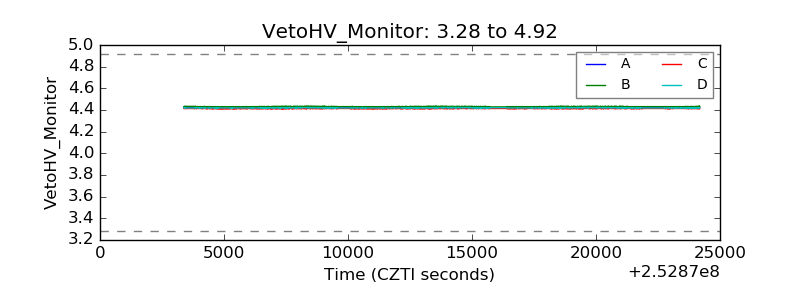 |
| Veto LLD | 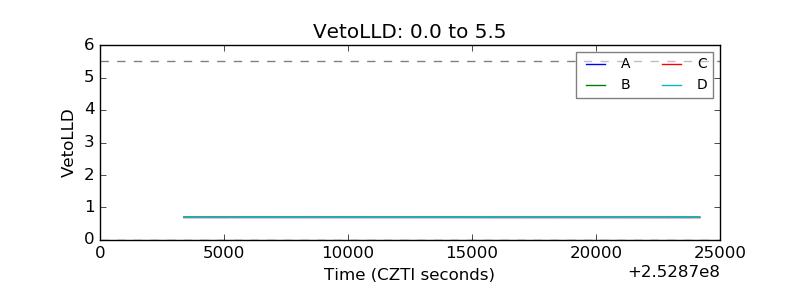 |
| Alpha Counter | 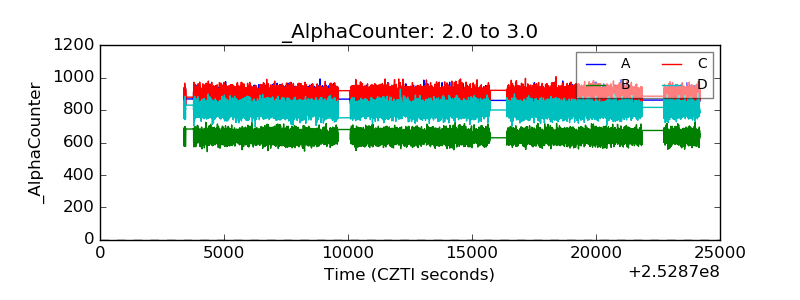 |
| _CPM_Rate | 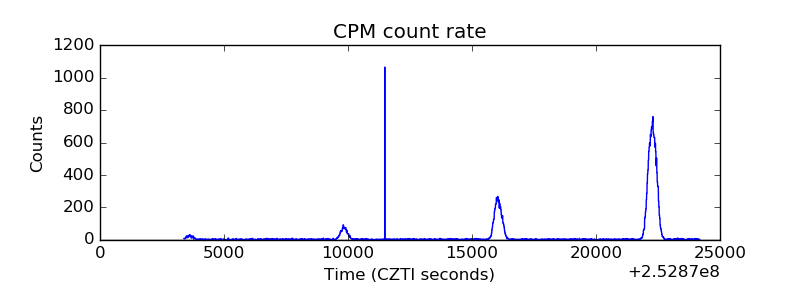 |
| CZT Counter | 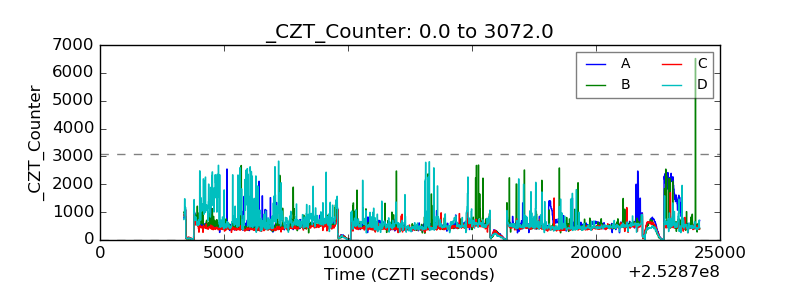 |
| +2.5 Volts monitor |  |
| +5 Volts monitor | 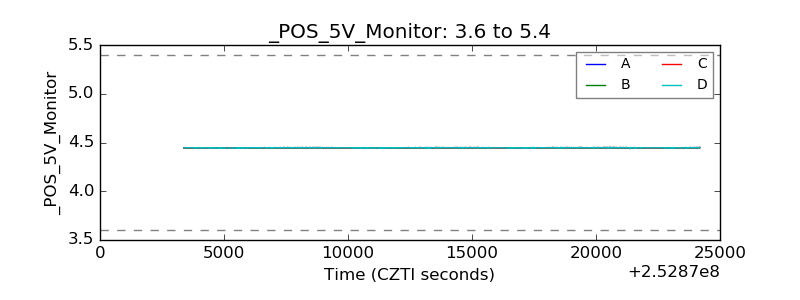 |
| _ROLL_ROT | 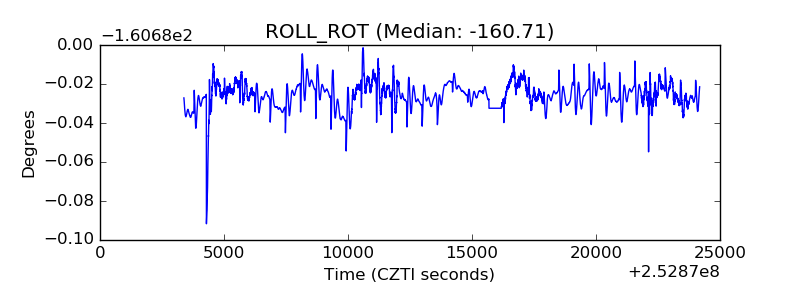 |
| _Roll_DEC | 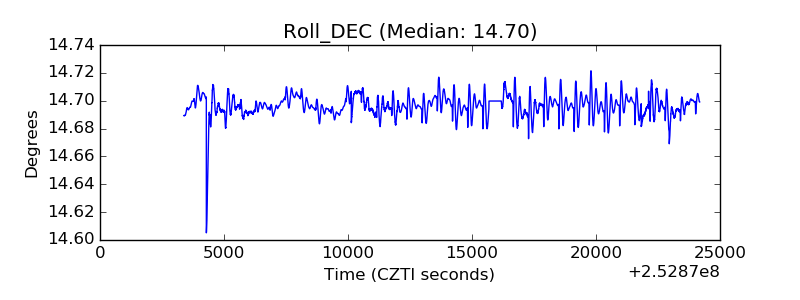 |
| _Roll_RA | 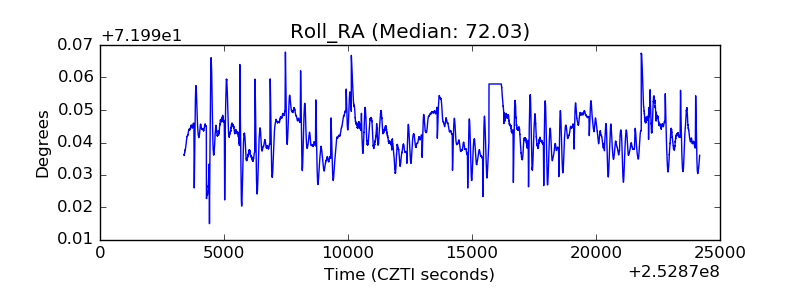 |
| Veto Counter | 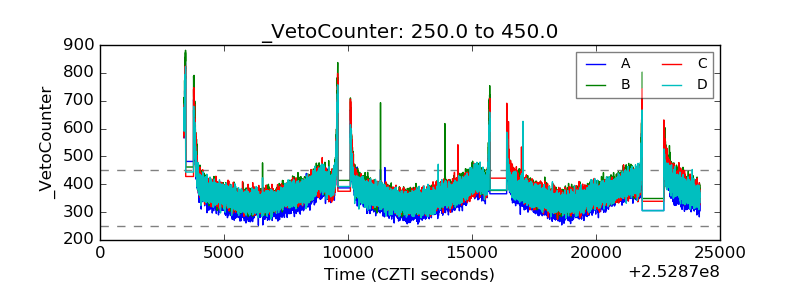 |