| Param | Original file | Final file |
|---|---|---|
| Filename | modeM0/AS1A04_183T02_9000001816_12298cztM0_level2.evt | modeM0/AS1A04_183T02_9000001816_12298cztM0_level2_quad_clean.evt |
| Size (bytes) | 523,537,920 | 82,111,680 |
| Size | 499.3 MB | 78.3 MB |
| Events in quadrant A | 4,420,496 | 493,744 |
| Events in quadrant B | 3,902,624 | 510,120 |
| Events in quadrant C | 3,365,210 | 514,792 |
| Events in quadrant D | 3,704,587 | 492,495 |
| Mode SS | |||
|---|---|---|---|
| Quadrant | BADHDUFLAG | Total packets | Discarded packets |
| A | 0 | 136 | 0 |
| B | 0 | 136 | 0 |
| C | 0 | 136 | 0 |
| D | 0 | 136 | 0 |
| Mode M9 | |||
|---|---|---|---|
| Quadrant | BADHDUFLAG | Total packets | Discarded packets |
| A | 0 | 14 | 0 |
| B | 0 | 14 | 0 |
| C | 0 | 14 | 0 |
| D | 0 | 15 | 0 |
| Mode M0 | |||
|---|---|---|---|
| Quadrant | BADHDUFLAG | Total packets | Discarded packets |
| A | 0 | 17590 | 3 |
| B | 0 | 16038 | 2 |
| C | 0 | 14644 | 2 |
| D | 0 | 15456 | 2 |
| Quadrant | Total seconds | Saturated seconds | Saturation percentage |
|---|---|---|---|
| A | 6824 | 404 | 5.920281% |
| B | 6824 | 178 | 2.608441% |
| C | 6824 | 73 | 1.069754% |
| D | 6824 | 44 | 0.644783% |
Noise dominated data is calculated using 1-second bins in cleaned event files. If a bin has >2000 counts, and if more than 50% of those come from <1% of pixels, then it is considered to be noise-dominated and hence unusable.
| Quadrant | # 1 sec bins | Bins with >0 counts | Bins with >2000 counts | High rate bins dominated by noise | Noise dominated (total time) | Noise dominated (detector-on time) | Marked lightcurve |
|---|---|---|---|---|---|---|---|
| A | 7850 | 6826 | 335 | 335 | 4.27% | 4.91% | 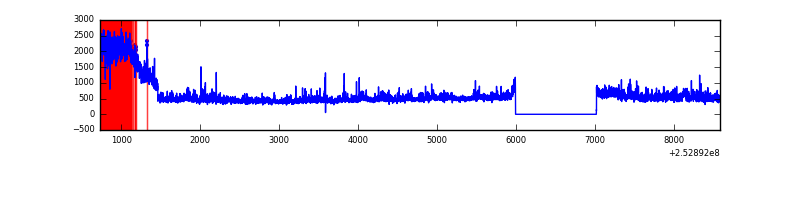 |
| B | 7850 | 6826 | 109 | 109 | 1.39% | 1.60% | 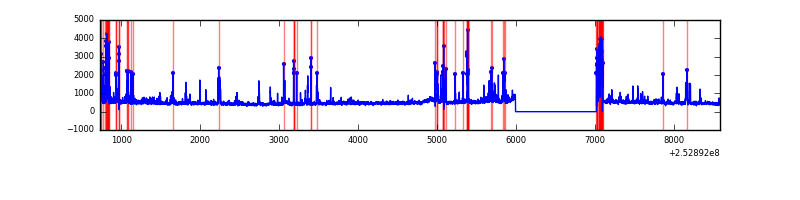 |
| C | 7850 | 6826 | 40 | 40 | 0.51% | 0.59% | 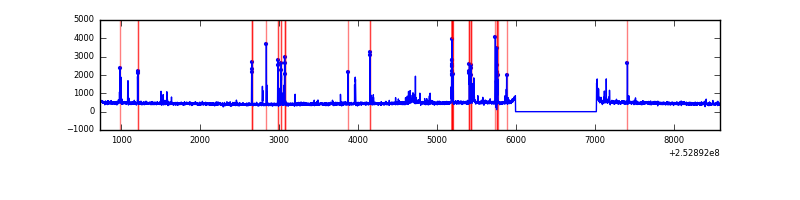 |
| D | 7850 | 6826 | 39 | 39 | 0.50% | 0.57% | 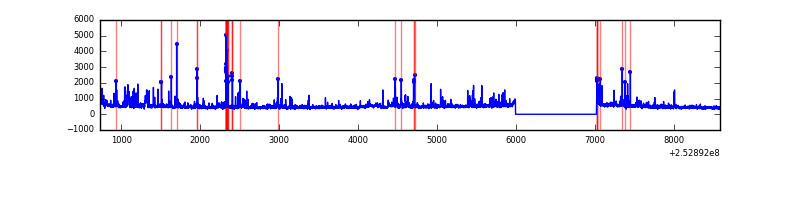 |
Top three noisy pixels from each quadrant. If the there are fewer than three noisy pixels in the level2.evt file, extra rows are filled as -1
| Pixel properties | Quadrant properties | ||||||
|---|---|---|---|---|---|---|---|
| Quadrant | DetID | PixID | Counts | Sigma | Mean | Median | Sigma |
| A | 0 | 23 | 970362 | 6012.84 | 785 | 769 | 161.3 |
| A | 1 | 162 | 133699 | 824.35 | 785 | 769 | 161.3 |
| A | 1 | 178 | 72214 | 443.06 | 785 | 769 | 161.3 |
| B | 4 | 239 | 557961 | 3655.79 | 793 | 773 | 152.4 |
| B | 11 | 51 | 43782 | 282.19 | 793 | 773 | 152.4 |
| B | 0 | 85 | 42748 | 275.4 | 793 | 773 | 152.4 |
| C | 4 | 254 | 142207 | 780.88 | 780 | 785 | 181.1 |
| C | 14 | 234 | 119308 | 654.44 | 780 | 785 | 181.1 |
| C | 15 | 208 | 63354 | 345.48 | 780 | 785 | 181.1 |
| D | 1 | 52 | 244479 | 1301.48 | 774 | 751 | 187.3 |
| D | 11 | 129 | 119287 | 632.97 | 774 | 751 | 187.3 |
| D | 2 | 14 | 82171 | 434.77 | 774 | 751 | 187.3 |
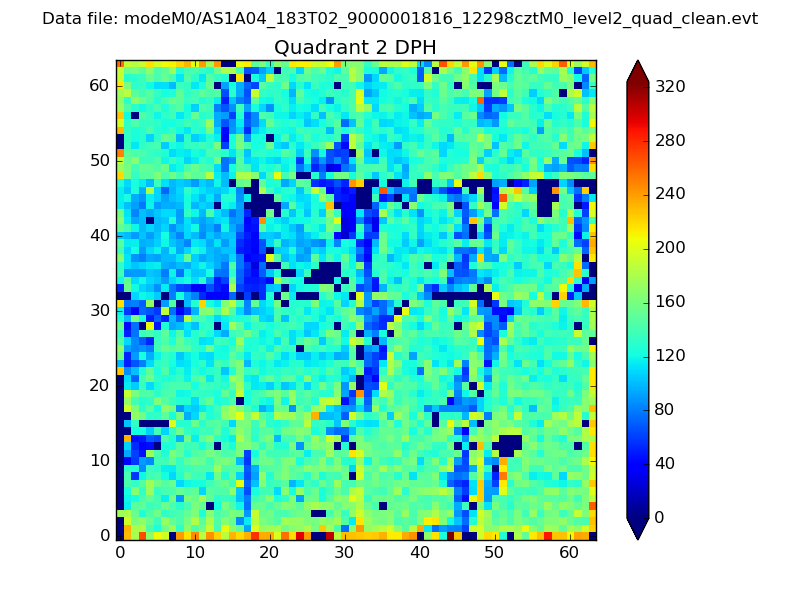
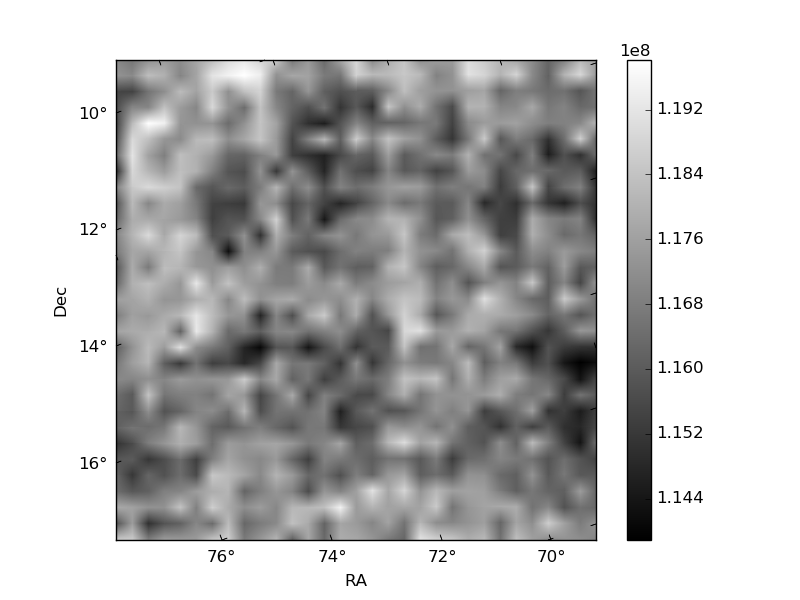
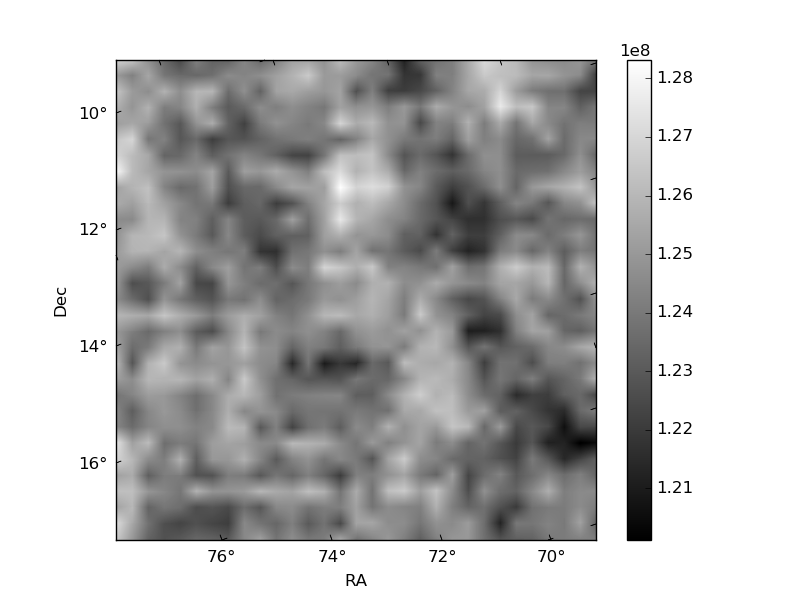
Histogram calculated using DETX and DETY for each event in the final _common_clean file
| Quadrant A | 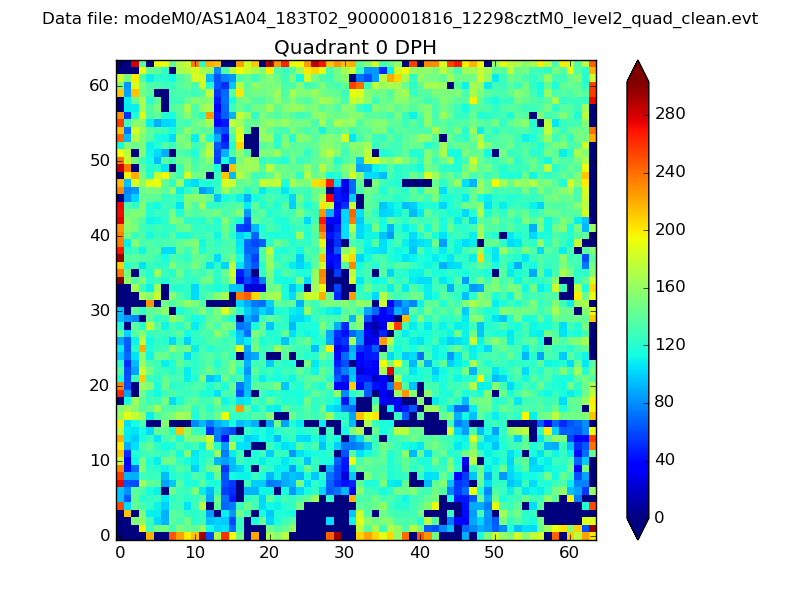 |
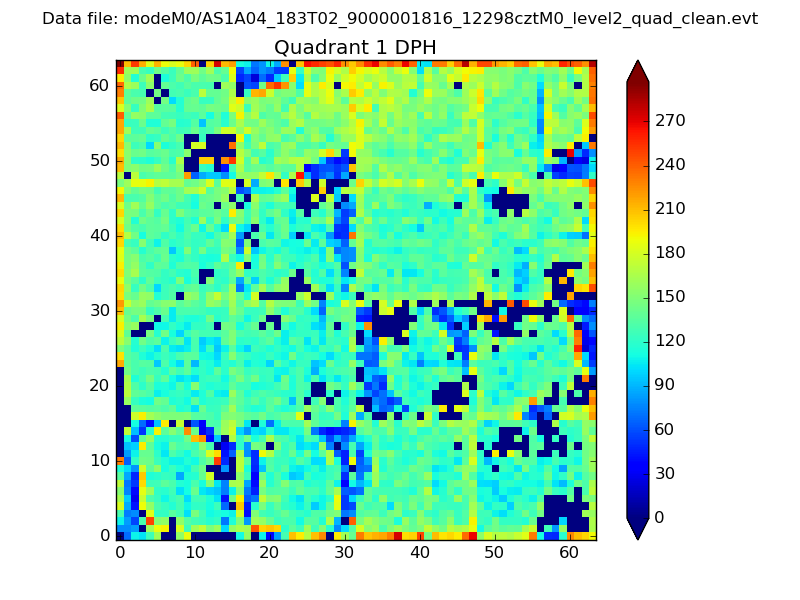 |
Quadrant B |
|---|---|---|---|
| Quadrant D | 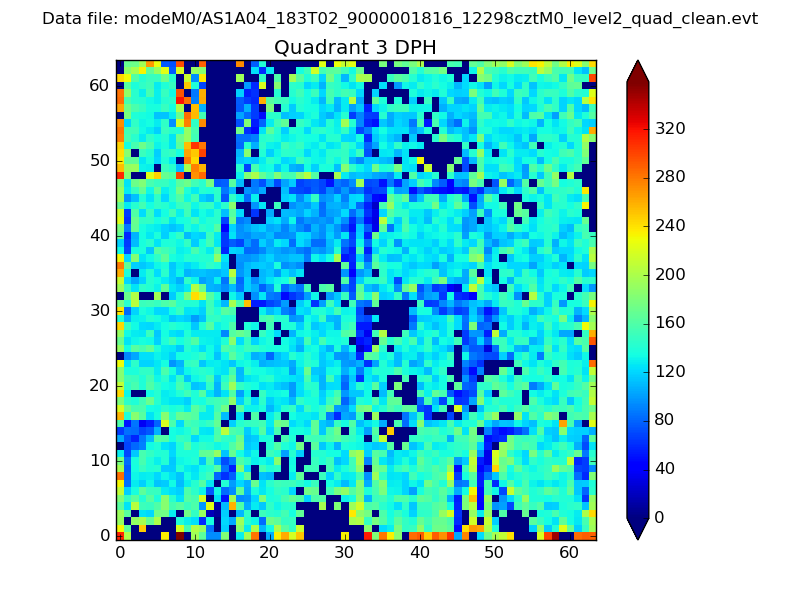 |
 |
Quadrant C |
| Plot type | Count rate plots | Images |
|---|---|---|
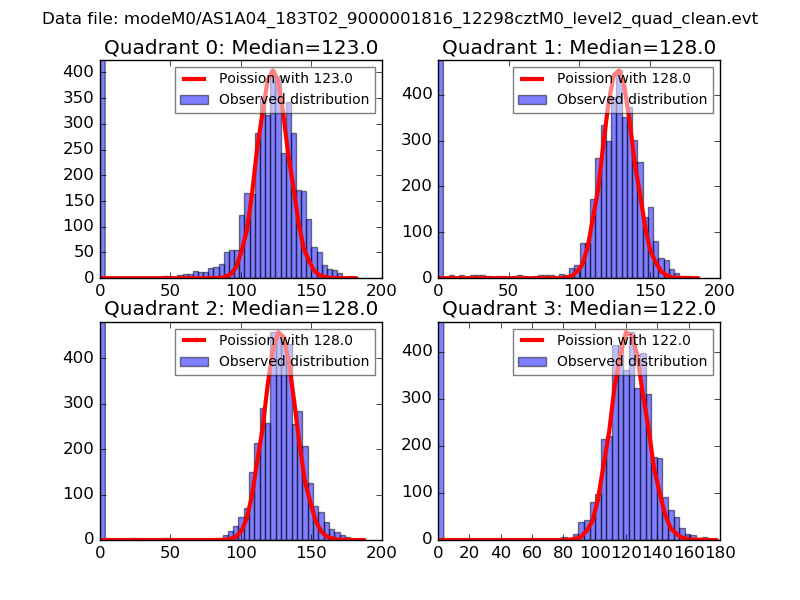
| Comparison with Poisson distribution Blue bars denote a histogram of data divided into 1 sec bins. Red curve is a Poisson curve with rate = median count rate of data. |
 |
 |
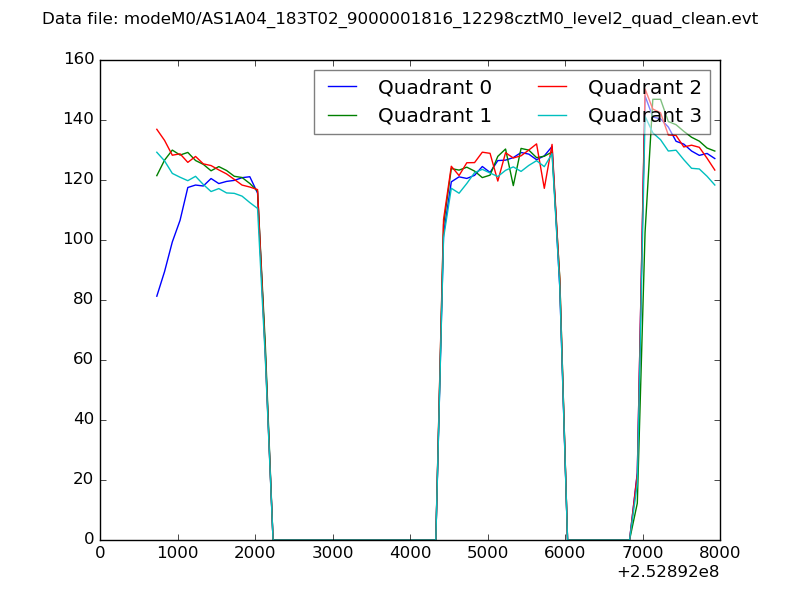
| Quadrant-wise count rates Data is divided into 100 sec bins |
 |
|
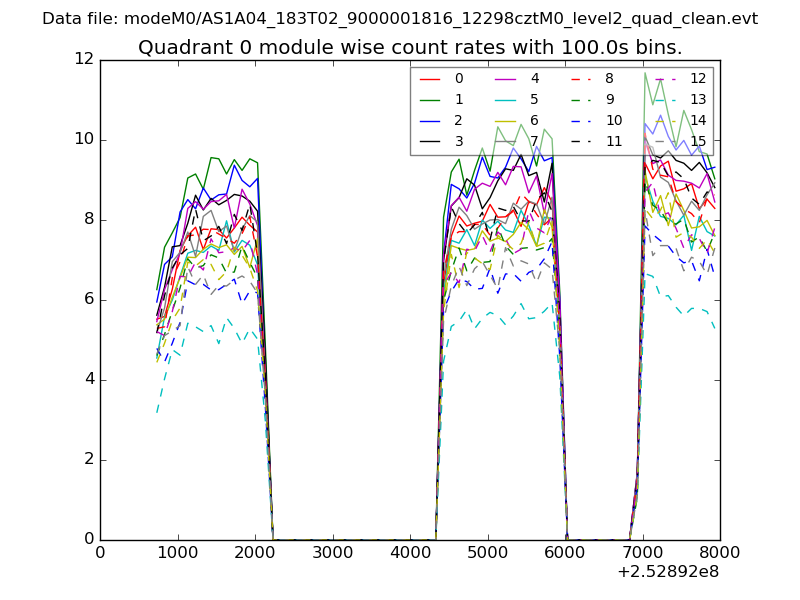
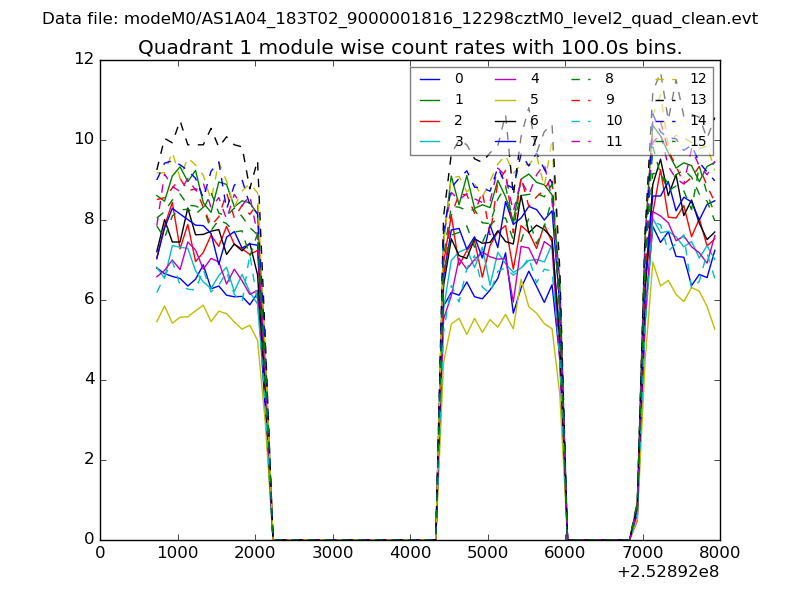
| Module-wise count rates for Quadrant A Data is divided into 100 sec bins |
 |
 |
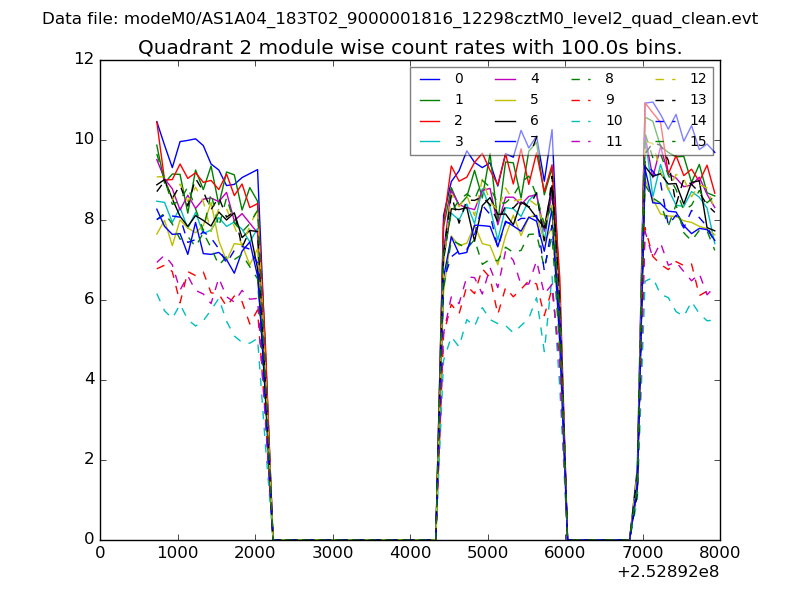
| Module-wise count rates for Quadrant B Data is divided into 100 sec bins |
 |
 |
| Module-wise count rates for Quadrant C Data is divided into 100 sec bins |
 |
 |
| Module-wise count rates for Quadrant D Data is divided into 100 sec bins |
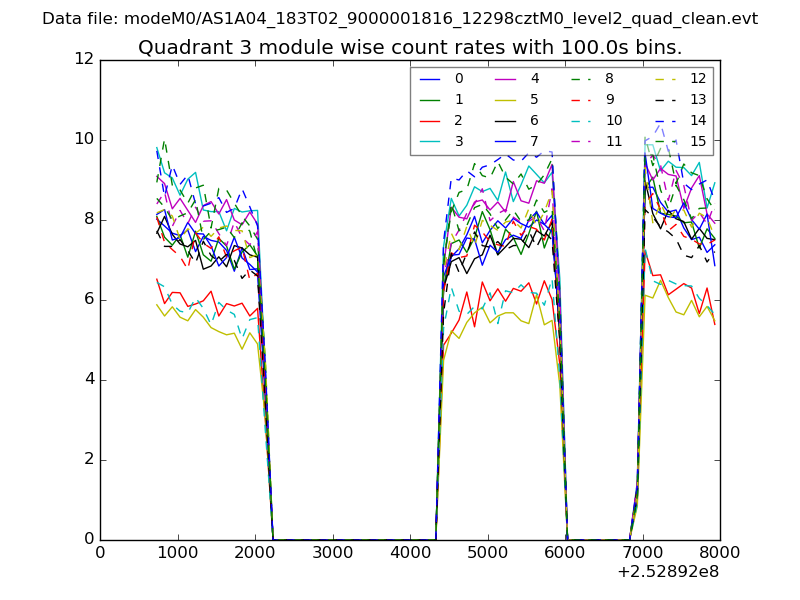 |
 |
| Parameter | Plot |
|---|---|
| CZT HV Monitor | 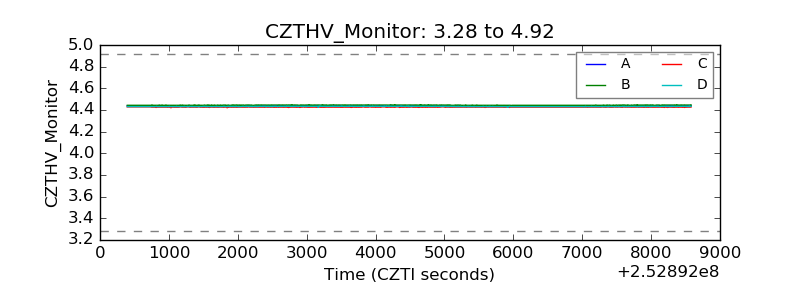 |
| D_VDD | 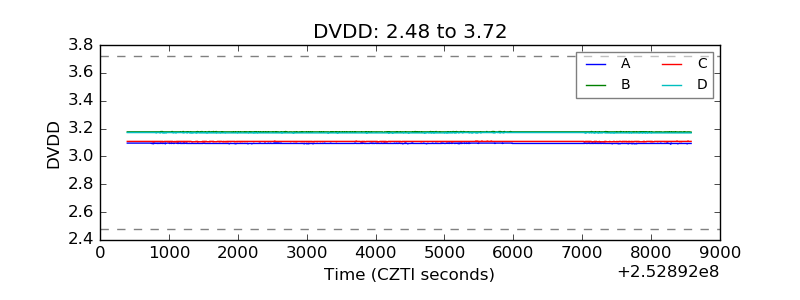 |
| Temperature 1 | 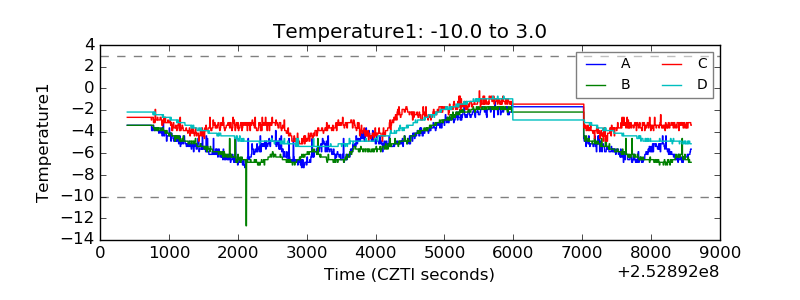 |
| Veto HV Monitor |  |
| Veto LLD | 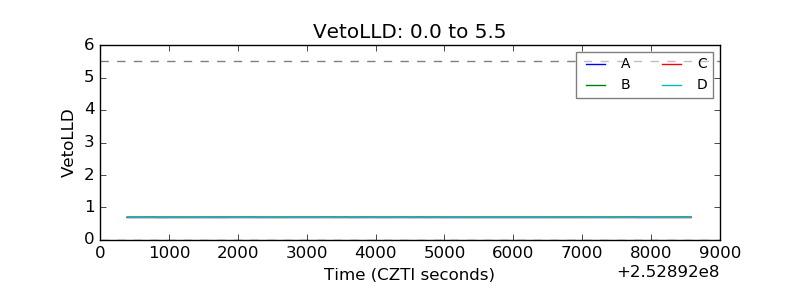 |
| Alpha Counter | 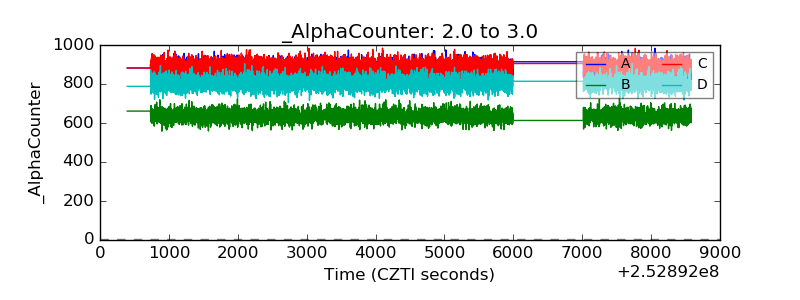 |
| _CPM_Rate | 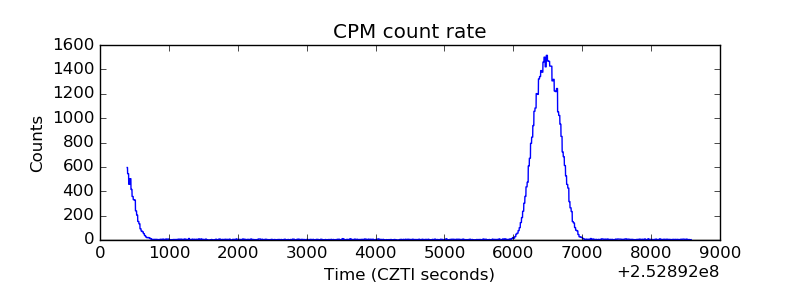 |
| CZT Counter | 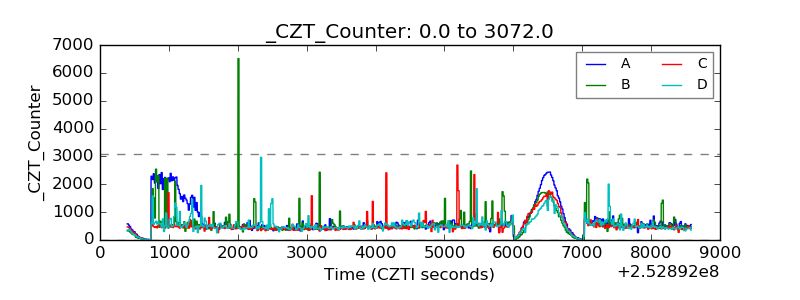 |
| +2.5 Volts monitor |  |
| +5 Volts monitor | 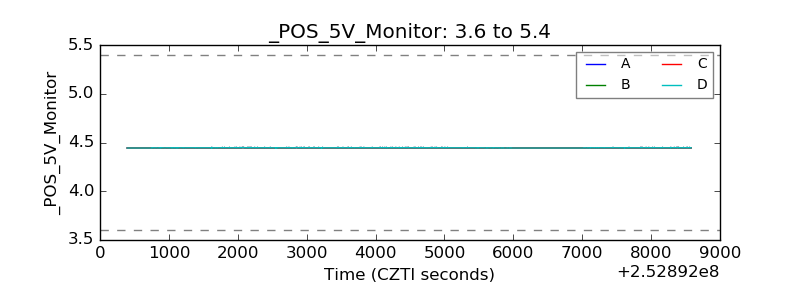 |
| _ROLL_ROT | 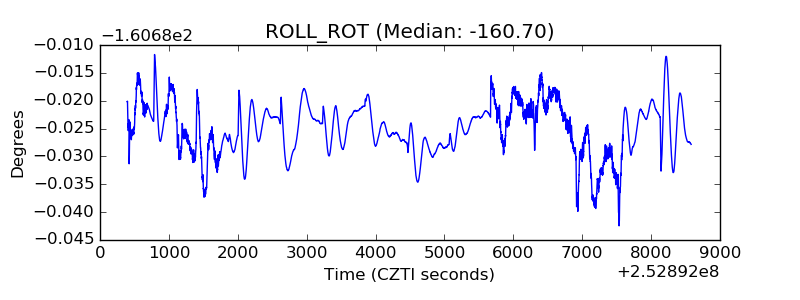 |
| _Roll_DEC | 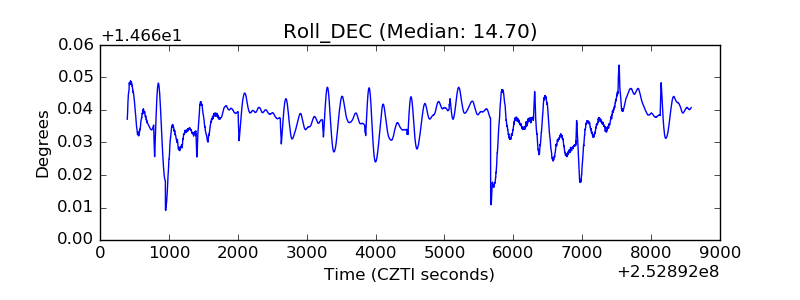 |
| _Roll_RA | 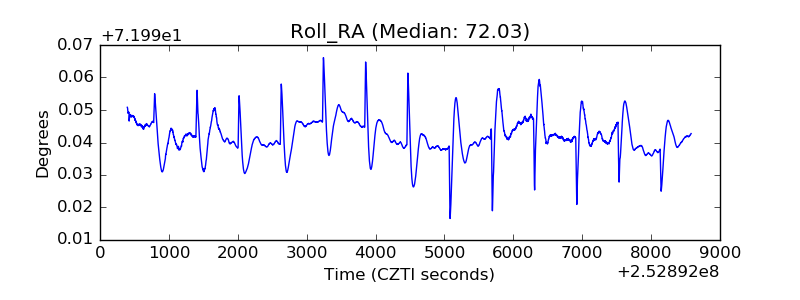 |
| Veto Counter | 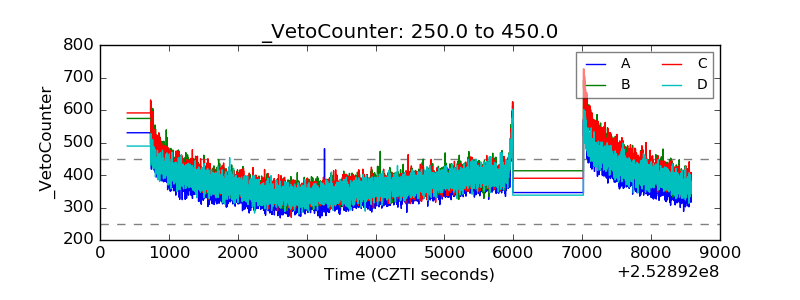 |