| Param | Original file | Final file |
|---|---|---|
| Filename | modeM0/AS1A04_183T02_9000001816_12300cztM0_level2.evt | modeM0/AS1A04_183T02_9000001816_12300cztM0_level2_quad_clean.evt |
| Size (bytes) | 487,422,720 | 68,978,880 |
| Size | 464.8 MB | 65.8 MB |
| Events in quadrant A | 4,522,719 | 402,960 |
| Events in quadrant B | 3,701,923 | 424,833 |
| Events in quadrant C | 3,062,290 | 419,694 |
| Events in quadrant D | 3,047,342 | 401,547 |
| Mode SS | |||
|---|---|---|---|
| Quadrant | BADHDUFLAG | Total packets | Discarded packets |
| A | 0 | 126 | 0 |
| B | 0 | 126 | 0 |
| C | 0 | 126 | 0 |
| D | 0 | 126 | 0 |
| Mode M9 | |||
|---|---|---|---|
| Quadrant | BADHDUFLAG | Total packets | Discarded packets |
| A | 0 | 12 | 0 |
| B | 0 | 12 | 0 |
| C | 0 | 12 | 0 |
| D | 0 | 12 | 0 |
| Mode M0 | |||
|---|---|---|---|
| Quadrant | BADHDUFLAG | Total packets | Discarded packets |
| A | 0 | 17639 | 2 |
| B | 0 | 15047 | 1 |
| C | 0 | 13284 | 1 |
| D | 0 | 13325 | 1 |
| Quadrant | Total seconds | Saturated seconds | Saturation percentage |
|---|---|---|---|
| A | 6302 | 369 | 5.855284% |
| B | 6302 | 148 | 2.348461% |
| C | 6302 | 41 | 0.650587% |
| D | 6302 | 28 | 0.444303% |
Noise dominated data is calculated using 1-second bins in cleaned event files. If a bin has >2000 counts, and if more than 50% of those come from <1% of pixels, then it is considered to be noise-dominated and hence unusable.
| Quadrant | # 1 sec bins | Bins with >0 counts | Bins with >2000 counts | High rate bins dominated by noise | Noise dominated (total time) | Noise dominated (detector-on time) | Marked lightcurve |
|---|---|---|---|---|---|---|---|
| A | 7448 | 6304 | 176 | 176 | 2.36% | 2.79% | 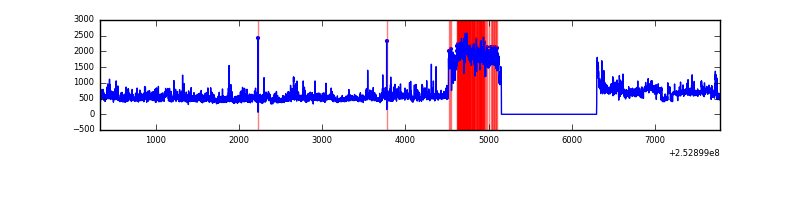 |
| B | 7448 | 6304 | 88 | 88 | 1.18% | 1.40% | 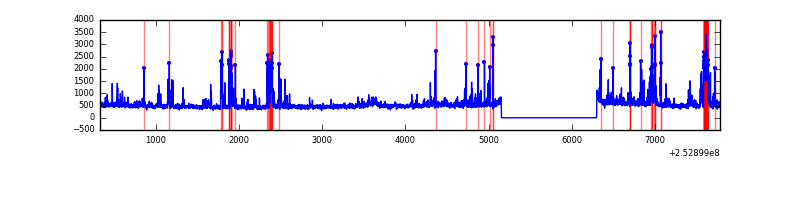 |
| C | 7448 | 6304 | 22 | 22 | 0.30% | 0.35% | 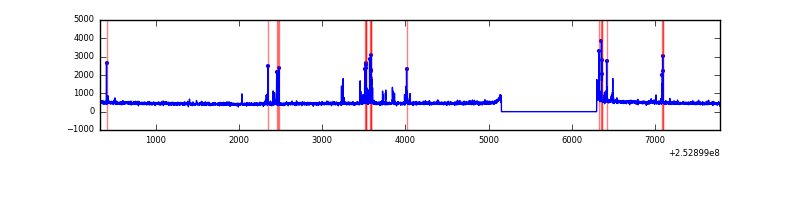 |
| D | 7448 | 6304 | 10 | 10 | 0.13% | 0.16% | 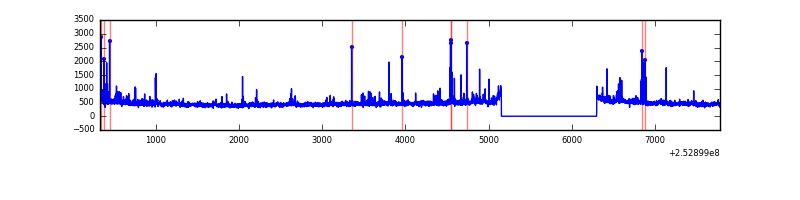 |
Top three noisy pixels from each quadrant. If the there are fewer than three noisy pixels in the level2.evt file, extra rows are filled as -1
| Pixel properties | Quadrant properties | ||||||
|---|---|---|---|---|---|---|---|
| Quadrant | DetID | PixID | Counts | Sigma | Mean | Median | Sigma |
| A | 0 | 23 | 1215314 | 7957.55 | 746 | 732 | 152.6 |
| A | 1 | 162 | 139362 | 908.26 | 746 | 732 | 152.6 |
| A | 0 | 226 | 83194 | 540.26 | 746 | 732 | 152.6 |
| B | 4 | 239 | 533218 | 3708.39 | 757 | 739 | 143.6 |
| B | 3 | 64 | 58550 | 402.62 | 757 | 739 | 143.6 |
| B | 0 | 85 | 40695 | 278.27 | 757 | 739 | 143.6 |
| C | 14 | 234 | 153303 | 886.57 | 739 | 744 | 172.1 |
| C | 15 | 208 | 22390 | 125.79 | 739 | 744 | 172.1 |
| C | 13 | 61 | 5420 | 27.17 | 739 | 744 | 172.1 |
| D | 11 | 129 | 86464 | 483.8 | 731 | 713 | 177.2 |
| D | 13 | 249 | 48752 | 271.03 | 731 | 713 | 177.2 |
| D | 2 | 234 | 30597 | 168.6 | 731 | 713 | 177.2 |
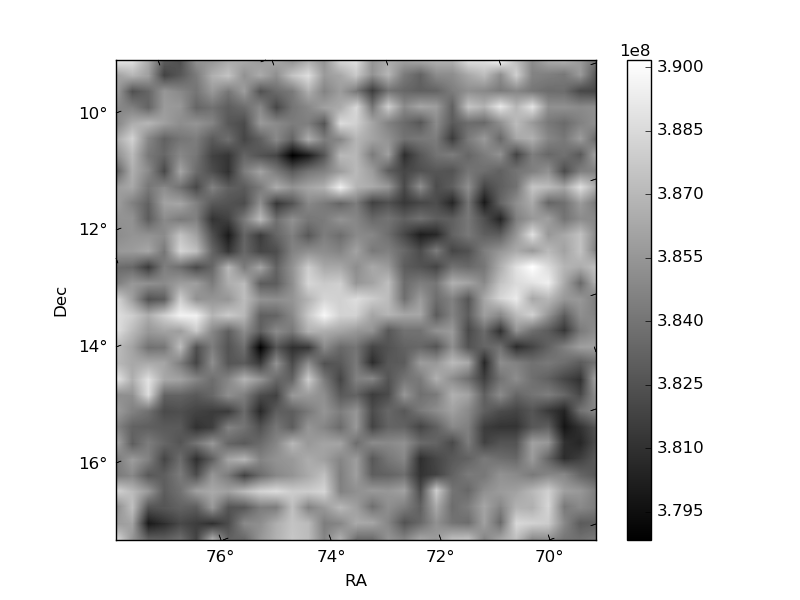
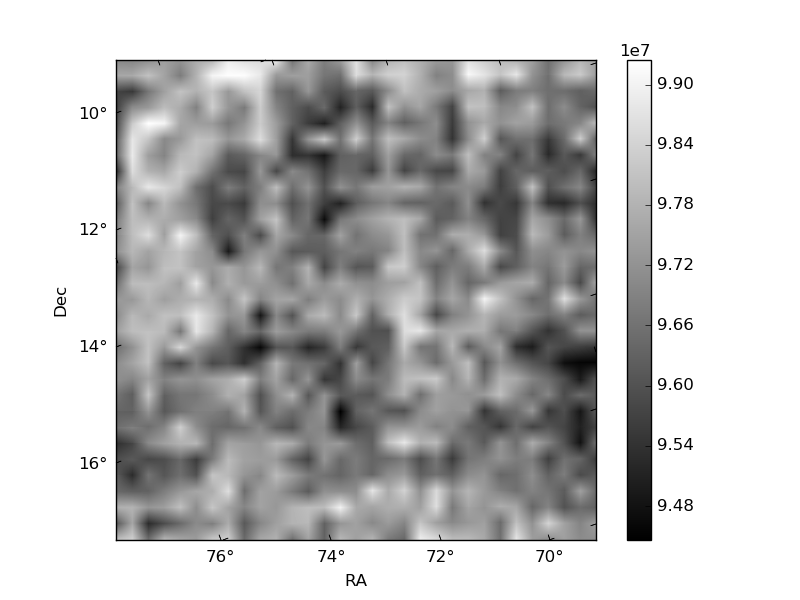
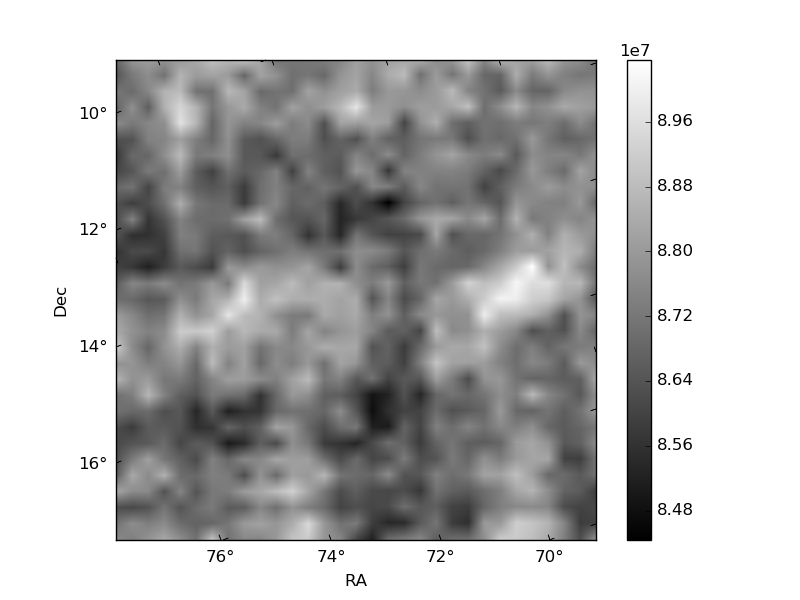
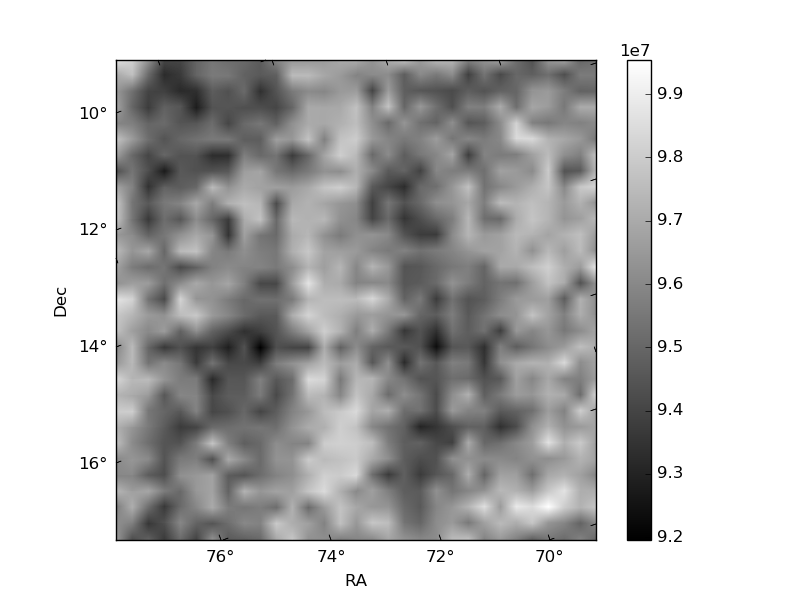
Histogram calculated using DETX and DETY for each event in the final _common_clean file
| Quadrant A | 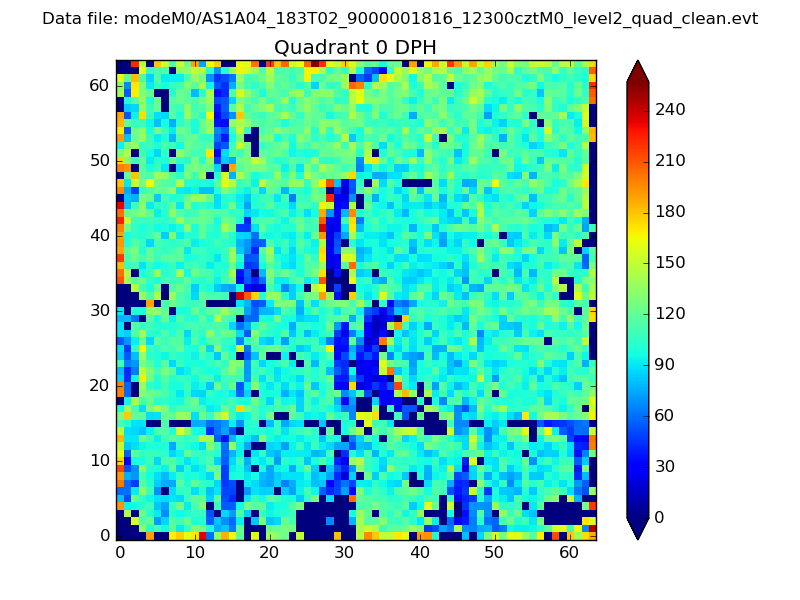 |
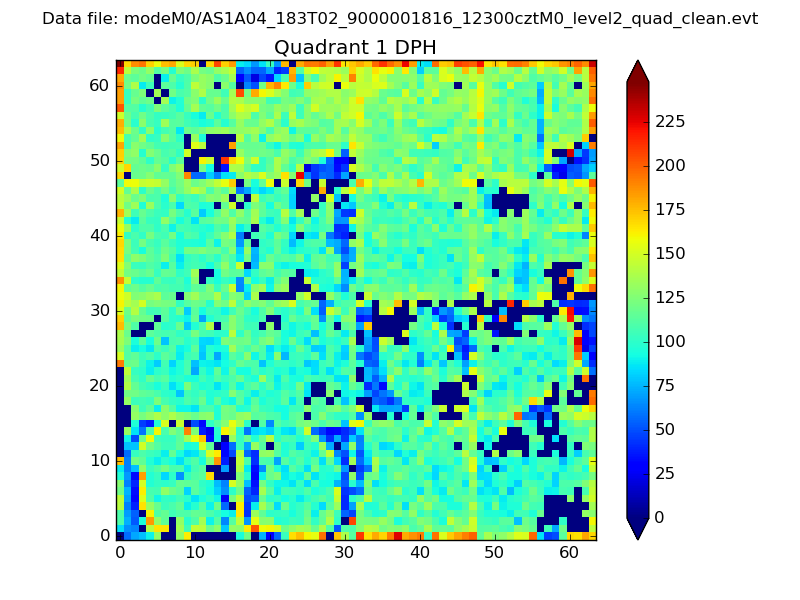 |
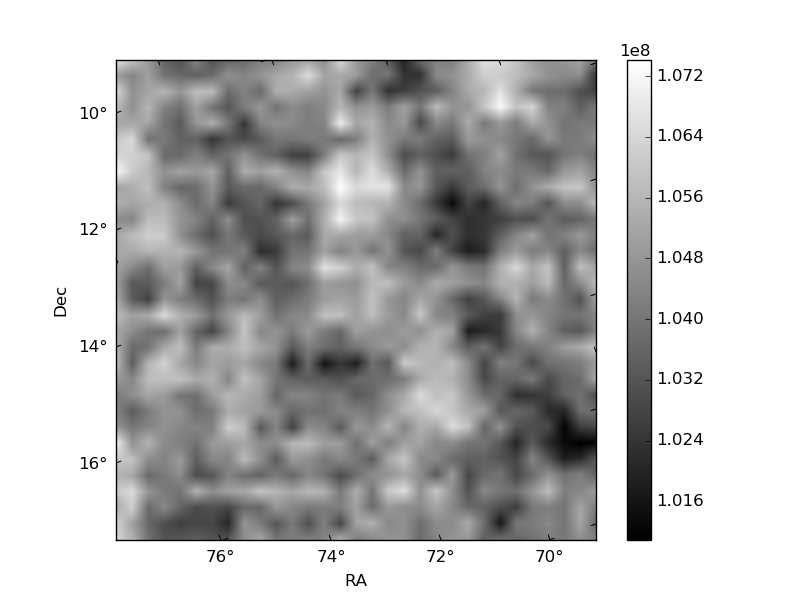
Quadrant B |
|---|---|---|---|
| Quadrant D | 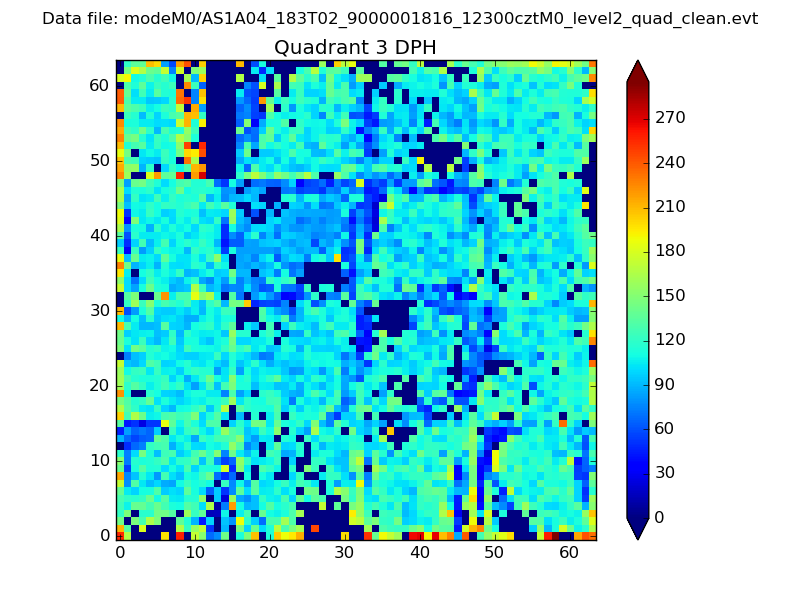 |
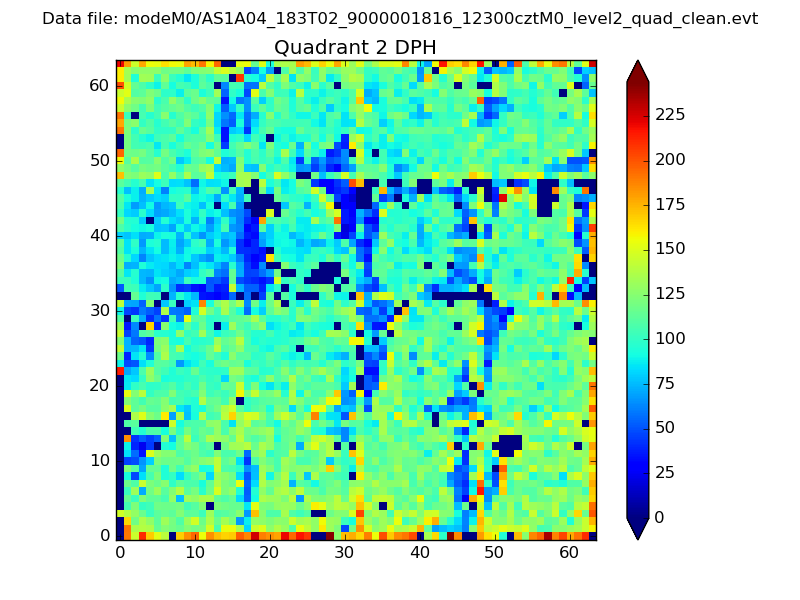 |
Quadrant C |
| Plot type | Count rate plots | Images |
|---|---|---|
| Comparison with Poisson distribution Blue bars denote a histogram of data divided into 1 sec bins. Red curve is a Poisson curve with rate = median count rate of data. |
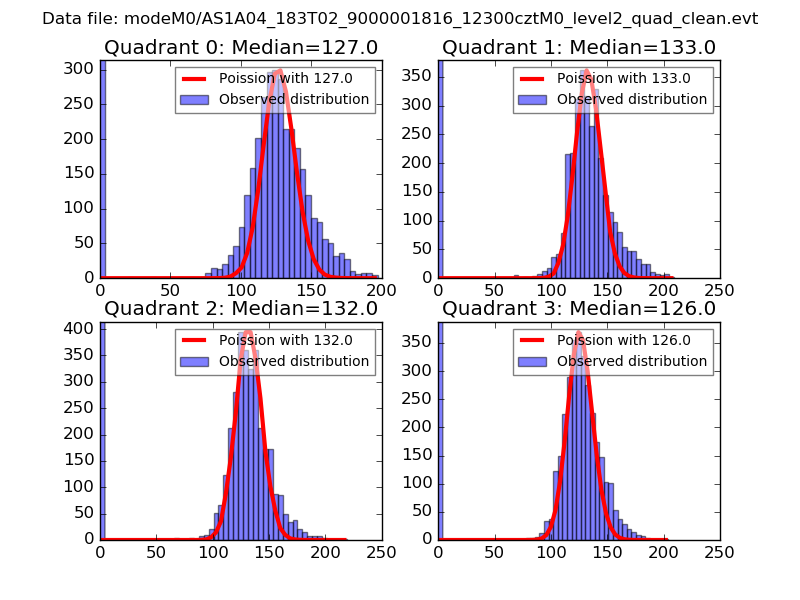 |
 |
| Quadrant-wise count rates Data is divided into 100 sec bins |
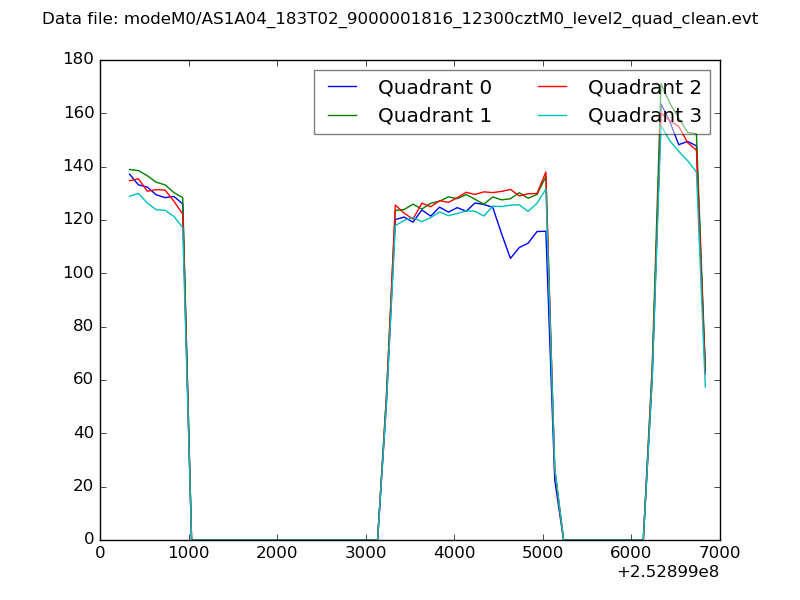 |
|
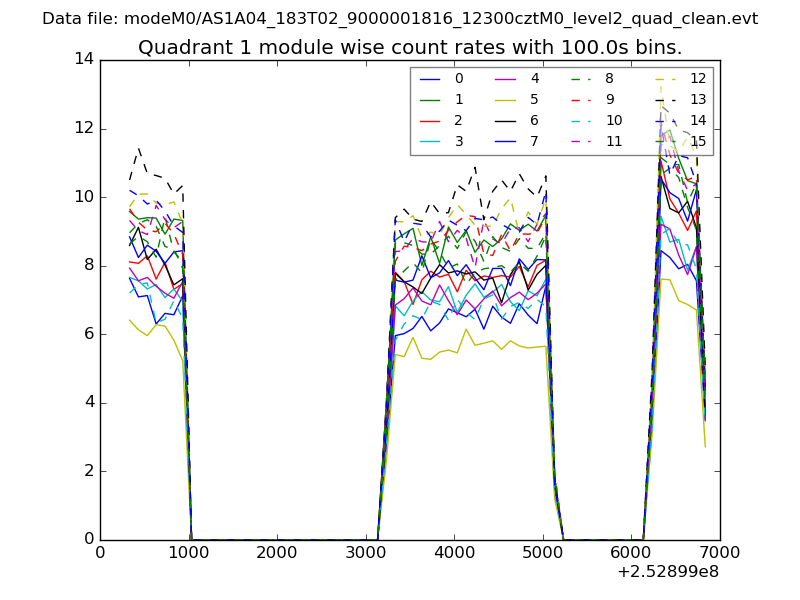
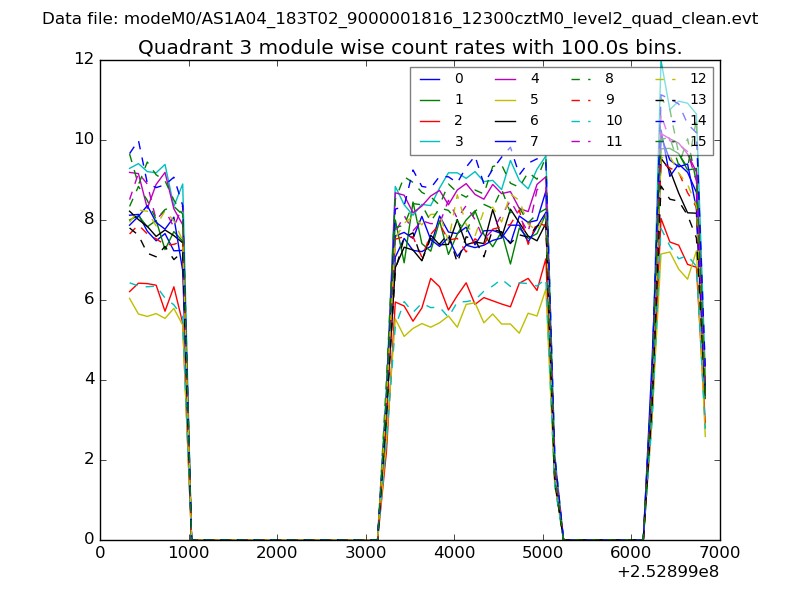
| Module-wise count rates for Quadrant A Data is divided into 100 sec bins |
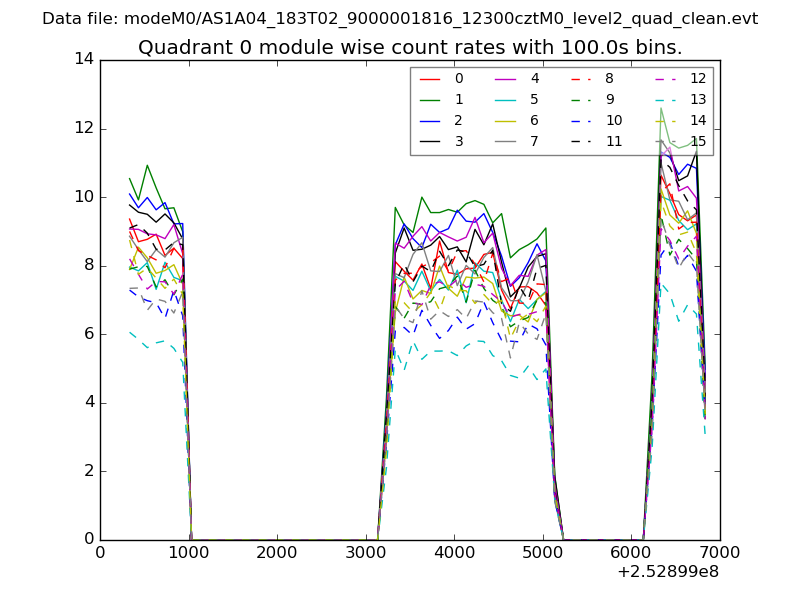 |
 |
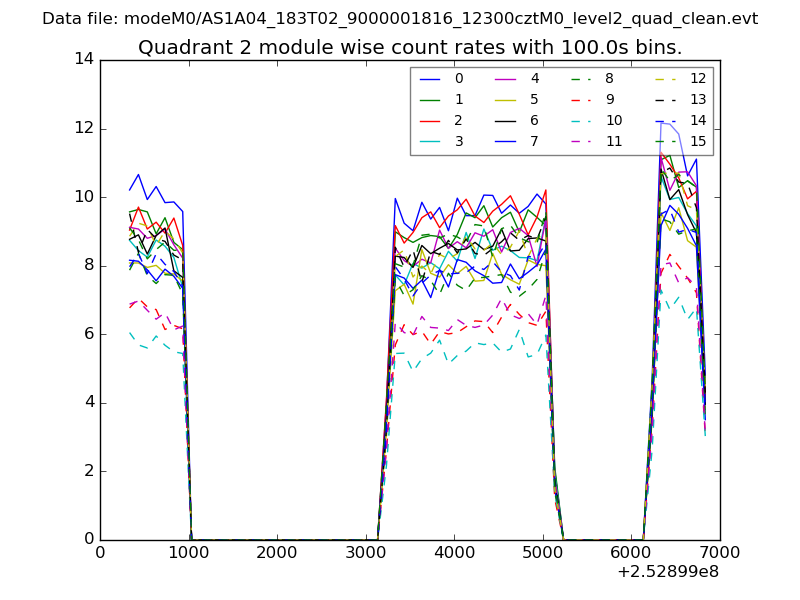
| Module-wise count rates for Quadrant B Data is divided into 100 sec bins |
 |
 |
| Module-wise count rates for Quadrant C Data is divided into 100 sec bins |
 |
 |
| Module-wise count rates for Quadrant D Data is divided into 100 sec bins |
 |
 |
| Parameter | Plot |
|---|---|
| CZT HV Monitor | 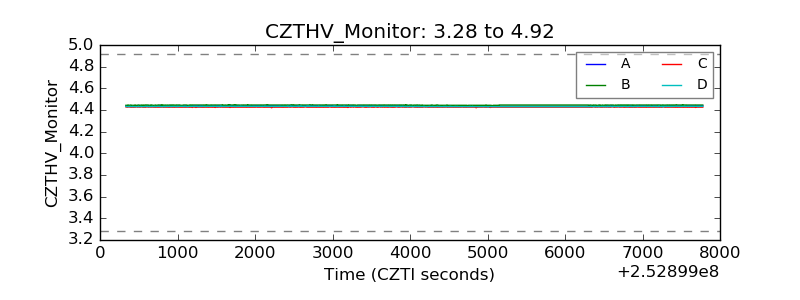 |
| D_VDD | 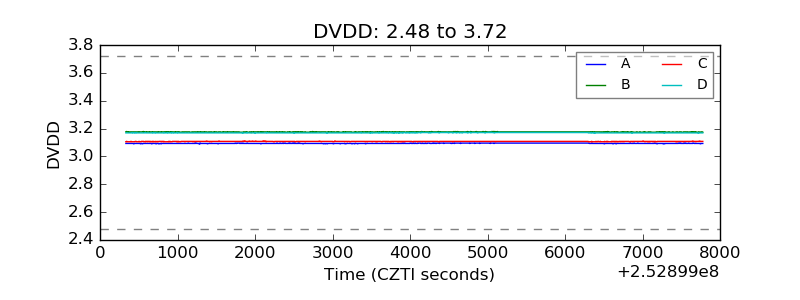 |
| Temperature 1 | 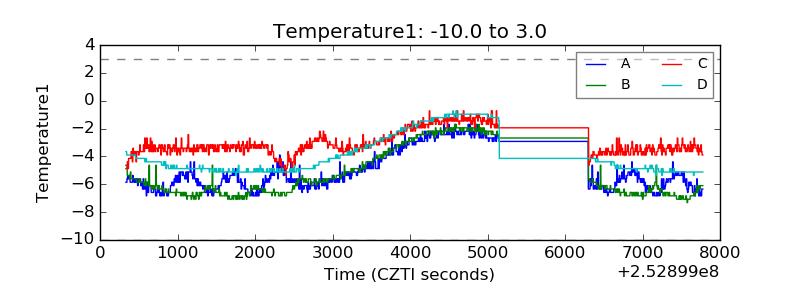 |
| Veto HV Monitor | 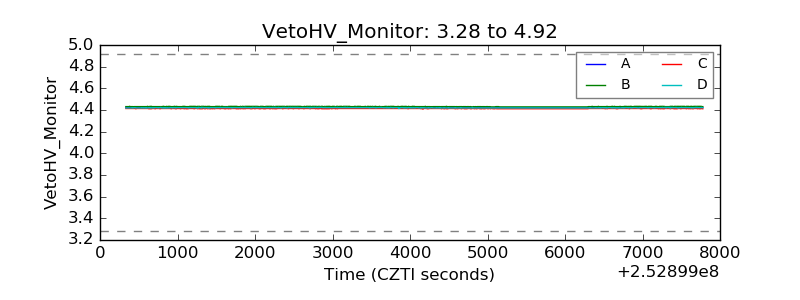 |
| Veto LLD | 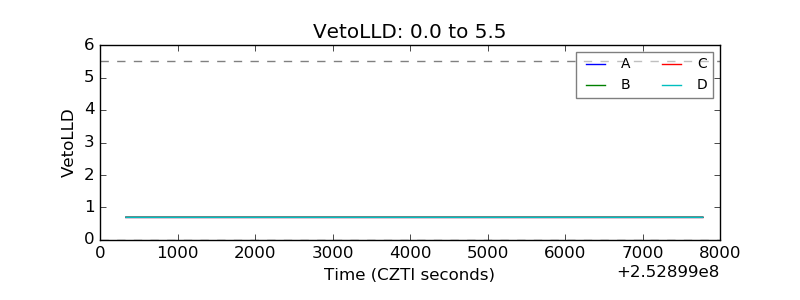 |
| Alpha Counter | 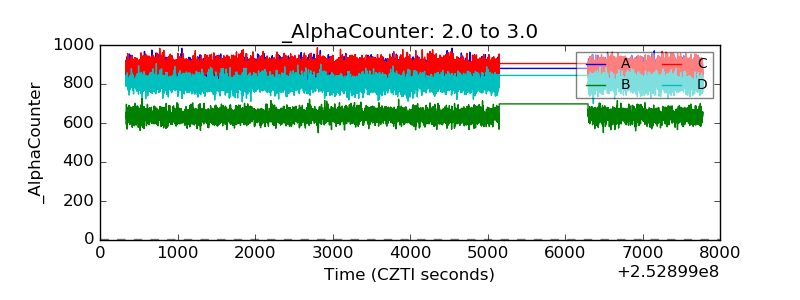 |
| _CPM_Rate | 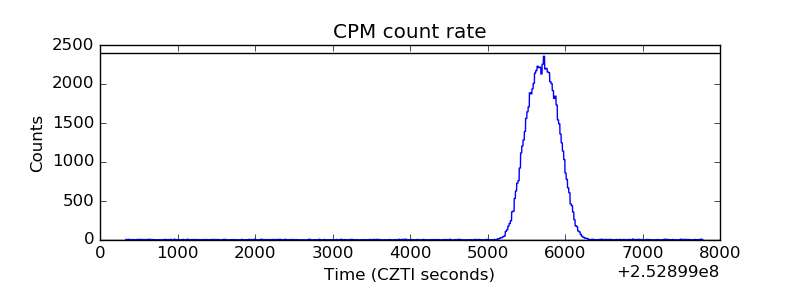 |
| CZT Counter | 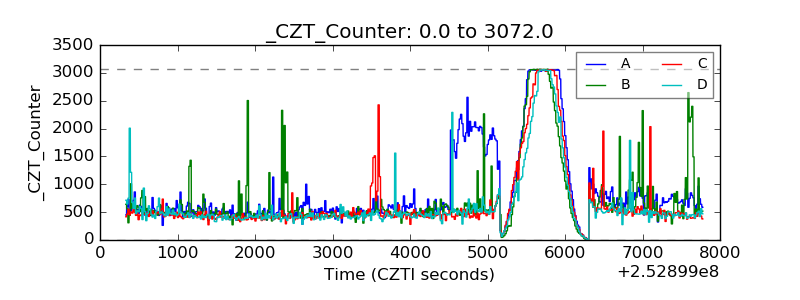 |
| +2.5 Volts monitor |  |
| +5 Volts monitor |  |
| _ROLL_ROT | 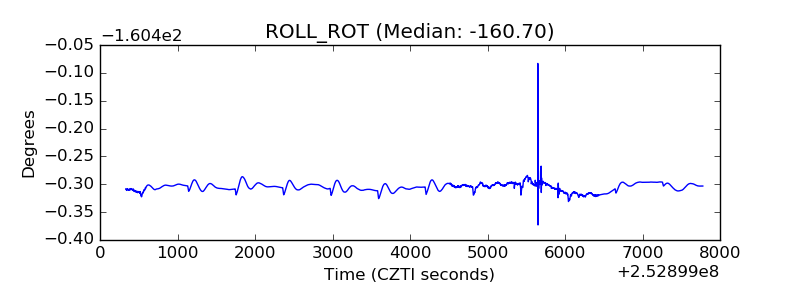 |
| _Roll_DEC | 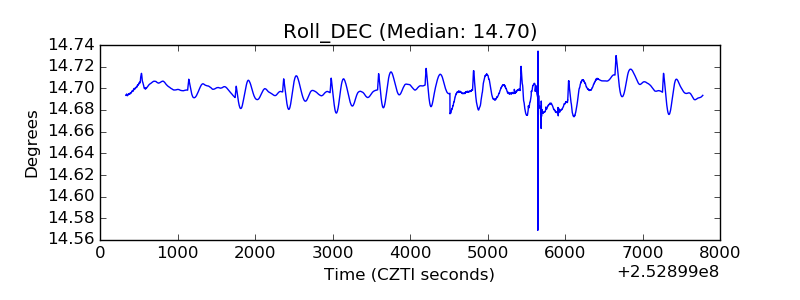 |
| _Roll_RA | 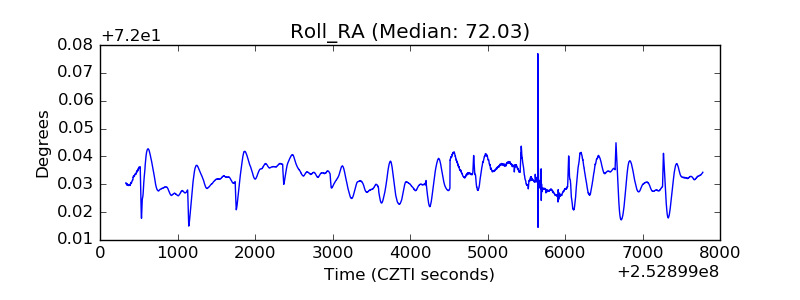 |
| Veto Counter | 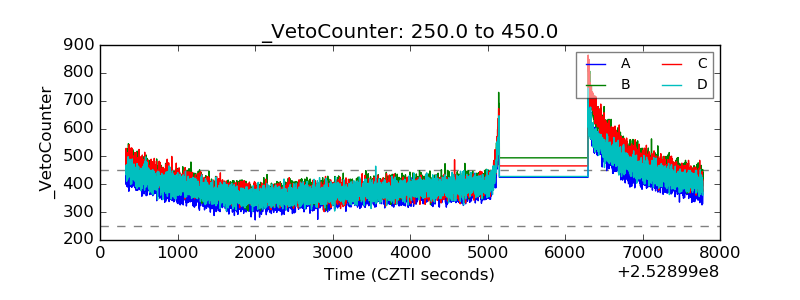 |