| Param | Original file | Final file |
|---|---|---|
| Filename | modeM0/AS1A04_183T02_9000001816_12301cztM0_level2.evt | modeM0/AS1A04_183T02_9000001816_12301cztM0_level2_quad_clean.evt |
| Size (bytes) | 557,570,880 | 67,072,320 |
| Size | 531.7 MB | 64.0 MB |
| Events in quadrant A | 5,264,741 | 384,952 |
| Events in quadrant B | 4,792,134 | 407,877 |
| Events in quadrant C | 3,177,630 | 407,441 |
| Events in quadrant D | 3,220,053 | 385,967 |
| Mode SS | |||
|---|---|---|---|
| Quadrant | BADHDUFLAG | Total packets | Discarded packets |
| A | 0 | 130 | 0 |
| B | 0 | 130 | 0 |
| C | 0 | 130 | 0 |
| D | 0 | 130 | 0 |
| Mode M9 | |||
|---|---|---|---|
| Quadrant | BADHDUFLAG | Total packets | Discarded packets |
| A | 0 | 19 | 0 |
| B | 0 | 19 | 0 |
| C | 0 | 19 | 0 |
| D | 0 | 20 | 0 |
| Mode M0 | |||
|---|---|---|---|
| Quadrant | BADHDUFLAG | Total packets | Discarded packets |
| A | 0 | 19982 | 3 |
| B | 0 | 18375 | 2 |
| C | 0 | 13474 | 2 |
| D | 0 | 13733 | 2 |
| Quadrant | Total seconds | Saturated seconds | Saturation percentage |
|---|---|---|---|
| A | 6368 | 334 | 5.244975% |
| B | 6368 | 424 | 6.658291% |
| C | 6368 | 49 | 0.769472% |
| D | 6368 | 35 | 0.549623% |
Noise dominated data is calculated using 1-second bins in cleaned event files. If a bin has >2000 counts, and if more than 50% of those come from <1% of pixels, then it is considered to be noise-dominated and hence unusable.
| Quadrant | # 1 sec bins | Bins with >0 counts | Bins with >2000 counts | High rate bins dominated by noise | Noise dominated (total time) | Noise dominated (detector-on time) | Marked lightcurve |
|---|---|---|---|---|---|---|---|
| A | 7599 | 6369 | 75 | 75 | 0.99% | 1.18% | 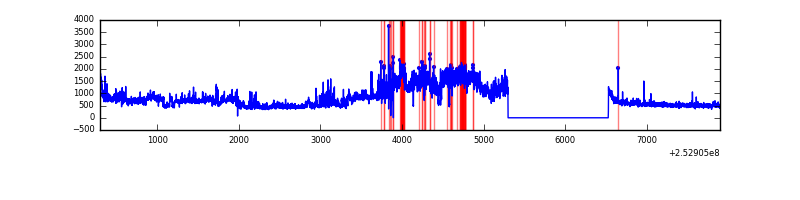 |
| B | 7599 | 6370 | 257 | 257 | 3.38% | 4.03% | 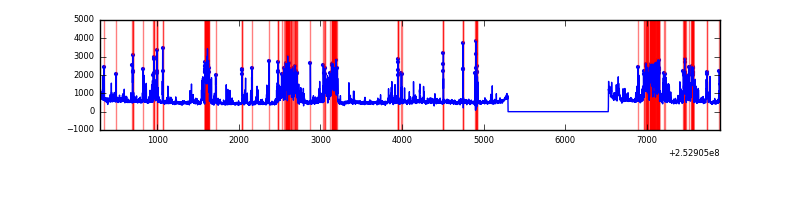 |
| C | 7599 | 6370 | 17 | 17 | 0.22% | 0.27% | 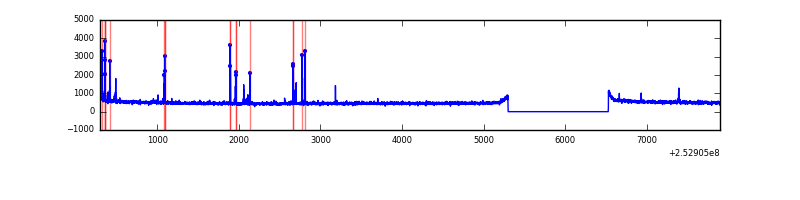 |
| D | 7599 | 6370 | 15 | 15 | 0.20% | 0.24% | 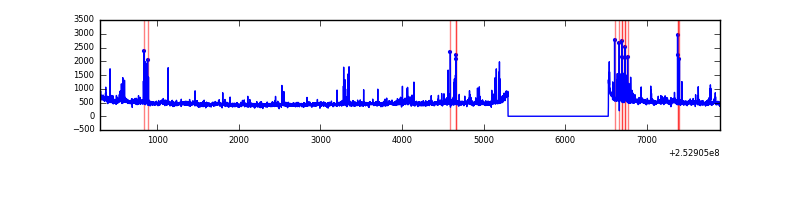 |
Top three noisy pixels from each quadrant. If the there are fewer than three noisy pixels in the level2.evt file, extra rows are filled as -1
| Pixel properties | Quadrant properties | ||||||
|---|---|---|---|---|---|---|---|
| Quadrant | DetID | PixID | Counts | Sigma | Mean | Median | Sigma |
| A | 0 | 23 | 1690856 | 10563.72 | 794 | 779 | 160.0 |
| A | 1 | 162 | 154688 | 962.0 | 794 | 779 | 160.0 |
| A | 0 | 226 | 116002 | 720.19 | 794 | 779 | 160.0 |
| B | 4 | 239 | 1511160 | 10012.6 | 797 | 778 | 150.8 |
| B | 0 | 85 | 48200 | 314.37 | 797 | 778 | 150.8 |
| B | 3 | 64 | 41061 | 267.04 | 797 | 778 | 150.8 |
| C | 14 | 234 | 82824 | 452.44 | 784 | 790 | 181.3 |
| C | 15 | 208 | 28022 | 150.19 | 784 | 790 | 181.3 |
| C | 13 | 61 | 5925 | 28.32 | 784 | 790 | 181.3 |
| D | 11 | 129 | 77115 | 412.99 | 773 | 752 | 184.9 |
| D | 13 | 104 | 46408 | 246.92 | 773 | 752 | 184.9 |
| D | 8 | 195 | 39070 | 207.23 | 773 | 752 | 184.9 |
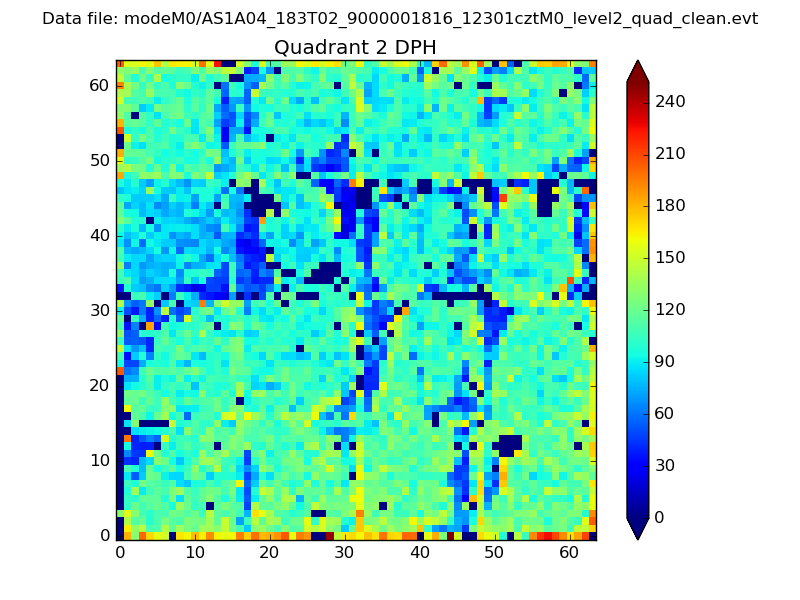
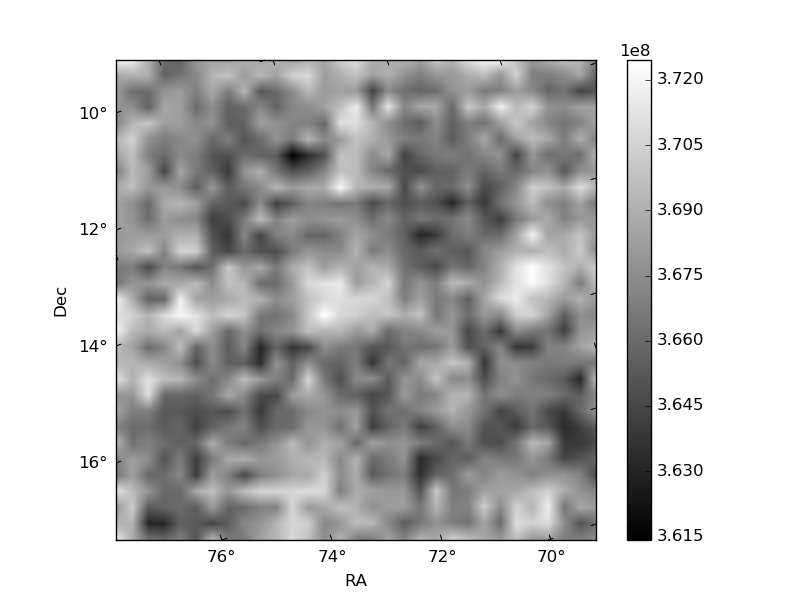
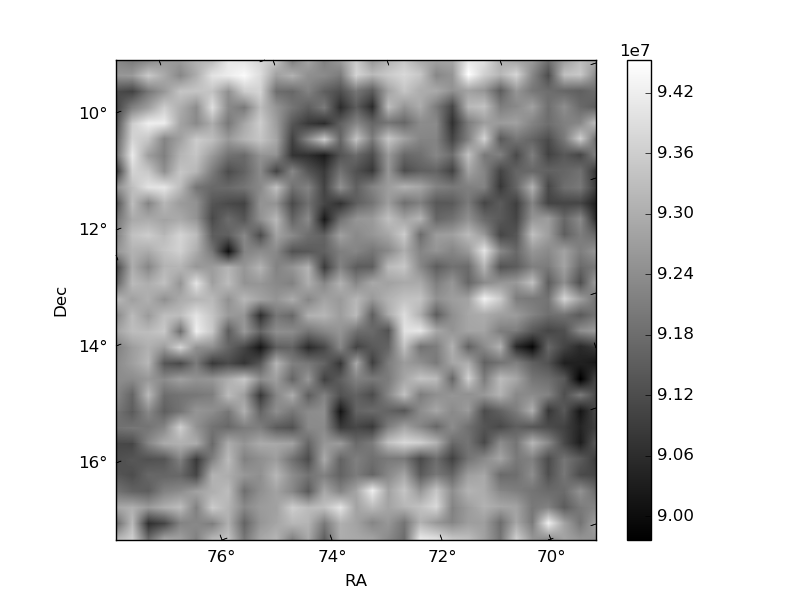
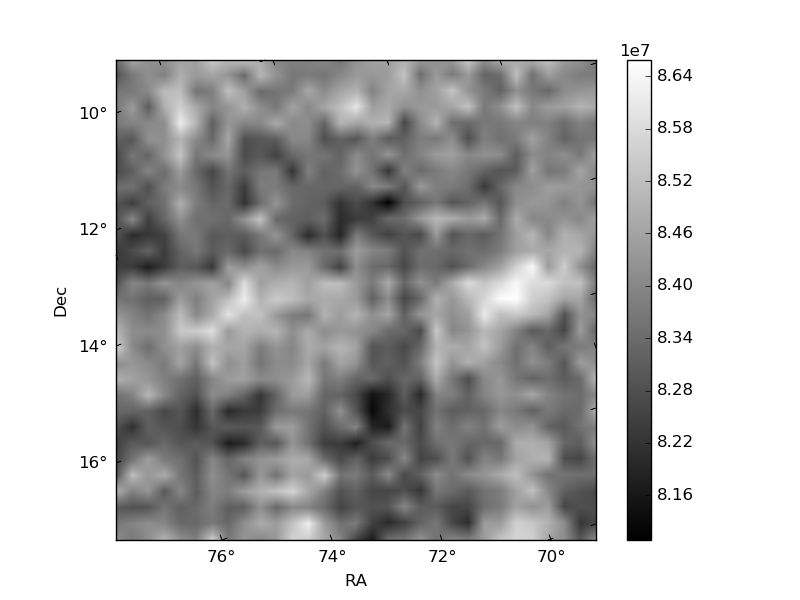
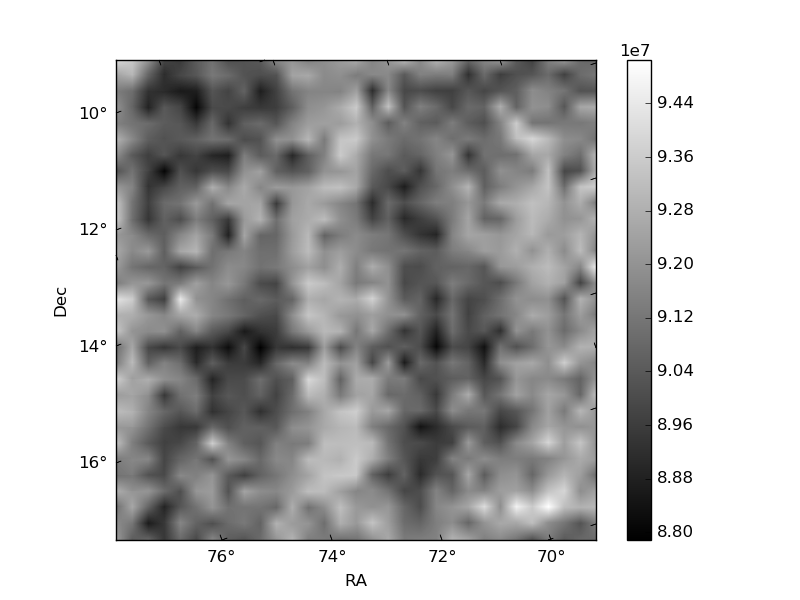
Histogram calculated using DETX and DETY for each event in the final _common_clean file
| Quadrant A | 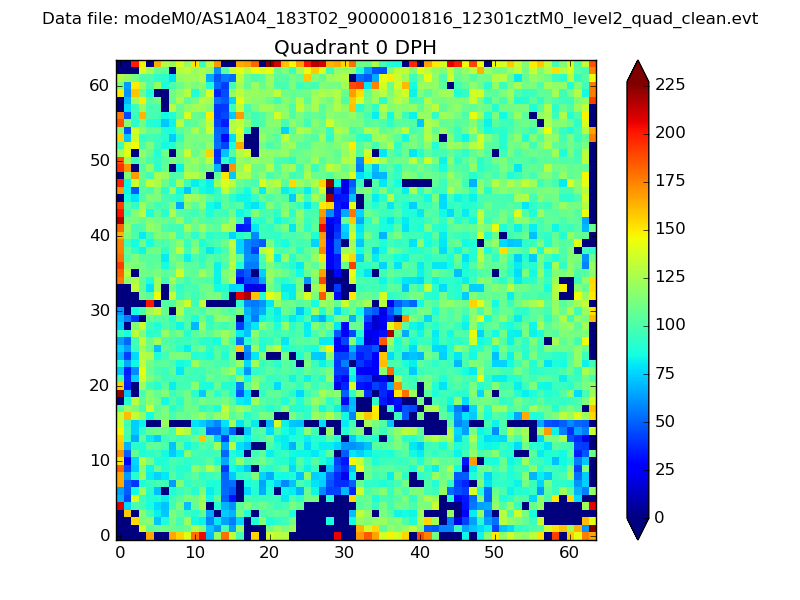 |
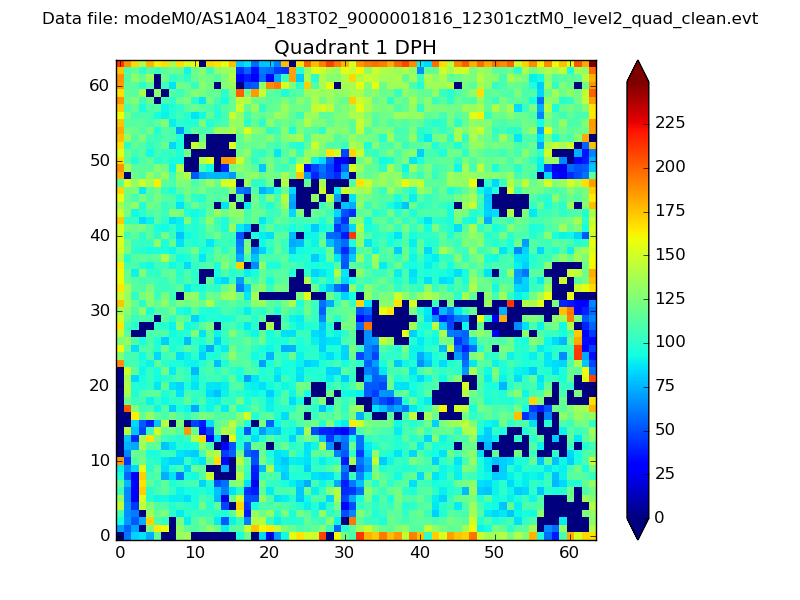 |
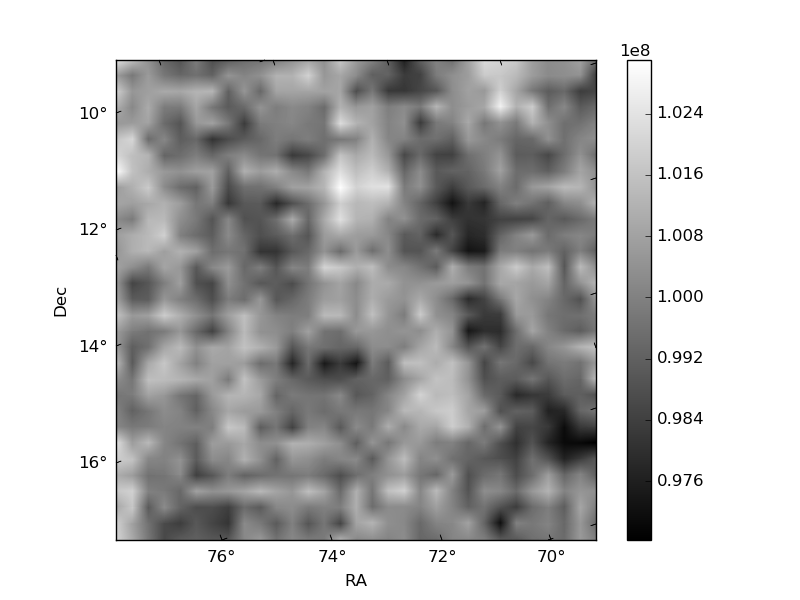
Quadrant B |
|---|---|---|---|
| Quadrant D | 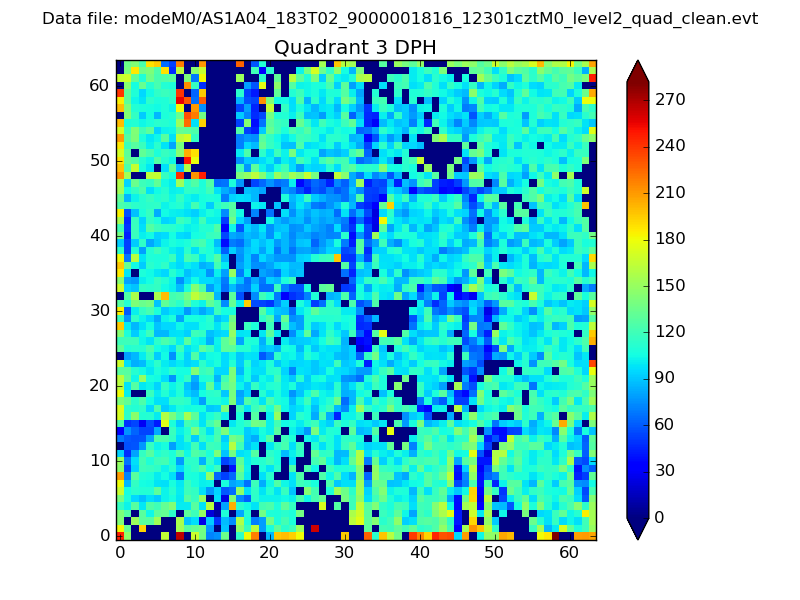 |
 |
Quadrant C |
| Plot type | Count rate plots | Images |
|---|---|---|
| Comparison with Poisson distribution Blue bars denote a histogram of data divided into 1 sec bins. Red curve is a Poisson curve with rate = median count rate of data. |
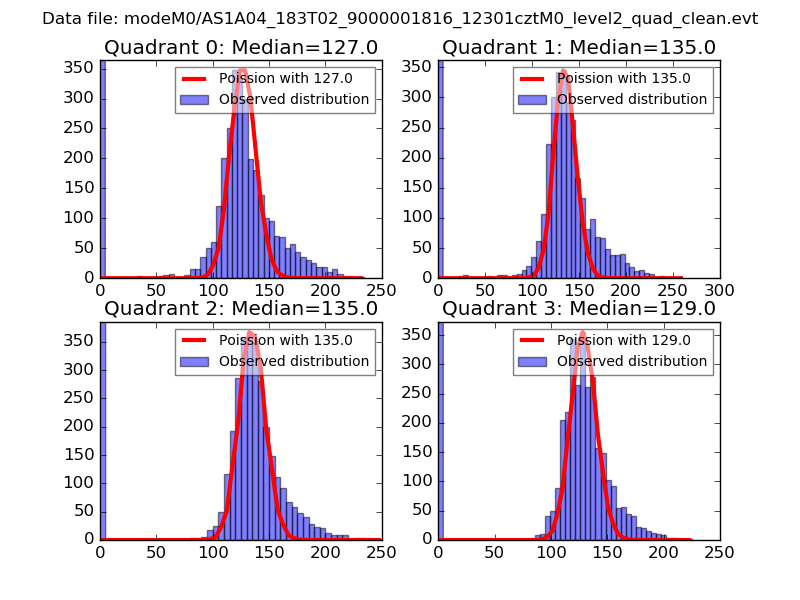 |
 |
| Quadrant-wise count rates Data is divided into 100 sec bins |
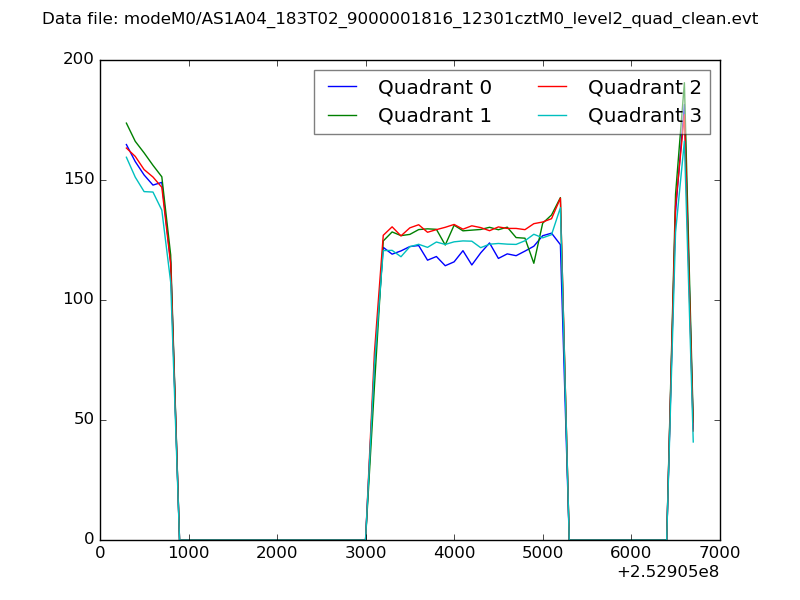 |
|
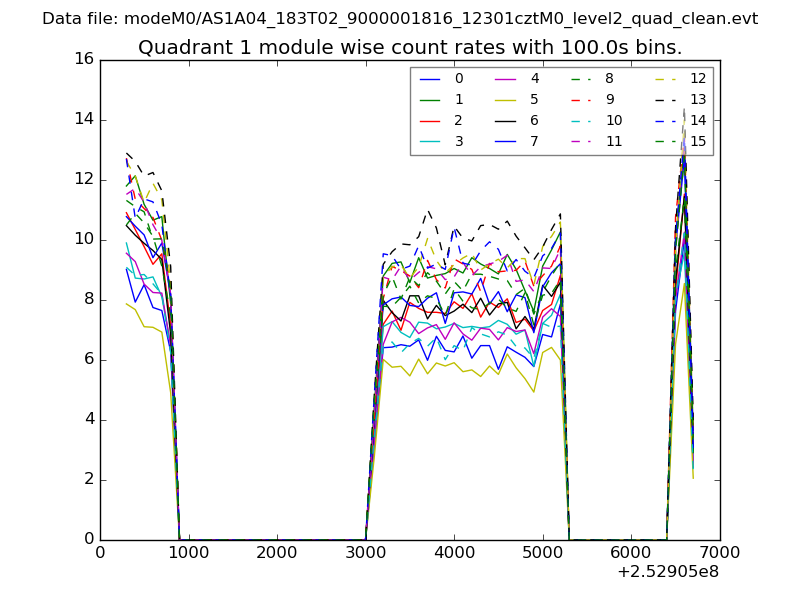
| Module-wise count rates for Quadrant A Data is divided into 100 sec bins |
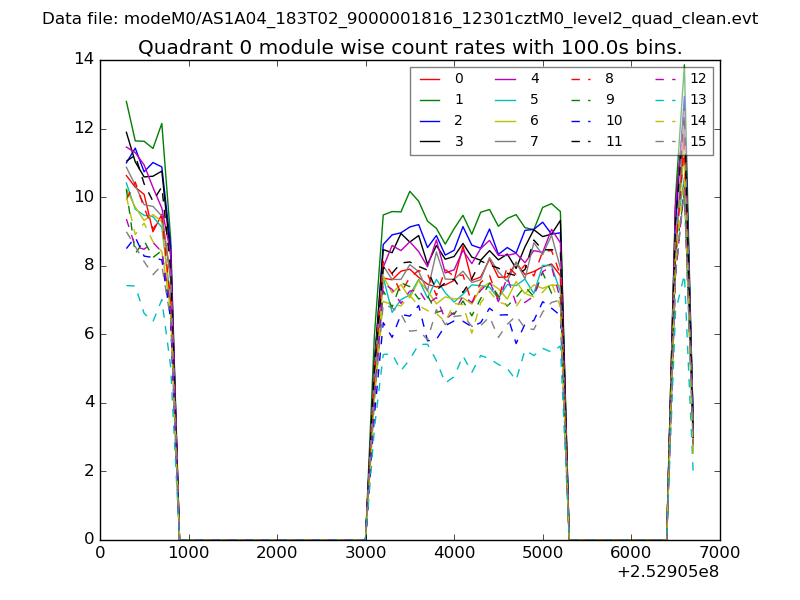 |
 |
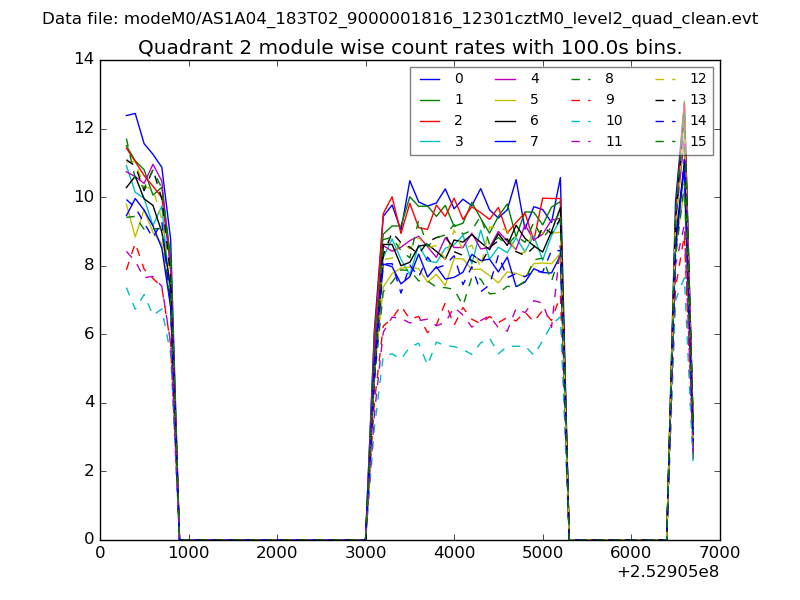
| Module-wise count rates for Quadrant B Data is divided into 100 sec bins |
 |
 |
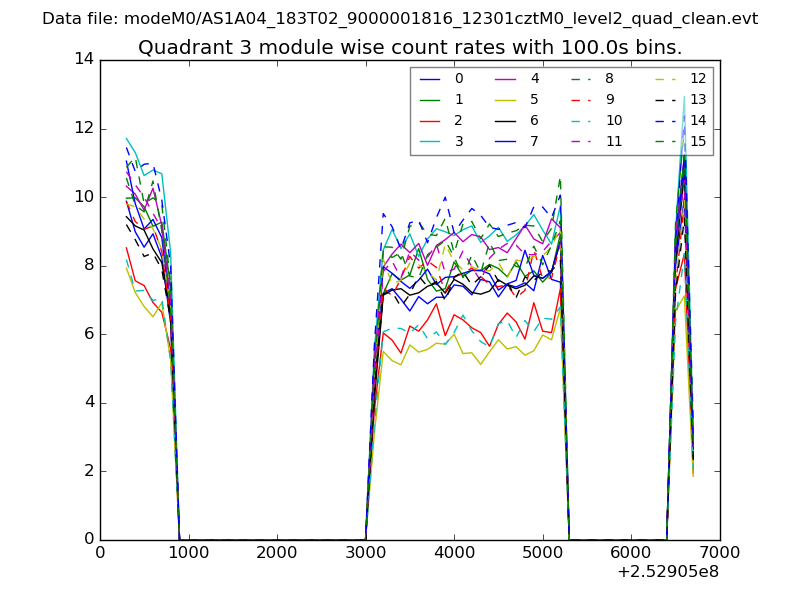
| Module-wise count rates for Quadrant C Data is divided into 100 sec bins |
 |
 |
| Module-wise count rates for Quadrant D Data is divided into 100 sec bins |
 |
 |
| Parameter | Plot |
|---|---|
| CZT HV Monitor | 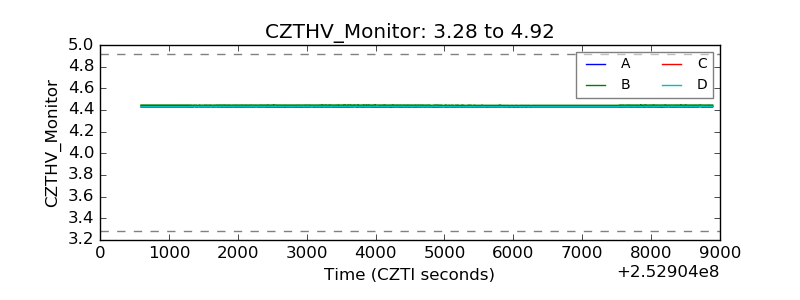 |
| D_VDD | 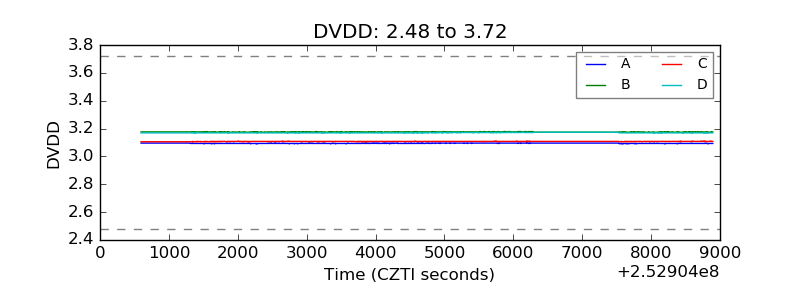 |
| Temperature 1 | 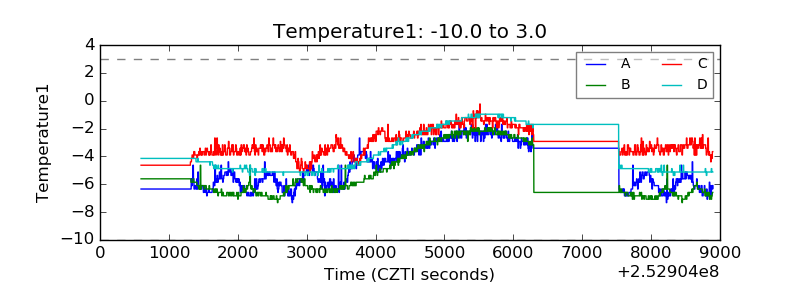 |
| Veto HV Monitor | 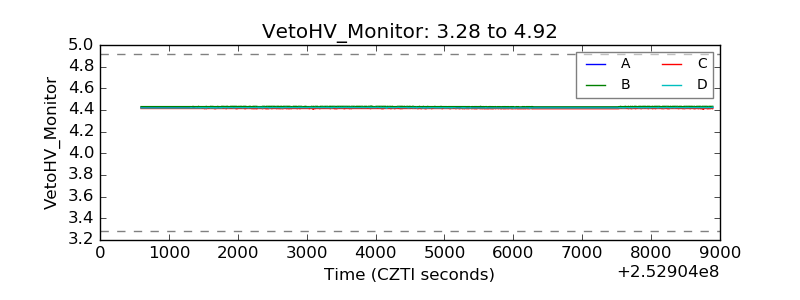 |
| Veto LLD |  |
| Alpha Counter | 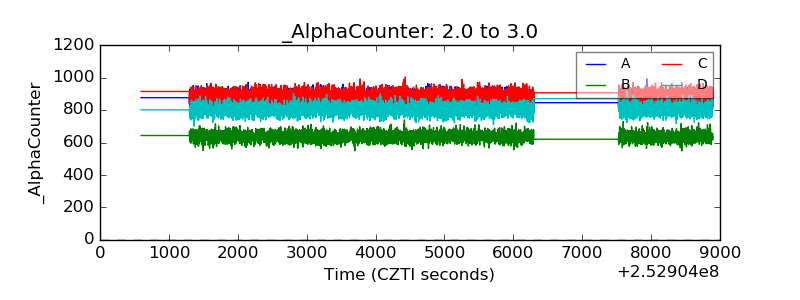 |
| _CPM_Rate | 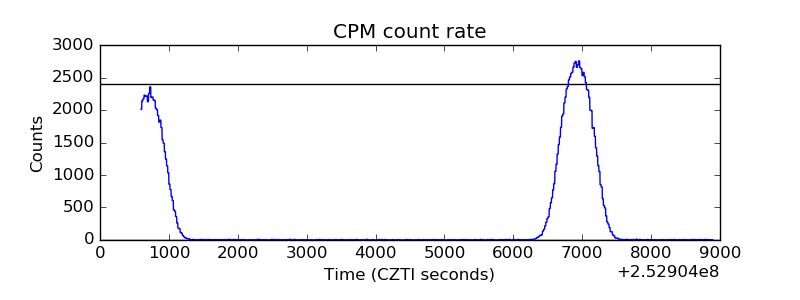 |
| CZT Counter |  |
| +2.5 Volts monitor |  |
| +5 Volts monitor |  |
| _ROLL_ROT | 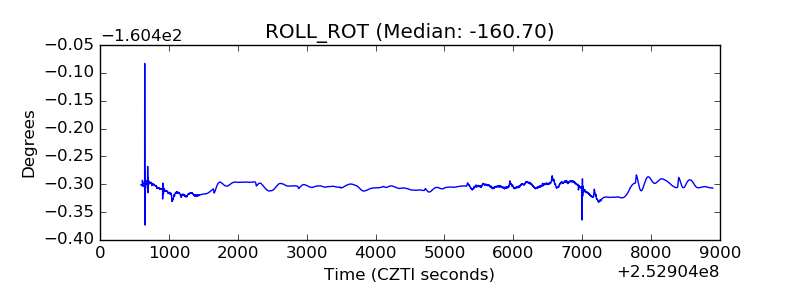 |
| _Roll_DEC | 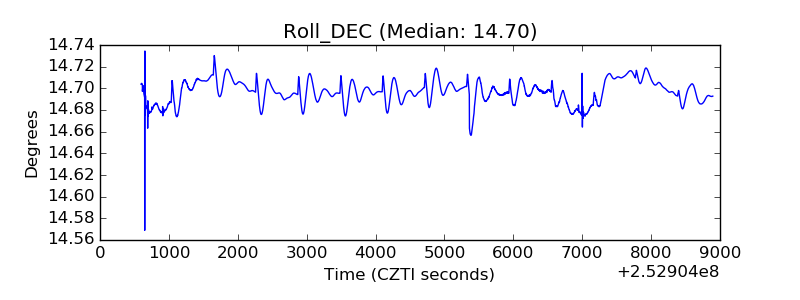 |
| _Roll_RA | 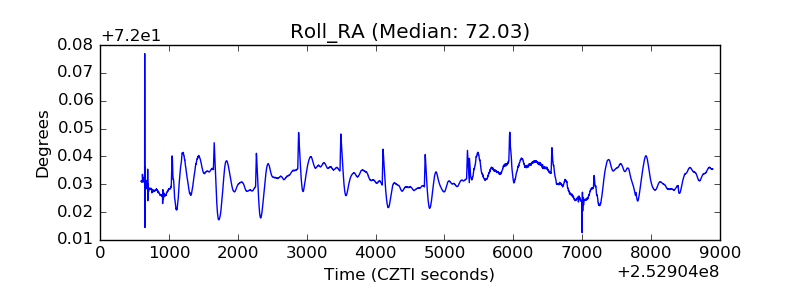 |
| Veto Counter | 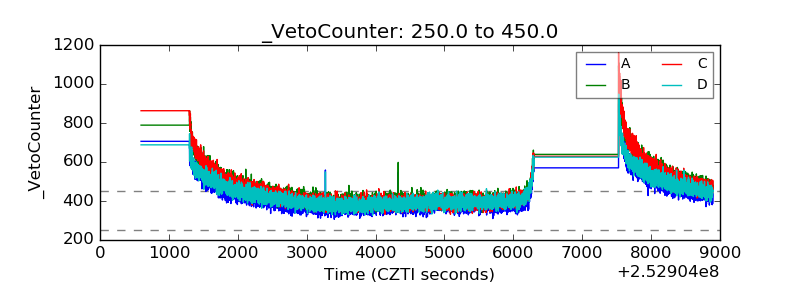 |