| Param | Original file | Final file |
|---|---|---|
| Filename | modeM0/AS1A04_183T02_9000001816_12303cztM0_level2.evt | modeM0/AS1A04_183T02_9000001816_12303cztM0_level2_quad_clean.evt |
| Size (bytes) | 496,549,440 | 65,321,280 |
| Size | 473.5 MB | 62.3 MB |
| Events in quadrant A | 3,666,946 | 385,472 |
| Events in quadrant B | 4,380,221 | 387,683 |
| Events in quadrant C | 3,176,740 | 394,689 |
| Events in quadrant D | 3,391,211 | 374,743 |
| Mode SS | |||
|---|---|---|---|
| Quadrant | BADHDUFLAG | Total packets | Discarded packets |
| A | 0 | 128 | 0 |
| B | 0 | 128 | 0 |
| C | 0 | 128 | 0 |
| D | 0 | 128 | 0 |
| Mode M9 | |||
|---|---|---|---|
| Quadrant | BADHDUFLAG | Total packets | Discarded packets |
| A | 0 | 17 | 0 |
| B | 0 | 17 | 0 |
| C | 0 | 17 | 0 |
| D | 0 | 18 | 0 |
| Mode M0 | |||
|---|---|---|---|
| Quadrant | BADHDUFLAG | Total packets | Discarded packets |
| A | 0 | 14796 | 3 |
| B | 0 | 16978 | 2 |
| C | 0 | 13230 | 2 |
| D | 0 | 13888 | 2 |
| Quadrant | Total seconds | Saturated seconds | Saturation percentage |
|---|---|---|---|
| A | 6227 | 106 | 1.702264% |
| B | 6227 | 311 | 4.994379% |
| C | 6227 | 48 | 0.770837% |
| D | 6227 | 92 | 1.477437% |
Noise dominated data is calculated using 1-second bins in cleaned event files. If a bin has >2000 counts, and if more than 50% of those come from <1% of pixels, then it is considered to be noise-dominated and hence unusable.
| Quadrant | # 1 sec bins | Bins with >0 counts | Bins with >2000 counts | High rate bins dominated by noise | Noise dominated (total time) | Noise dominated (detector-on time) | Marked lightcurve |
|---|---|---|---|---|---|---|---|
| A | 7573 | 6229 | 5 | 5 | 0.07% | 0.08% | 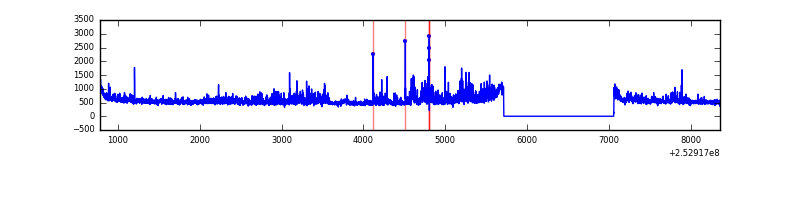 |
| B | 7573 | 6229 | 152 | 152 | 2.01% | 2.44% | 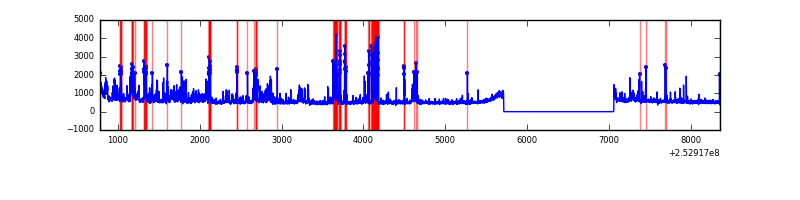 |
| C | 7573 | 6229 | 5 | 5 | 0.07% | 0.08% | 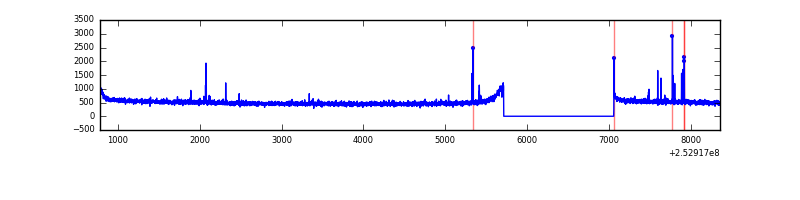 |
| D | 7573 | 6229 | 36 | 36 | 0.48% | 0.58% | 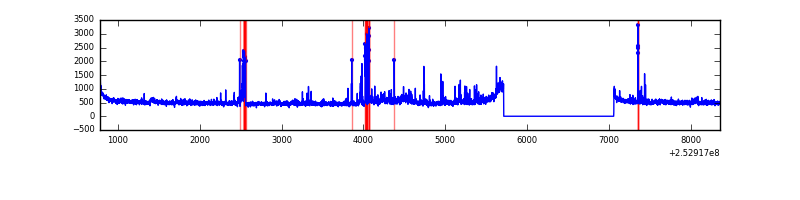 |
Top three noisy pixels from each quadrant. If the there are fewer than three noisy pixels in the level2.evt file, extra rows are filled as -1
| Pixel properties | Quadrant properties | ||||||
|---|---|---|---|---|---|---|---|
| Quadrant | DetID | PixID | Counts | Sigma | Mean | Median | Sigma |
| A | 1 | 162 | 152831 | 914.47 | 823 | 809 | 166.2 |
| A | 1 | 178 | 87965 | 524.27 | 823 | 809 | 166.2 |
| A | 1 | 161 | 76566 | 455.71 | 823 | 809 | 166.2 |
| B | 4 | 239 | 696087 | 4512.76 | 821 | 803 | 154.1 |
| B | 0 | 85 | 399557 | 2588.13 | 821 | 803 | 154.1 |
| B | 0 | 197 | 18974 | 117.94 | 821 | 803 | 154.1 |
| C | 14 | 234 | 47147 | 252.65 | 800 | 805 | 183.4 |
| C | 4 | 254 | 11758 | 59.71 | 800 | 805 | 183.4 |
| C | 13 | 61 | 5760 | 27.01 | 800 | 805 | 183.4 |
| D | 10 | 199 | 130495 | 690.61 | 789 | 769 | 187.8 |
| D | 11 | 129 | 101283 | 535.1 | 789 | 769 | 187.8 |
| D | 10 | 50 | 55287 | 290.23 | 789 | 769 | 187.8 |
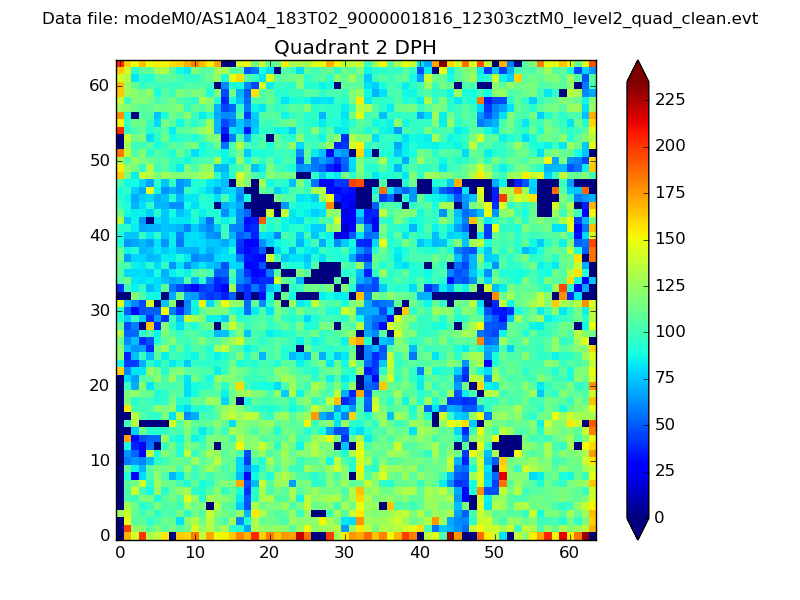
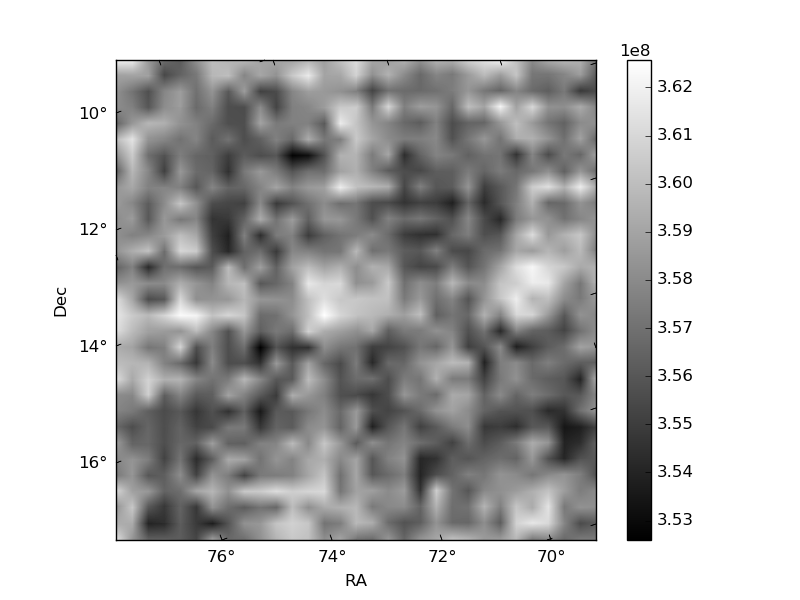
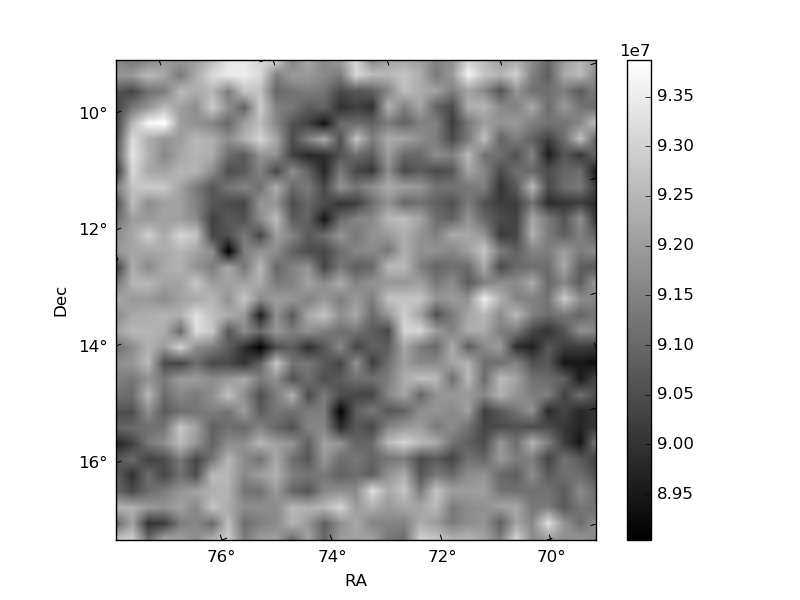
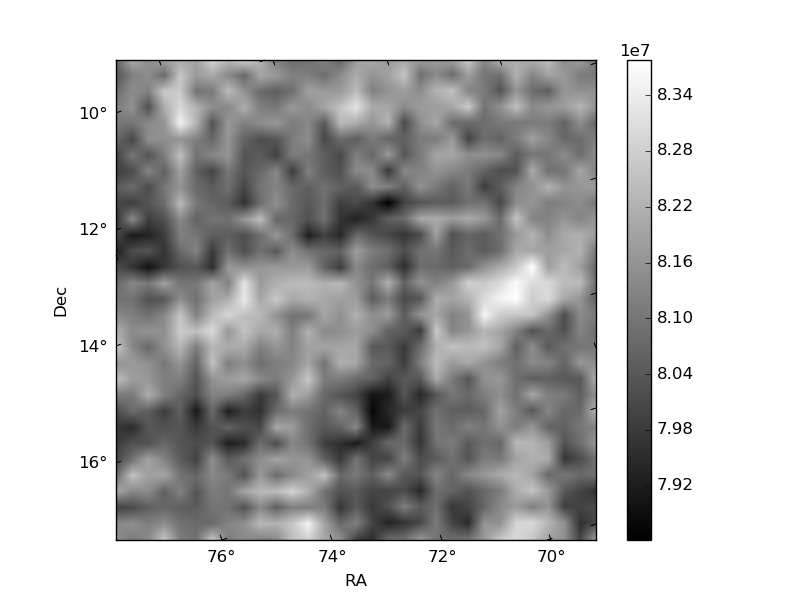
Histogram calculated using DETX and DETY for each event in the final _common_clean file
| Quadrant A | 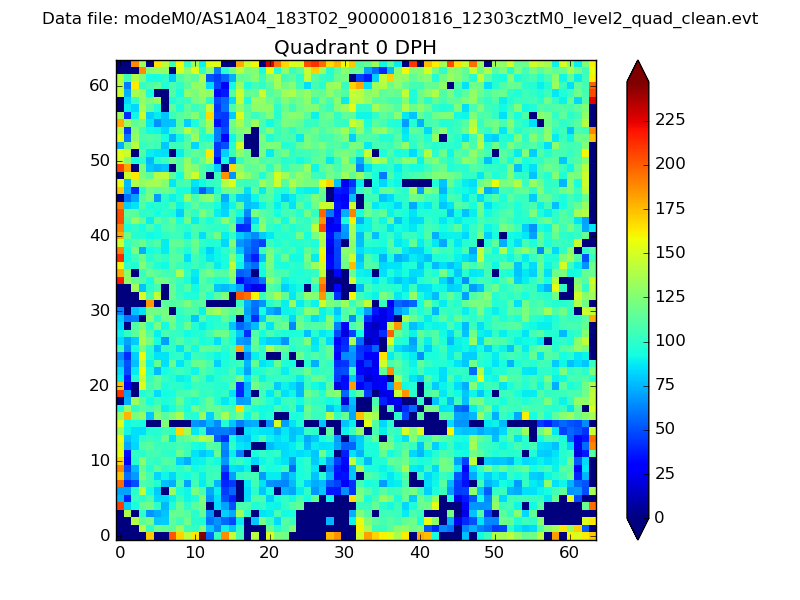 |
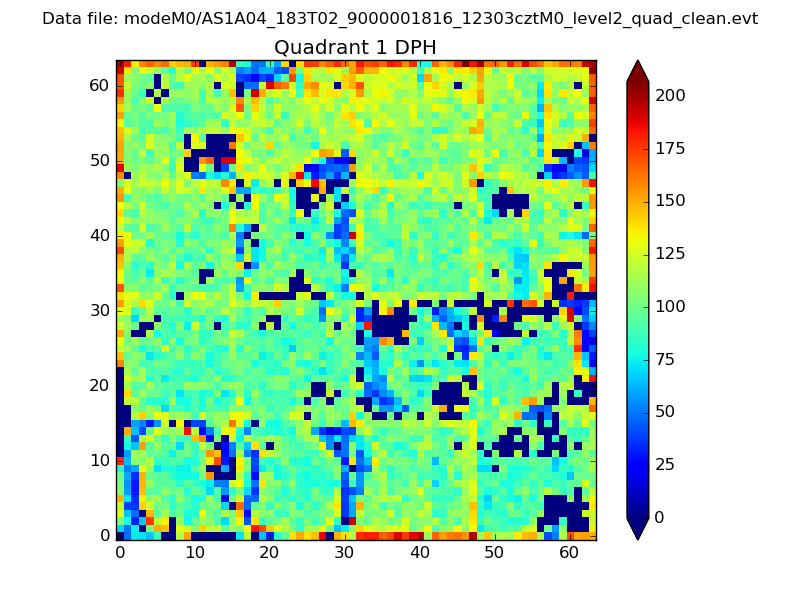 |
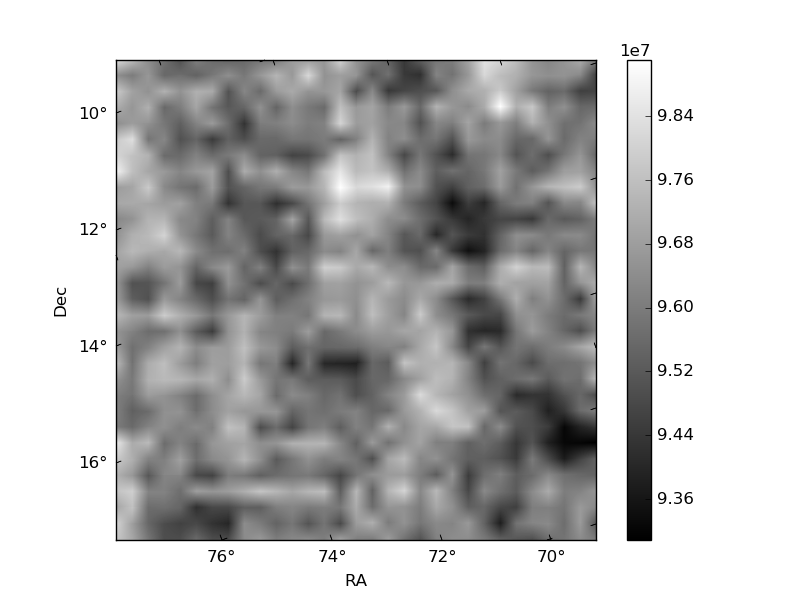
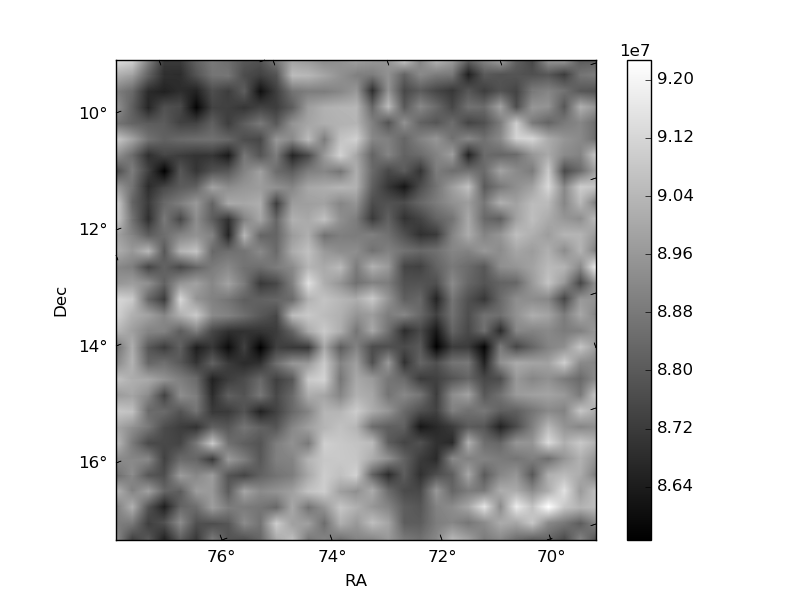
Quadrant B |
|---|---|---|---|
| Quadrant D | 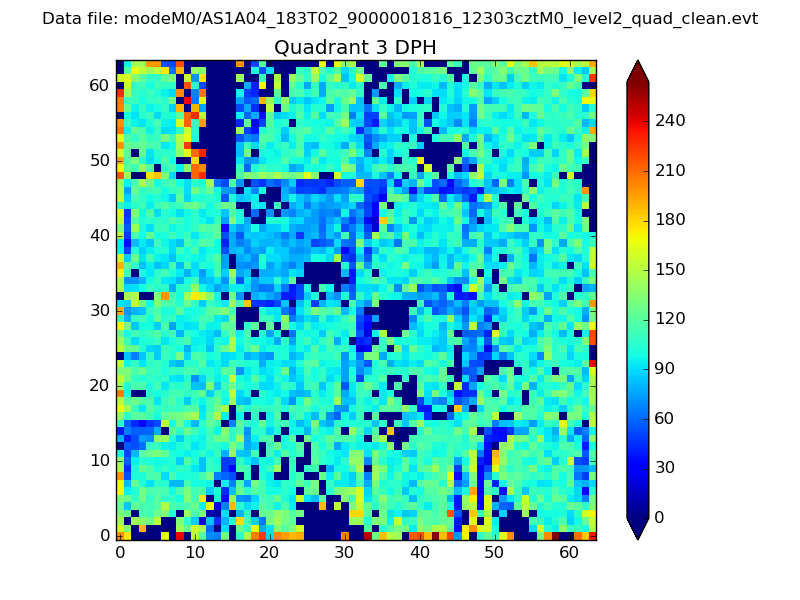 |
 |
Quadrant C |
| Plot type | Count rate plots | Images |
|---|---|---|
| Comparison with Poisson distribution Blue bars denote a histogram of data divided into 1 sec bins. Red curve is a Poisson curve with rate = median count rate of data. |
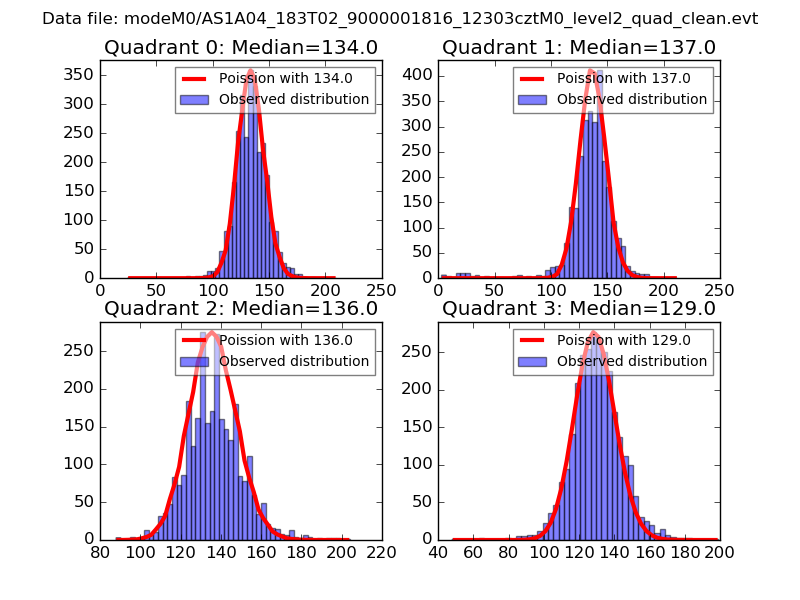 |
 |
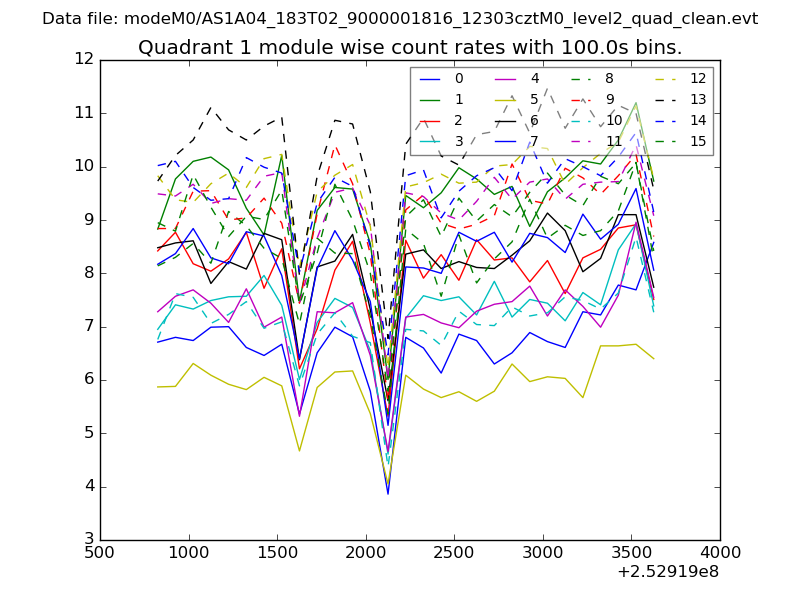
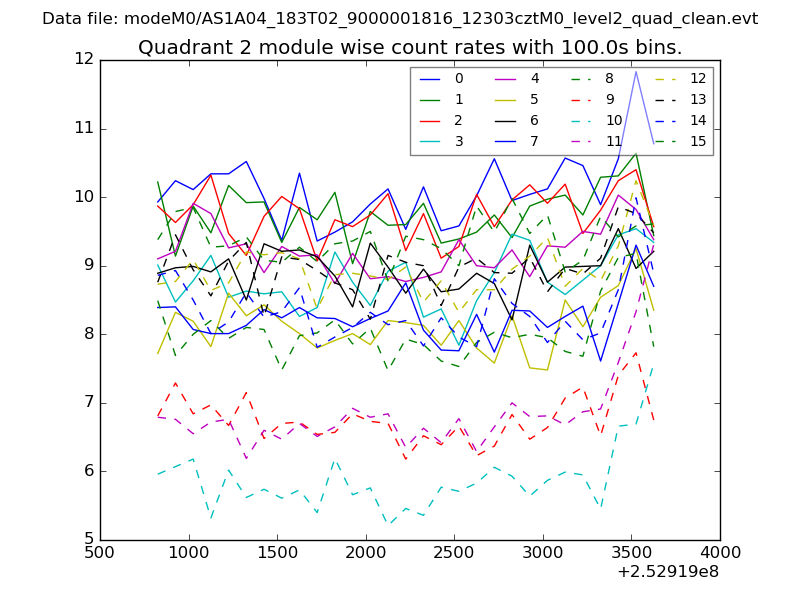
| Quadrant-wise count rates Data is divided into 100 sec bins |
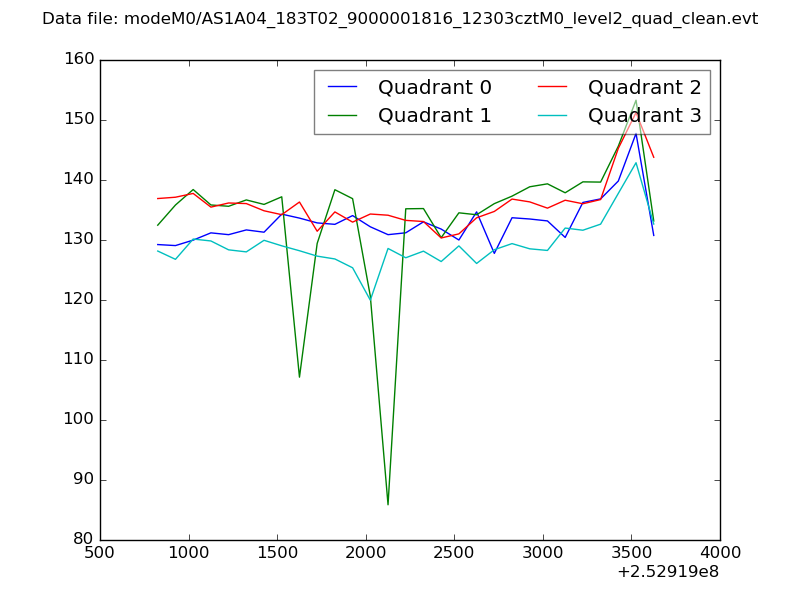 |
|
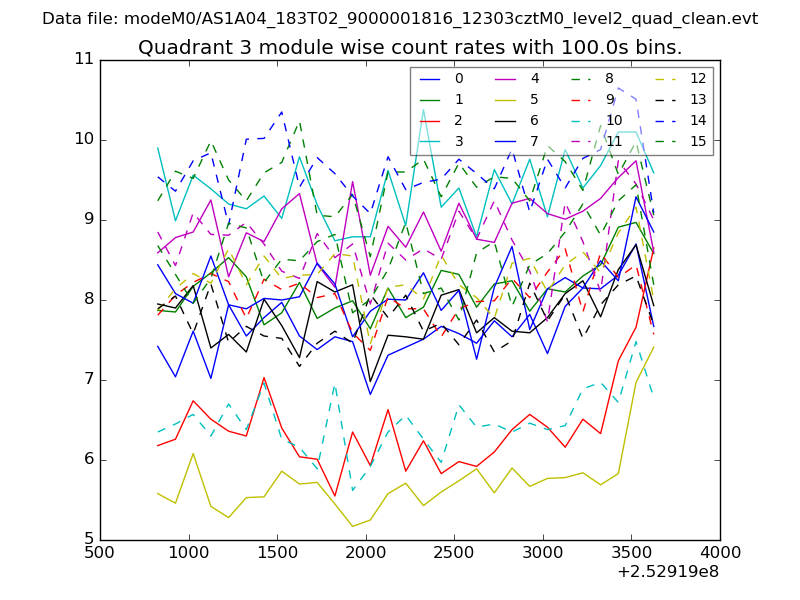
| Module-wise count rates for Quadrant A Data is divided into 100 sec bins |
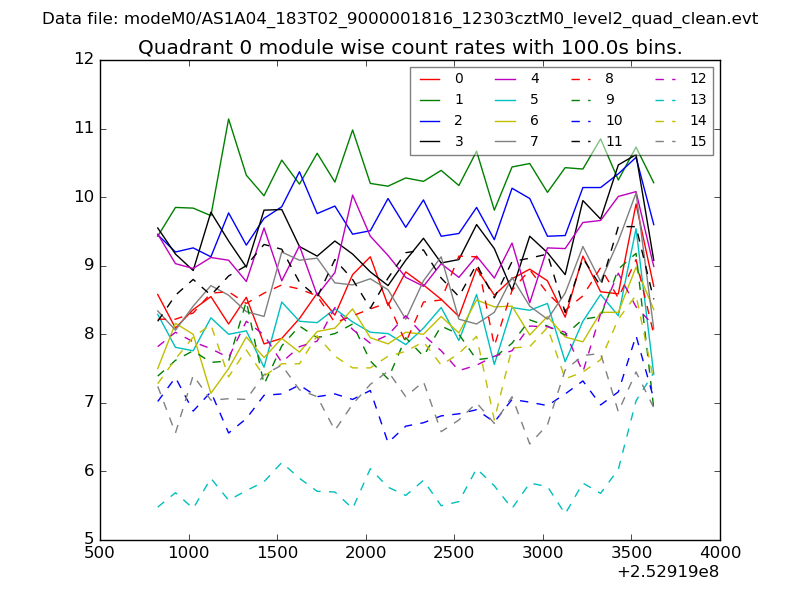 |
 |
| Module-wise count rates for Quadrant B Data is divided into 100 sec bins |
 |
 |
| Module-wise count rates for Quadrant C Data is divided into 100 sec bins |
 |
 |
| Module-wise count rates for Quadrant D Data is divided into 100 sec bins |
 |
 |
| Parameter | Plot |
|---|---|
| CZT HV Monitor |  |
| D_VDD | 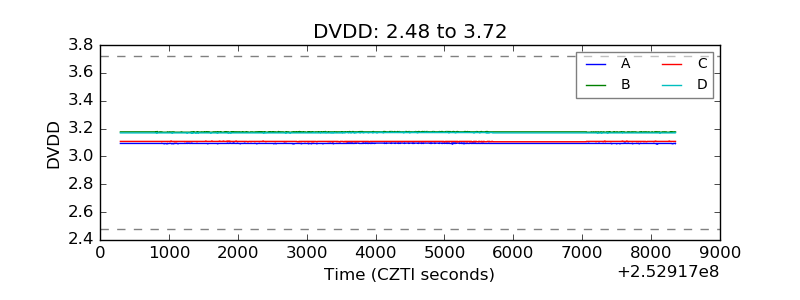 |
| Temperature 1 |  |
| Veto HV Monitor | 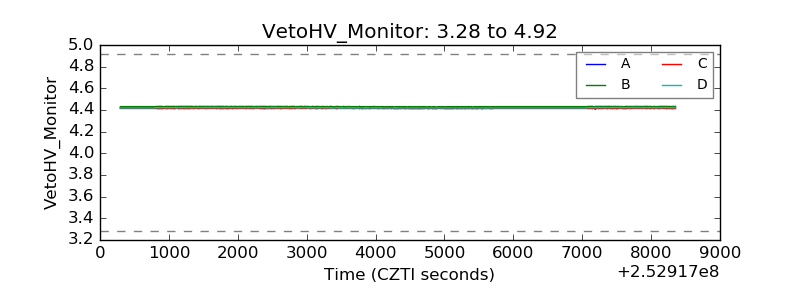 |
| Veto LLD | 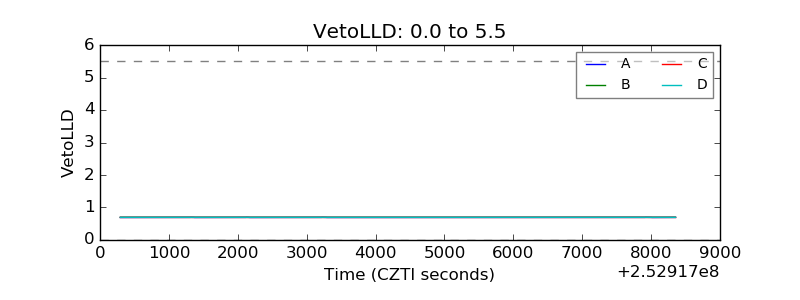 |
| Alpha Counter |  |
| _CPM_Rate | 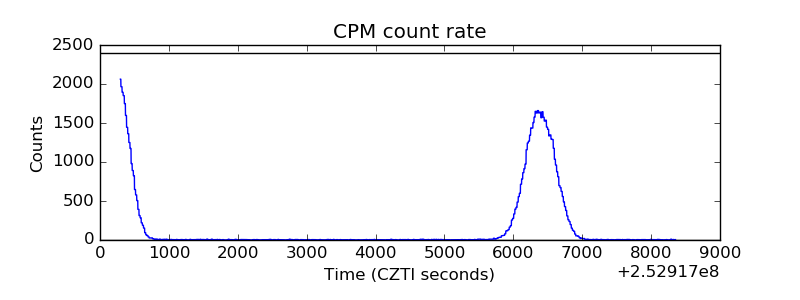 |
| CZT Counter | 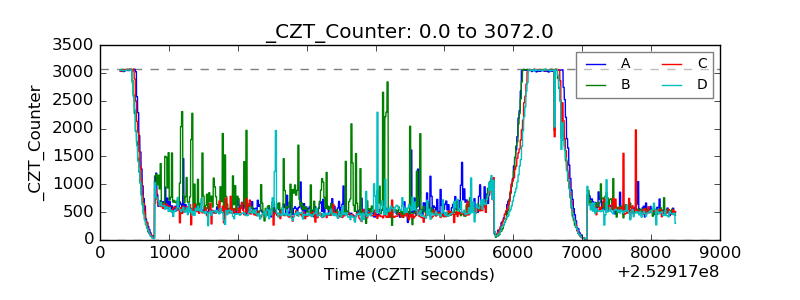 |
| +2.5 Volts monitor |  |
| +5 Volts monitor | 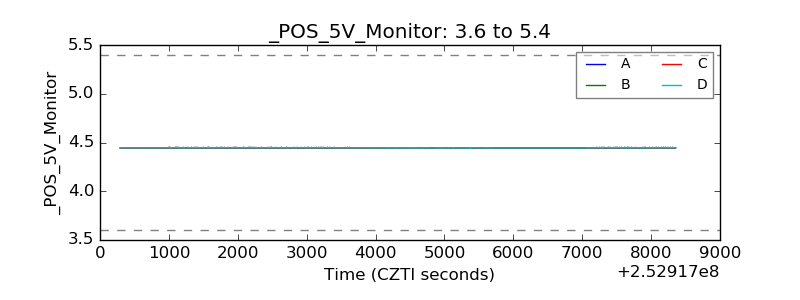 |
| _ROLL_ROT |  |
| _Roll_DEC | 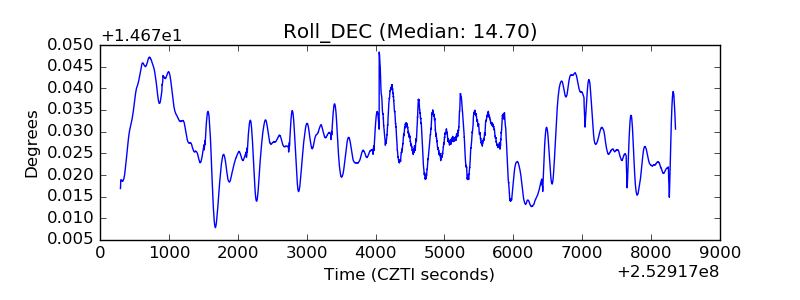 |
| _Roll_RA | 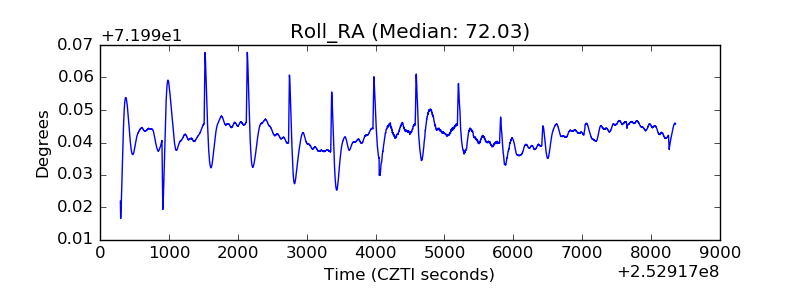 |
| Veto Counter | 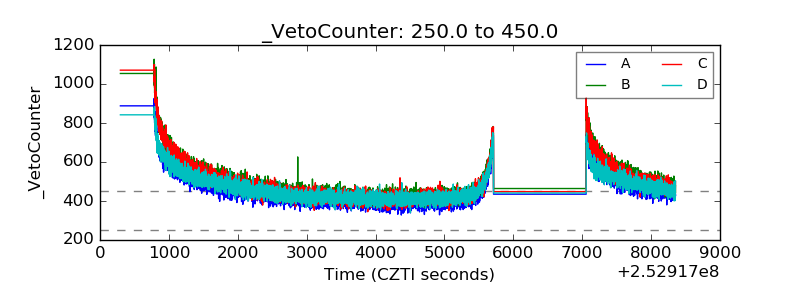 |