| Param | Original file | Final file |
|---|---|---|
| Filename | modeM0/AS1A04_183T02_9000001816_12304cztM0_level2.evt | modeM0/AS1A04_183T02_9000001816_12304cztM0_level2_quad_clean.evt |
| Size (bytes) | 581,080,320 | 81,253,440 |
| Size | 554.2 MB | 77.5 MB |
| Events in quadrant A | 3,951,916 | 517,578 |
| Events in quadrant B | 5,706,384 | 459,508 |
| Events in quadrant C | 3,432,851 | 524,072 |
| Events in quadrant D | 4,053,679 | 492,718 |
| Mode SS | |||
|---|---|---|---|
| Quadrant | BADHDUFLAG | Total packets | Discarded packets |
| A | 0 | 138 | 0 |
| B | 0 | 138 | 0 |
| C | 0 | 138 | 0 |
| D | 0 | 138 | 0 |
| Mode M9 | |||
|---|---|---|---|
| Quadrant | BADHDUFLAG | Total packets | Discarded packets |
| A | 0 | 26 | 0 |
| B | 0 | 26 | 0 |
| C | 0 | 26 | 0 |
| D | 0 | 26 | 0 |
| Mode M0 | |||
|---|---|---|---|
| Quadrant | BADHDUFLAG | Total packets | Discarded packets |
| A | 0 | 16038 | 3 |
| B | 0 | 21115 | 2 |
| C | 0 | 14362 | 2 |
| D | 0 | 16279 | 2 |
| Quadrant | Total seconds | Saturated seconds | Saturation percentage |
|---|---|---|---|
| A | 6685 | 145 | 2.169035% |
| B | 6685 | 1050 | 15.706806% |
| C | 6685 | 94 | 1.406133% |
| D | 6685 | 176 | 2.632760% |
Noise dominated data is calculated using 1-second bins in cleaned event files. If a bin has >2000 counts, and if more than 50% of those come from <1% of pixels, then it is considered to be noise-dominated and hence unusable.
| Quadrant | # 1 sec bins | Bins with >0 counts | Bins with >2000 counts | High rate bins dominated by noise | Noise dominated (total time) | Noise dominated (detector-on time) | Marked lightcurve |
|---|---|---|---|---|---|---|---|
| A | 9301 | 6688 | 0 | 0 | 0.00% | 0.00% | 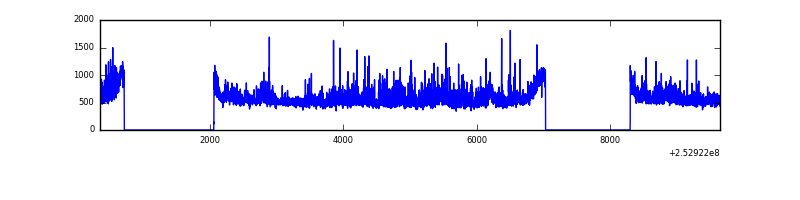 |
| B | 9301 | 6688 | 680 | 680 | 7.31% | 10.17% | 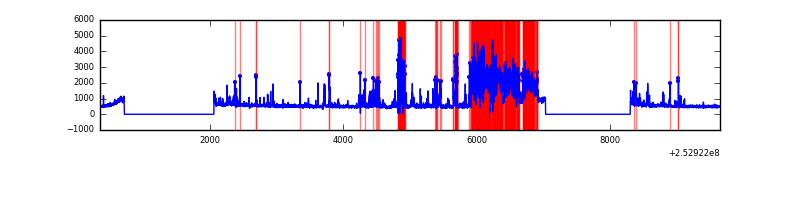 |
| C | 9301 | 6688 | 11 | 11 | 0.12% | 0.16% | 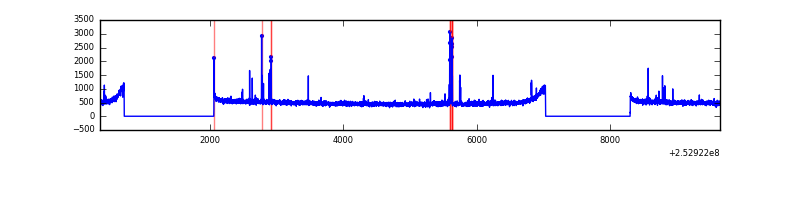 |
| D | 9301 | 6688 | 77 | 77 | 0.83% | 1.15% | 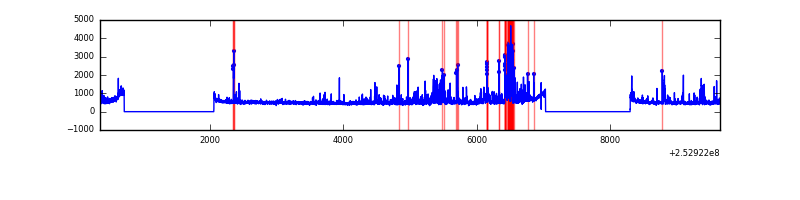 |
Top three noisy pixels from each quadrant. If the there are fewer than three noisy pixels in the level2.evt file, extra rows are filled as -1
| Pixel properties | Quadrant properties | ||||||
|---|---|---|---|---|---|---|---|
| Quadrant | DetID | PixID | Counts | Sigma | Mean | Median | Sigma |
| A | 1 | 162 | 180356 | 1002.7 | 883 | 865 | 179.0 |
| A | 1 | 178 | 101081 | 559.84 | 883 | 865 | 179.0 |
| A | 1 | 161 | 88314 | 488.52 | 883 | 865 | 179.0 |
| B | 0 | 85 | 1864574 | 11744.02 | 831 | 812 | 158.7 |
| B | 4 | 239 | 506874 | 3188.82 | 831 | 812 | 158.7 |
| B | 0 | 197 | 22889 | 139.11 | 831 | 812 | 158.7 |
| C | 4 | 254 | 47791 | 235.67 | 855 | 861 | 199.1 |
| C | 14 | 234 | 42682 | 210.01 | 855 | 861 | 199.1 |
| C | 15 | 208 | 12104 | 56.46 | 855 | 861 | 199.1 |
| D | 1 | 52 | 543542 | 2660.29 | 846 | 823 | 204.0 |
| D | 10 | 50 | 75060 | 363.89 | 846 | 823 | 204.0 |
| D | 11 | 129 | 72303 | 350.38 | 846 | 823 | 204.0 |
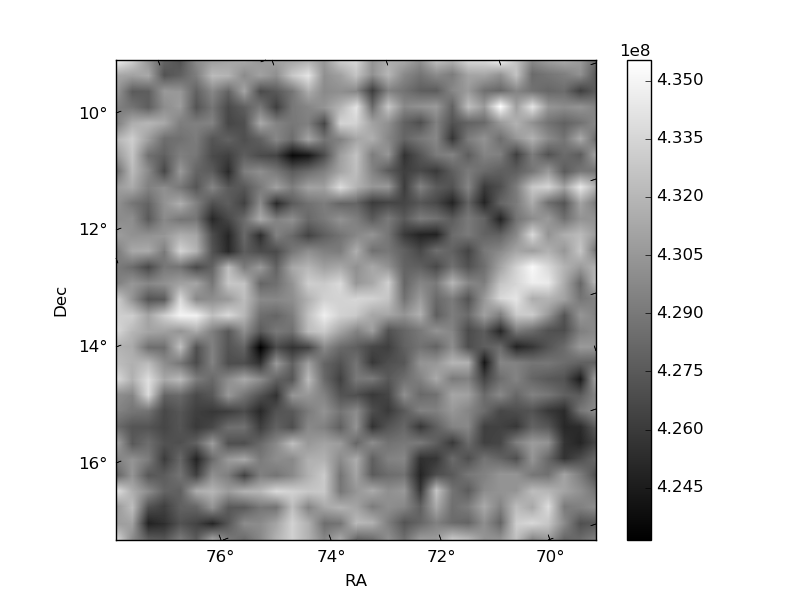
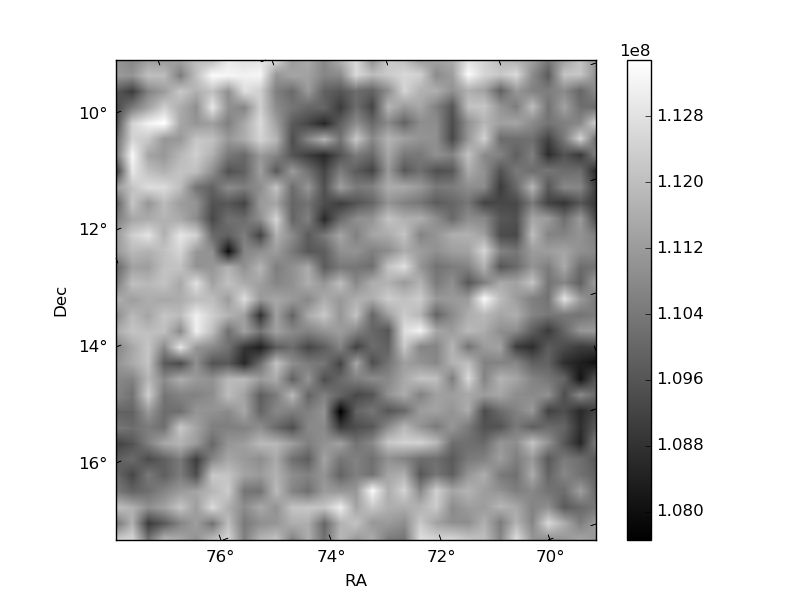
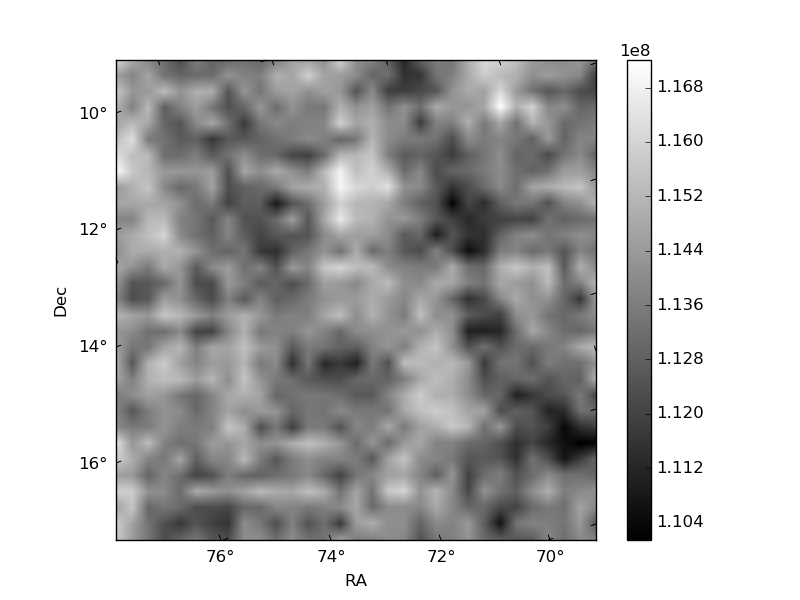
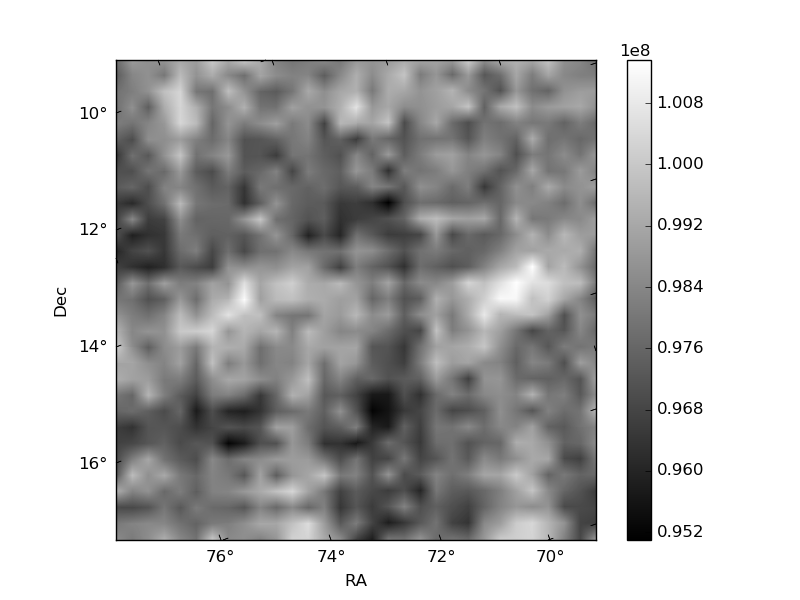
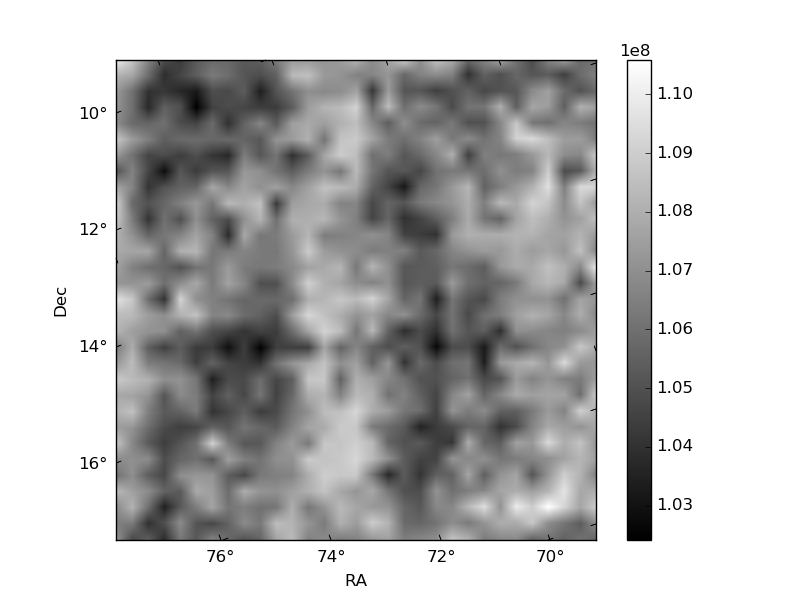
Histogram calculated using DETX and DETY for each event in the final _common_clean file
| Quadrant A | 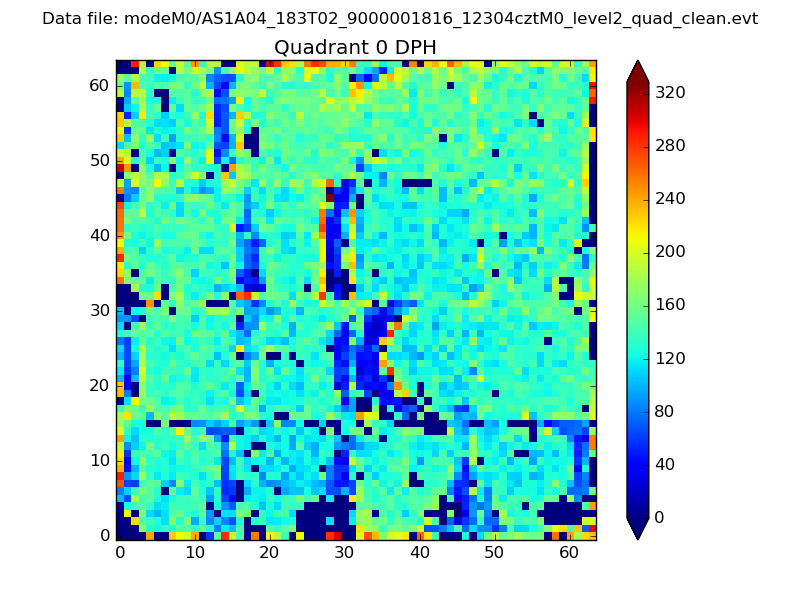 |
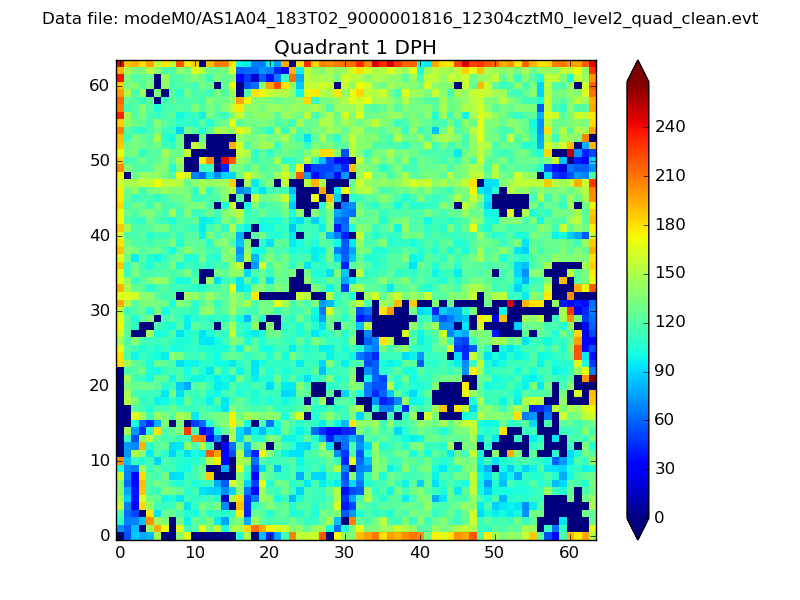 |
Quadrant B |
|---|---|---|---|
| Quadrant D | 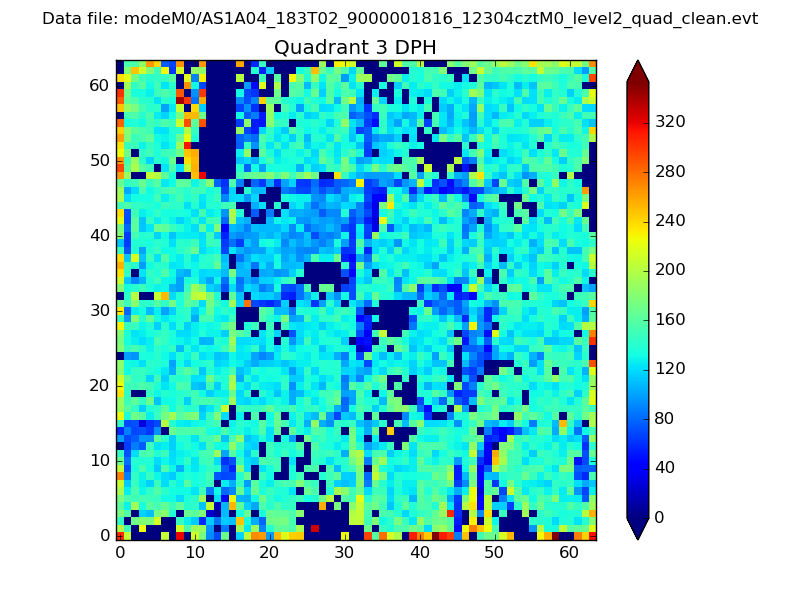 |
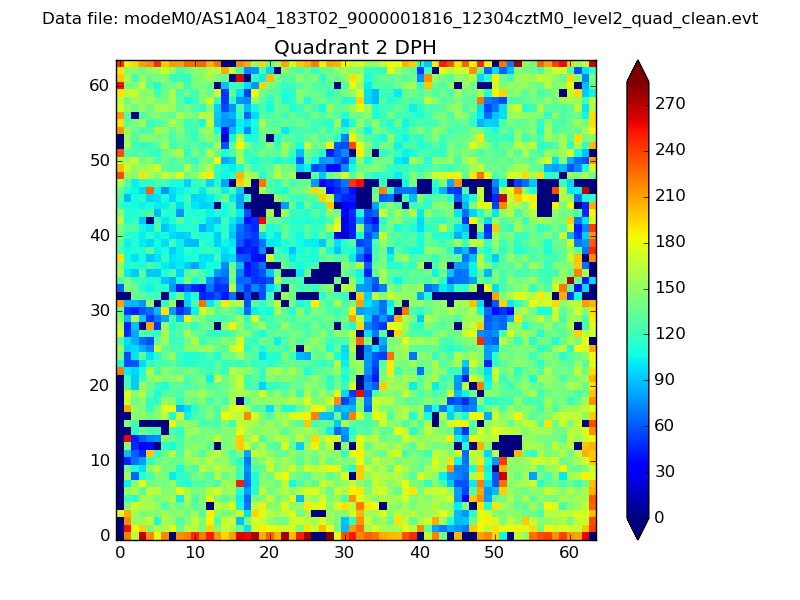 |
Quadrant C |
| Plot type | Count rate plots | Images |
|---|---|---|
| Comparison with Poisson distribution Blue bars denote a histogram of data divided into 1 sec bins. Red curve is a Poisson curve with rate = median count rate of data. |
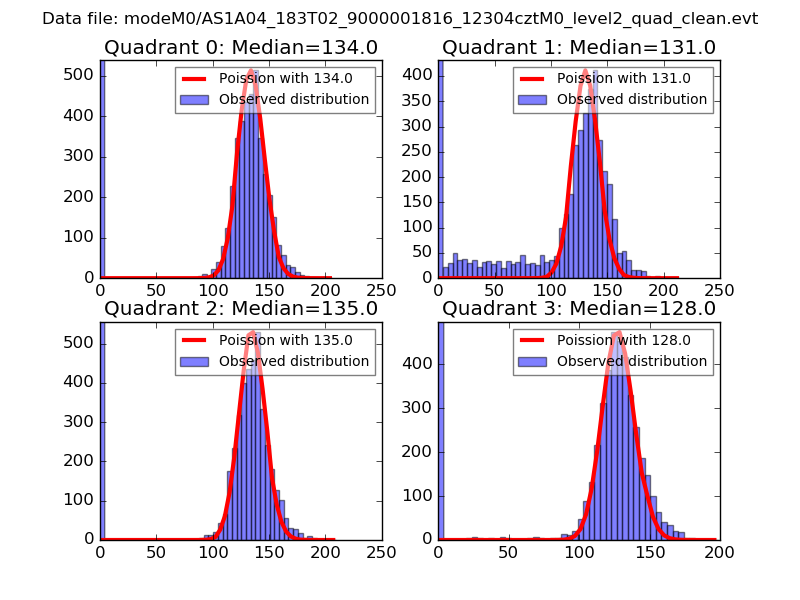 |
 |
| Quadrant-wise count rates Data is divided into 100 sec bins |
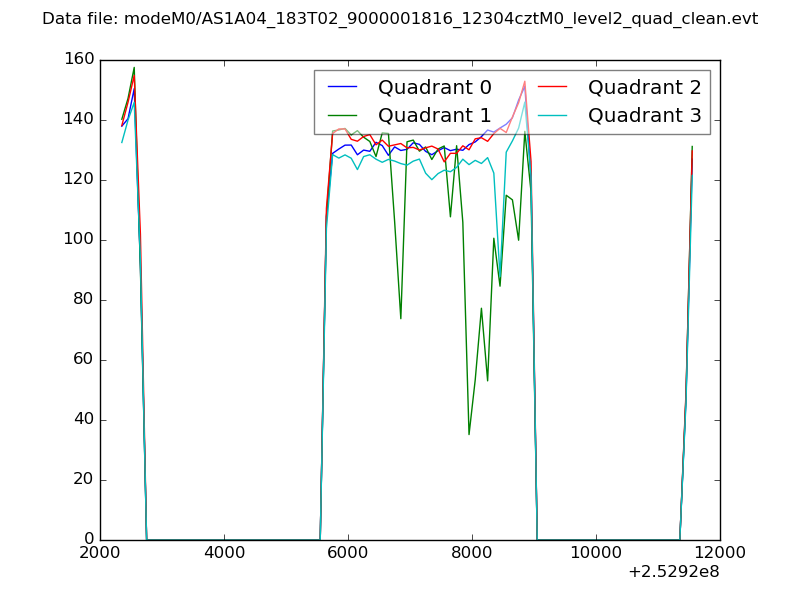 |
|
| Module-wise count rates for Quadrant A Data is divided into 100 sec bins |
 |
 |
| Module-wise count rates for Quadrant B Data is divided into 100 sec bins |
 |
 |
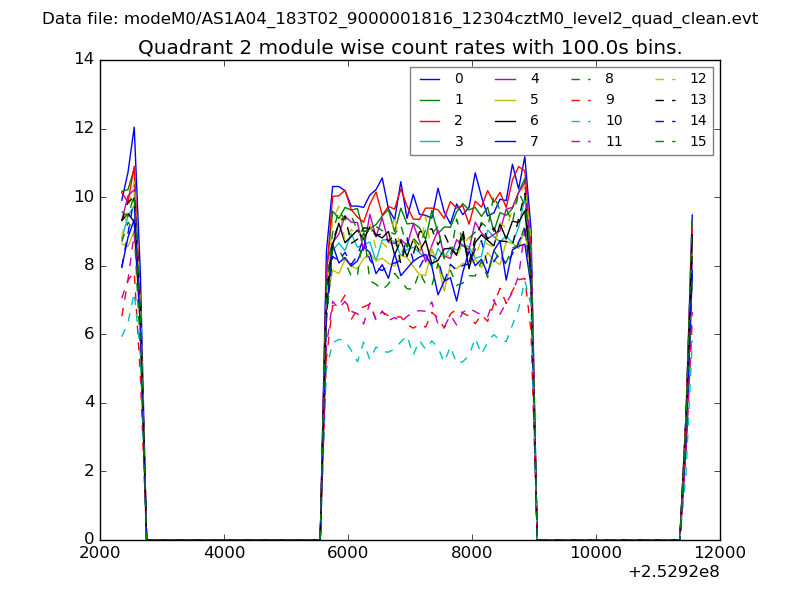
| Module-wise count rates for Quadrant C Data is divided into 100 sec bins |
 |
 |
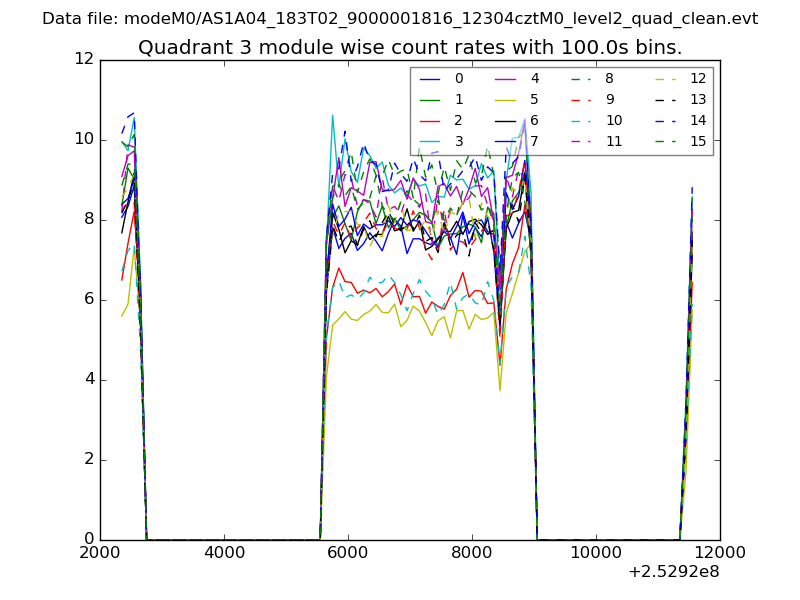
| Module-wise count rates for Quadrant D Data is divided into 100 sec bins |
 |
 |
| Parameter | Plot |
|---|---|
| CZT HV Monitor | 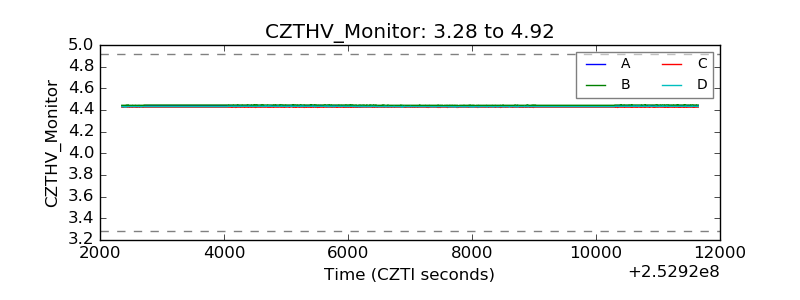 |
| D_VDD | 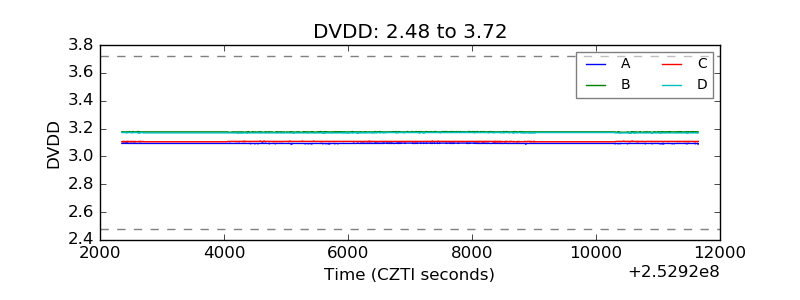 |
| Temperature 1 |  |
| Veto HV Monitor | 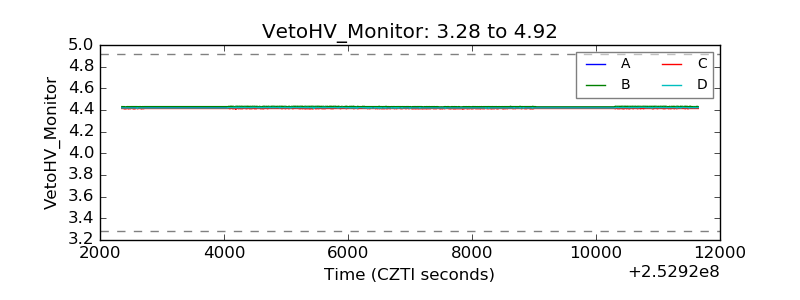 |
| Veto LLD | 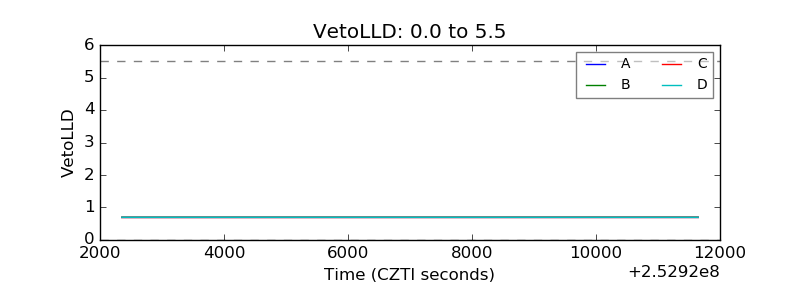 |
| Alpha Counter | 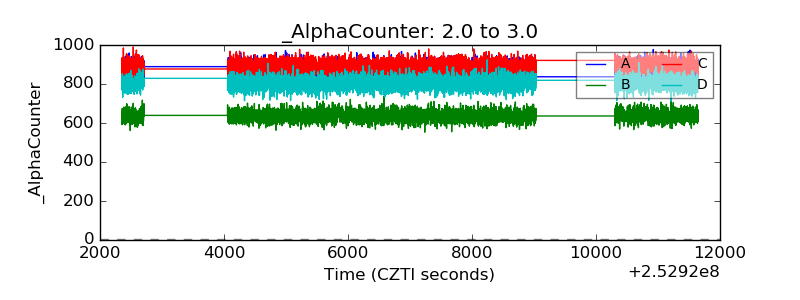 |
| _CPM_Rate | 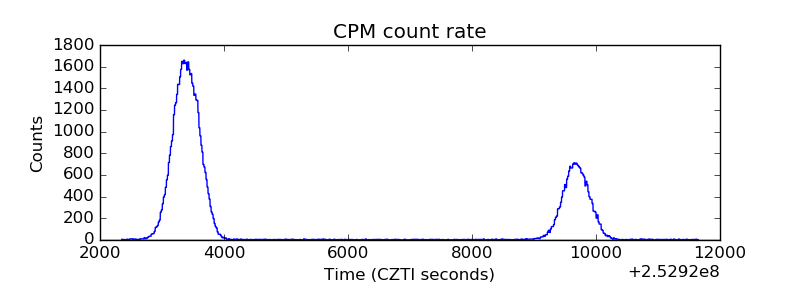 |
| CZT Counter | 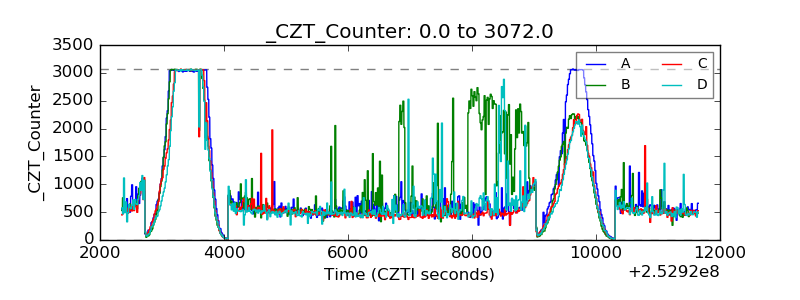 |
| +2.5 Volts monitor |  |
| +5 Volts monitor |  |
| _ROLL_ROT | 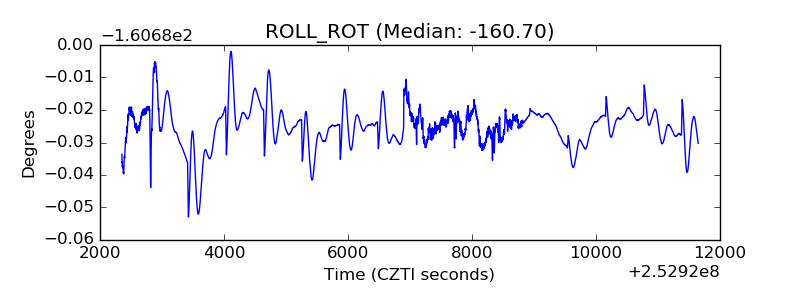 |
| _Roll_DEC | 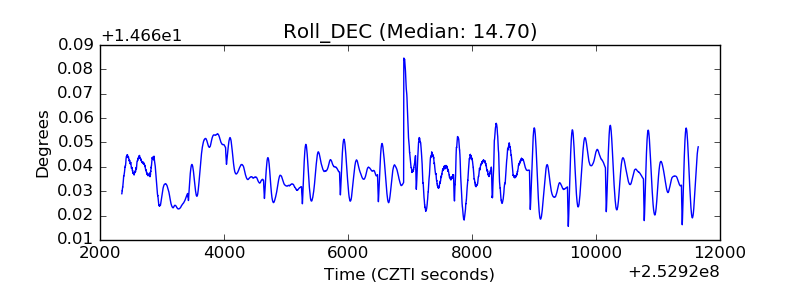 |
| _Roll_RA | 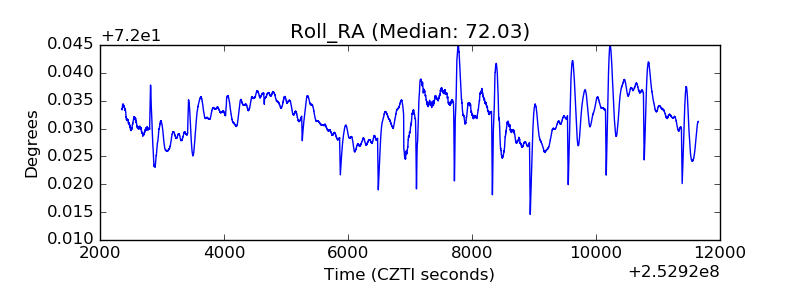 |
| Veto Counter |  |