| Param | Original file | Final file |
|---|---|---|
| Filename | modeM0/AS1A04_183T02_9000001816_12305cztM0_level2.evt | modeM0/AS1A04_183T02_9000001816_12305cztM0_level2_quad_clean.evt |
| Size (bytes) | 509,212,800 | 84,850,560 |
| Size | 485.6 MB | 80.9 MB |
| Events in quadrant A | 4,161,555 | 526,156 |
| Events in quadrant B | 3,944,809 | 535,192 |
| Events in quadrant C | 3,263,384 | 533,104 |
| Events in quadrant D | 3,596,832 | 507,605 |
| Mode SS | |||
|---|---|---|---|
| Quadrant | BADHDUFLAG | Total packets | Discarded packets |
| A | 0 | 136 | 0 |
| B | 0 | 136 | 0 |
| C | 0 | 136 | 0 |
| D | 0 | 136 | 0 |
| Mode M9 | |||
|---|---|---|---|
| Quadrant | BADHDUFLAG | Total packets | Discarded packets |
| A | 0 | 21 | 0 |
| B | 0 | 21 | 0 |
| C | 0 | 21 | 0 |
| D | 0 | 21 | 0 |
| Mode M0 | |||
|---|---|---|---|
| Quadrant | BADHDUFLAG | Total packets | Discarded packets |
| A | 0 | 16835 | 3 |
| B | 0 | 15883 | 2 |
| C | 0 | 14043 | 2 |
| D | 0 | 15061 | 2 |
| Quadrant | Total seconds | Saturated seconds | Saturation percentage |
|---|---|---|---|
| A | 6705 | 200 | 2.982849% |
| B | 6705 | 286 | 4.265474% |
| C | 6705 | 114 | 1.700224% |
| D | 6705 | 170 | 2.535421% |
Noise dominated data is calculated using 1-second bins in cleaned event files. If a bin has >2000 counts, and if more than 50% of those come from <1% of pixels, then it is considered to be noise-dominated and hence unusable.
| Quadrant | # 1 sec bins | Bins with >0 counts | Bins with >2000 counts | High rate bins dominated by noise | Noise dominated (total time) | Noise dominated (detector-on time) | Marked lightcurve |
|---|---|---|---|---|---|---|---|
| A | 7631 | 6707 | 4 | 4 | 0.05% | 0.06% | 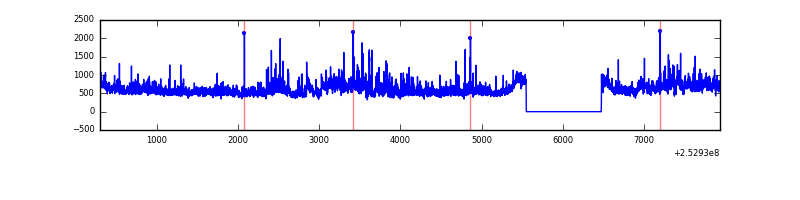 |
| B | 7631 | 6707 | 48 | 48 | 0.63% | 0.72% | 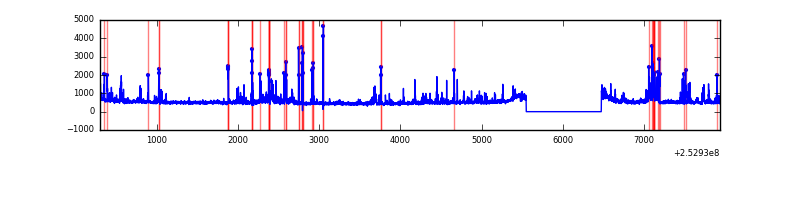 |
| C | 7631 | 6707 | 5 | 5 | 0.07% | 0.07% | 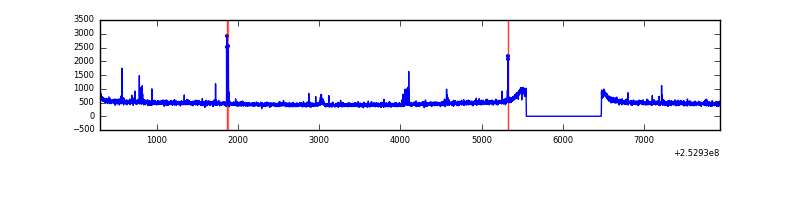 |
| D | 7631 | 6707 | 34 | 34 | 0.45% | 0.51% | 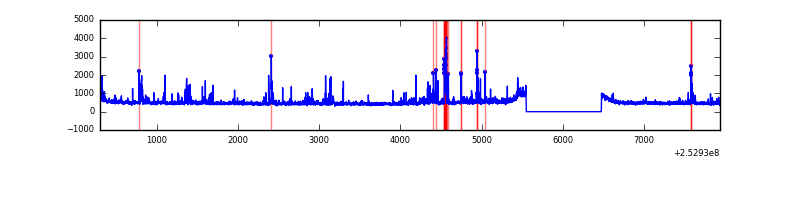 |
Top three noisy pixels from each quadrant. If the there are fewer than three noisy pixels in the level2.evt file, extra rows are filled as -1
| Pixel properties | Quadrant properties | ||||||
|---|---|---|---|---|---|---|---|
| Quadrant | DetID | PixID | Counts | Sigma | Mean | Median | Sigma |
| A | 11 | 29 | 177109 | 1017.61 | 845 | 829 | 173.2 |
| A | 1 | 162 | 162473 | 933.12 | 845 | 829 | 173.2 |
| A | 0 | 23 | 159334 | 915.0 | 845 | 829 | 173.2 |
| B | 4 | 239 | 316766 | 1955.86 | 843 | 824 | 161.5 |
| B | 0 | 85 | 205432 | 1266.64 | 843 | 824 | 161.5 |
| B | 11 | 51 | 51888 | 316.11 | 843 | 824 | 161.5 |
| C | 14 | 234 | 51048 | 262.54 | 821 | 826 | 191.3 |
| C | 4 | 254 | 11609 | 56.37 | 821 | 826 | 191.3 |
| C | 13 | 61 | 5861 | 26.32 | 821 | 826 | 191.3 |
| D | 1 | 52 | 189194 | 963.09 | 814 | 793 | 195.6 |
| D | 13 | 249 | 104043 | 527.81 | 814 | 793 | 195.6 |
| D | 11 | 129 | 54752 | 275.83 | 814 | 793 | 195.6 |
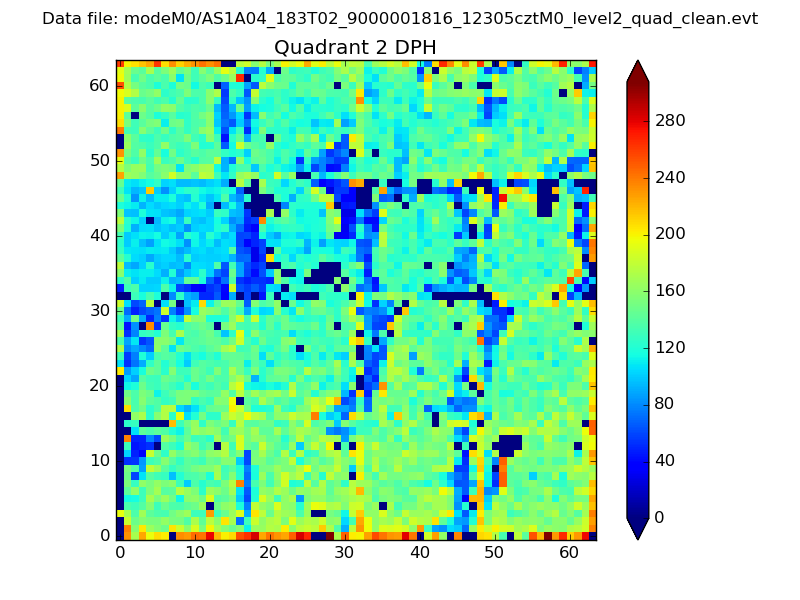
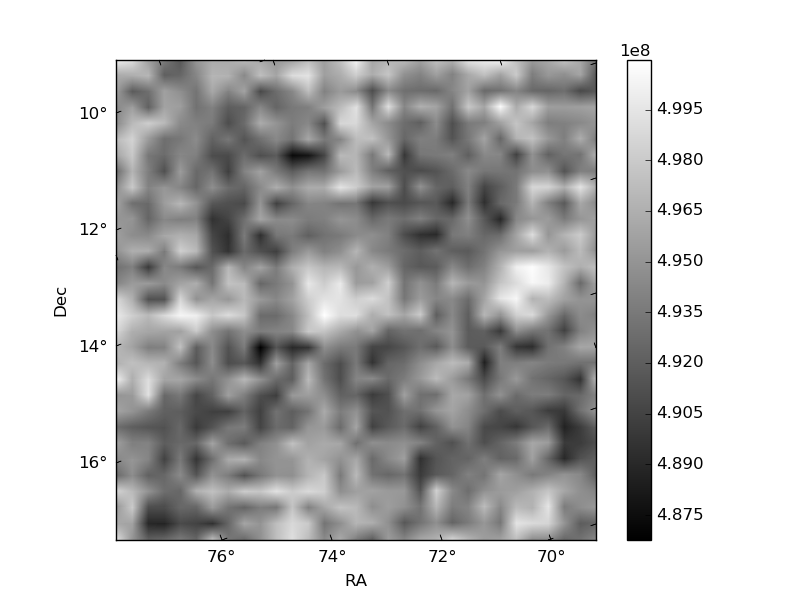
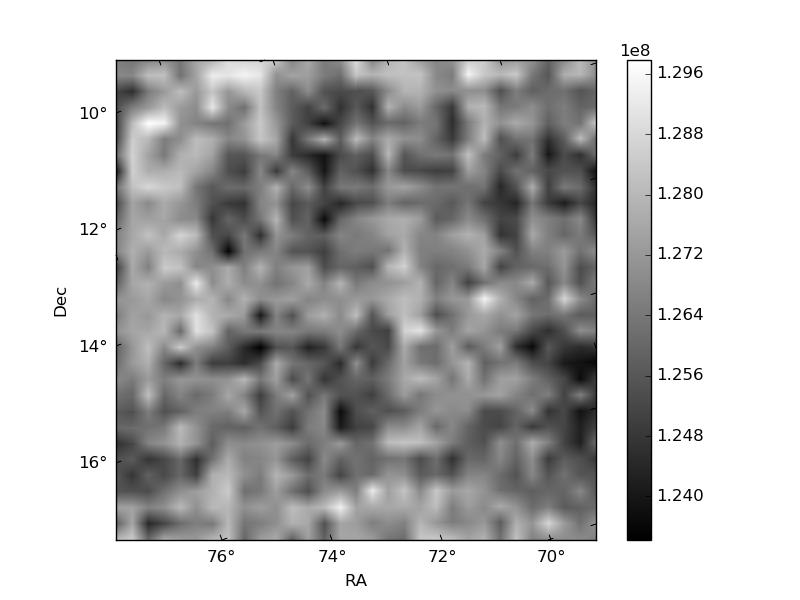
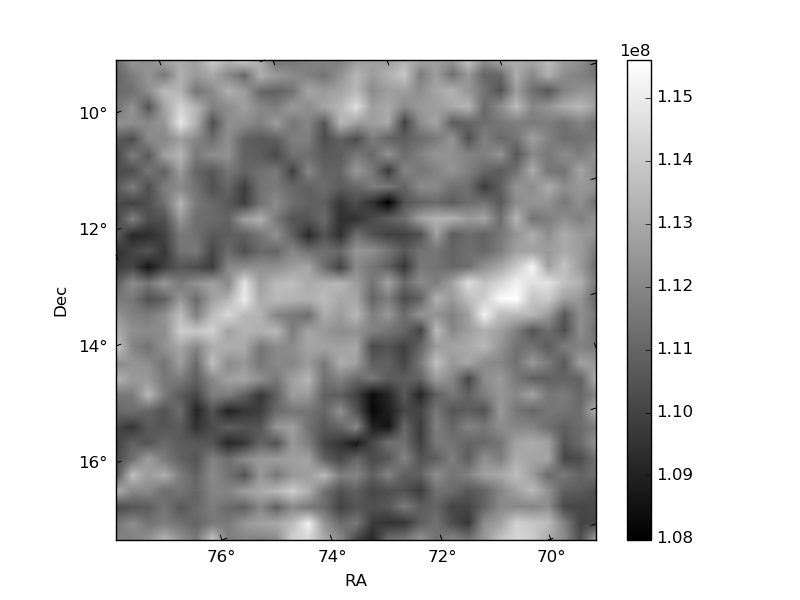
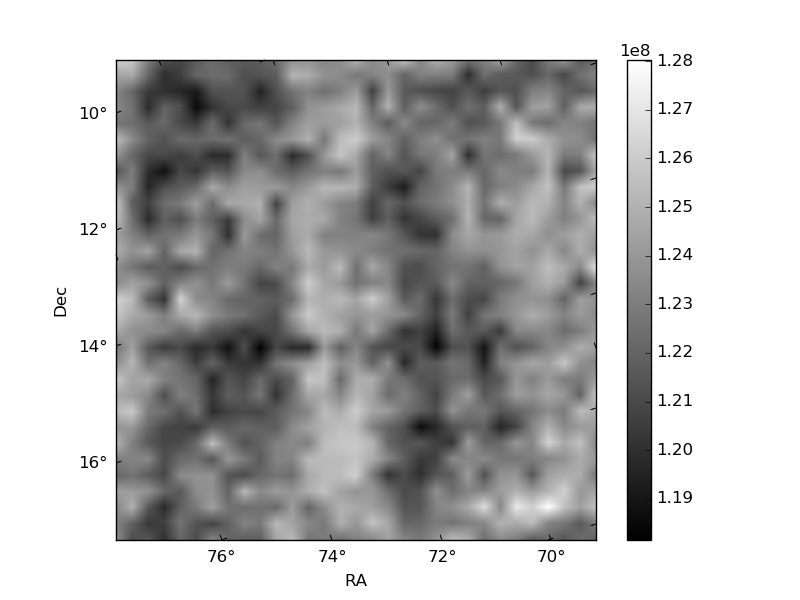
Histogram calculated using DETX and DETY for each event in the final _common_clean file
| Quadrant A | 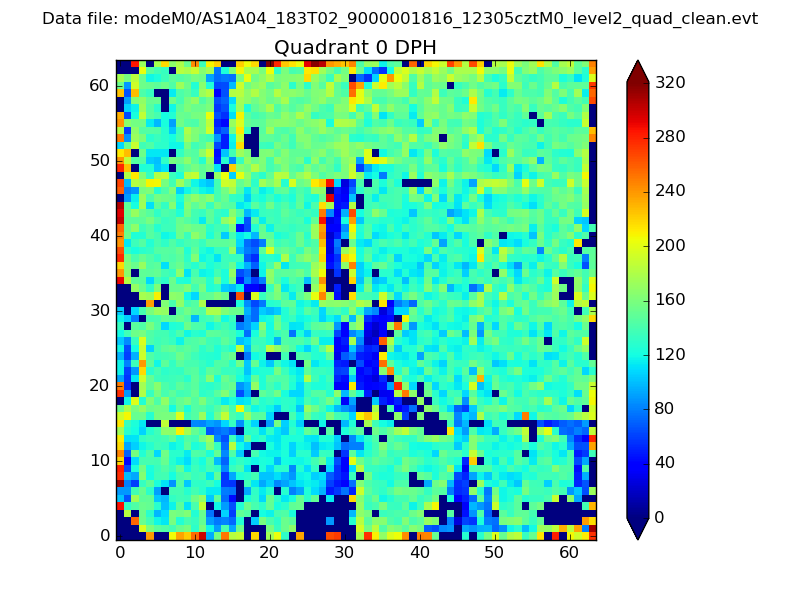 |
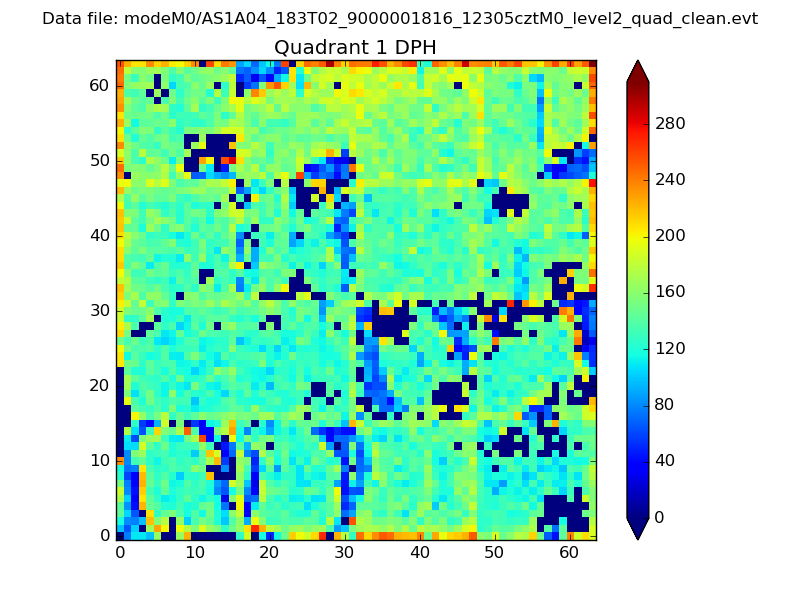 |
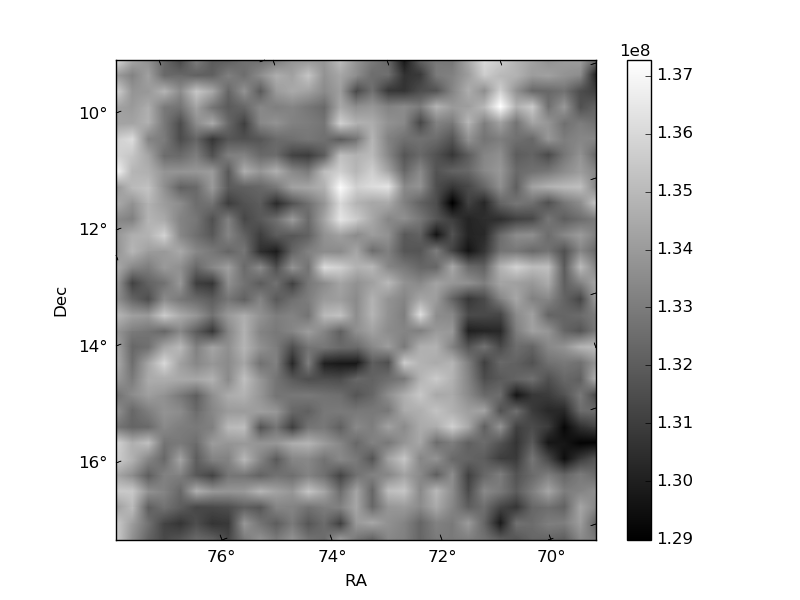
Quadrant B |
|---|---|---|---|
| Quadrant D | 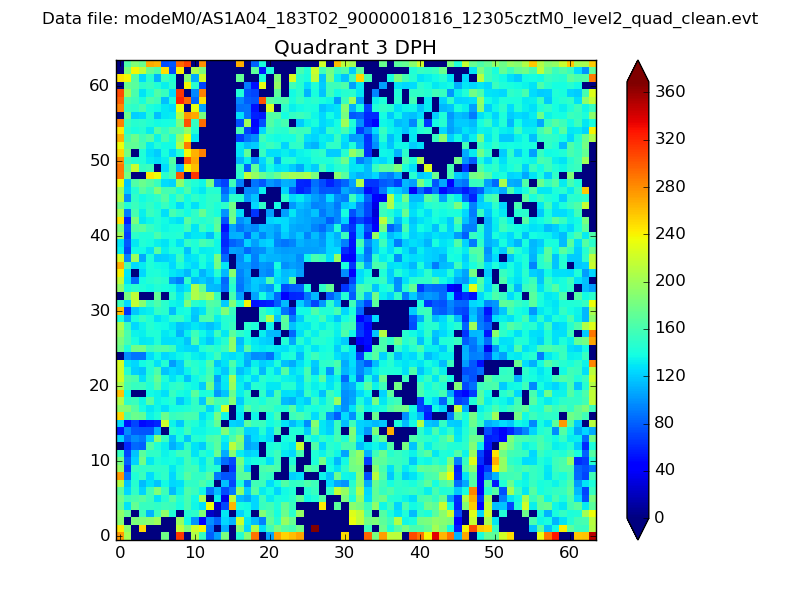 |
 |
Quadrant C |
| Plot type | Count rate plots | Images |
|---|---|---|
| Comparison with Poisson distribution Blue bars denote a histogram of data divided into 1 sec bins. Red curve is a Poisson curve with rate = median count rate of data. |
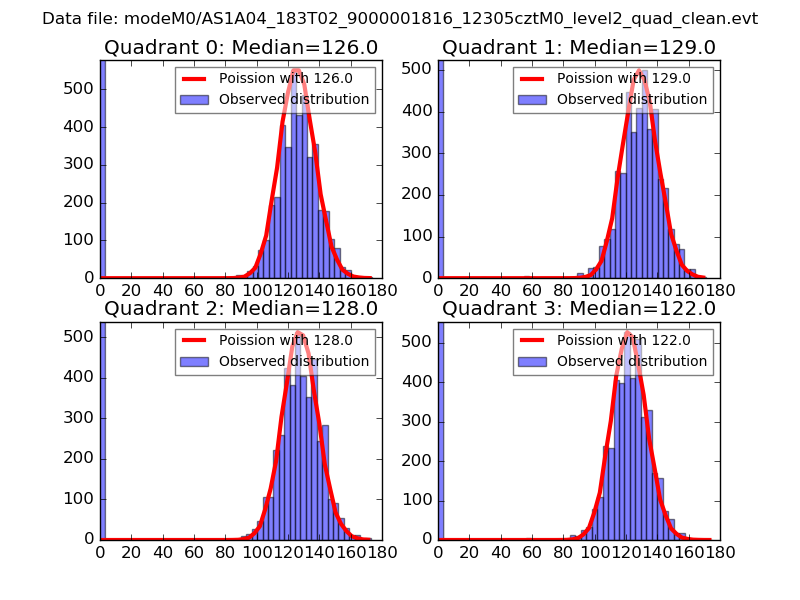 |
 |
| Quadrant-wise count rates Data is divided into 100 sec bins |
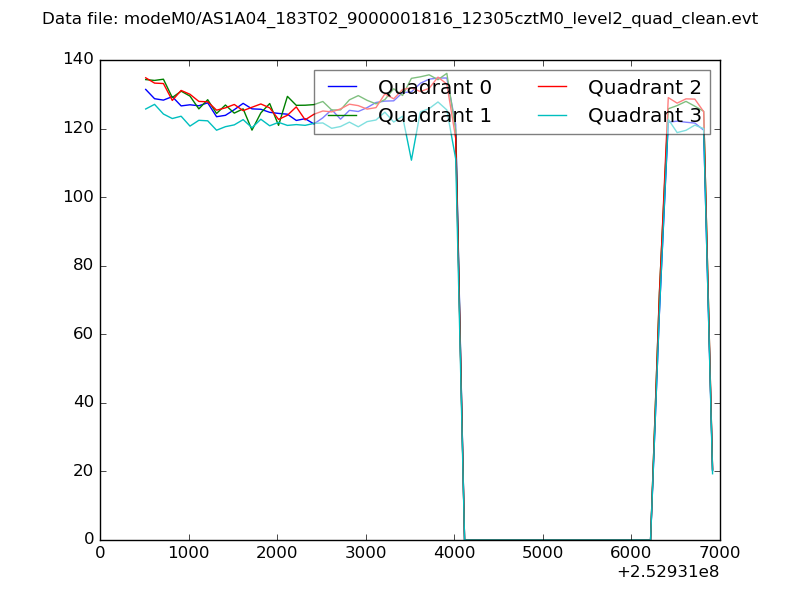 |
|
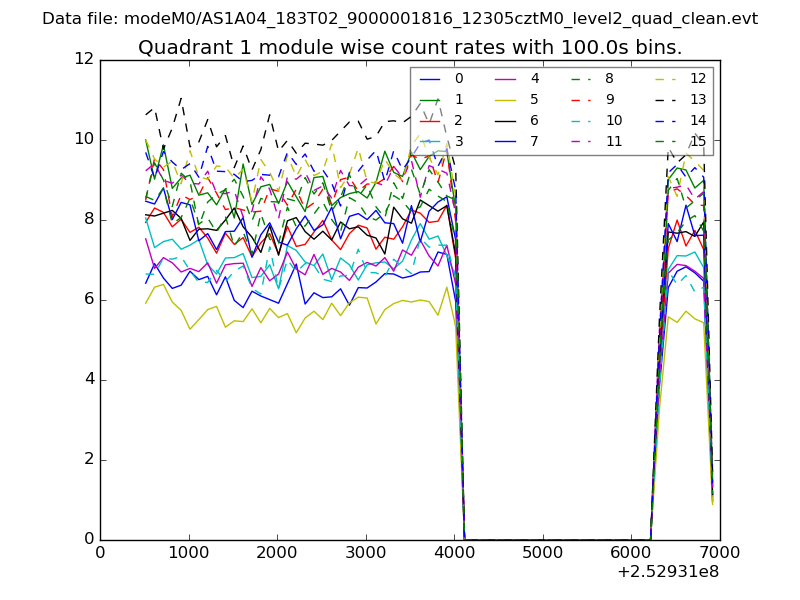
| Module-wise count rates for Quadrant A Data is divided into 100 sec bins |
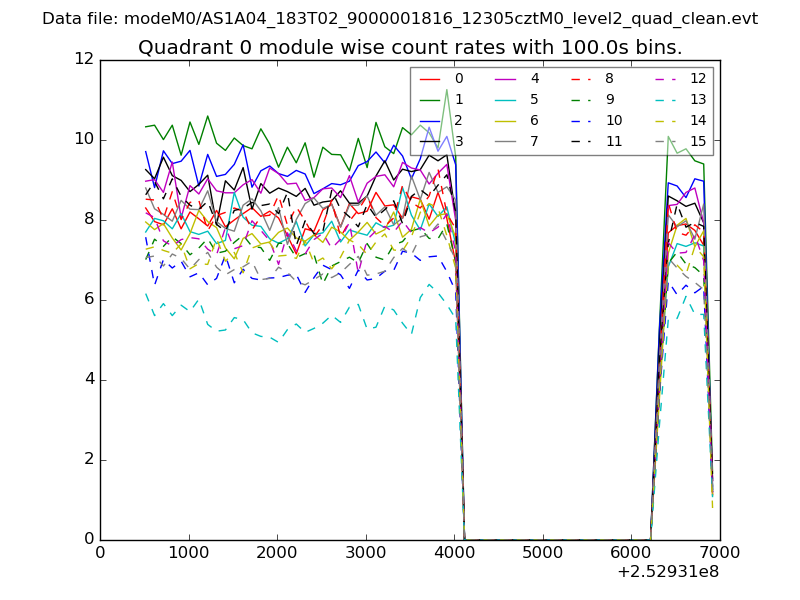 |
 |
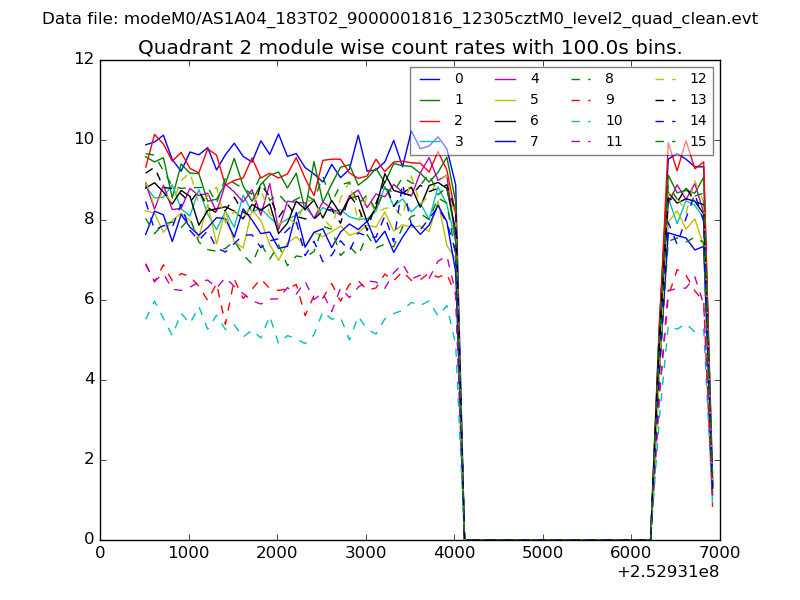
| Module-wise count rates for Quadrant B Data is divided into 100 sec bins |
 |
 |
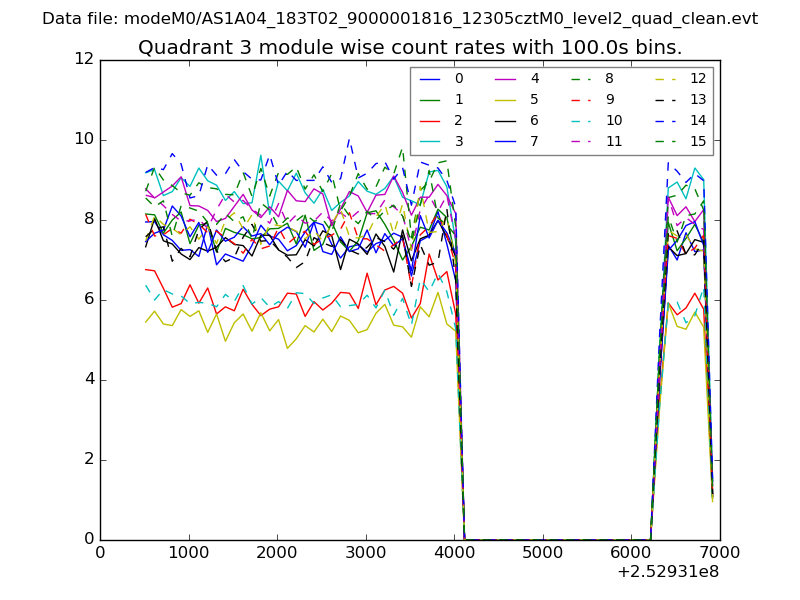
| Module-wise count rates for Quadrant C Data is divided into 100 sec bins |
 |
 |
| Module-wise count rates for Quadrant D Data is divided into 100 sec bins |
 |
 |
| Parameter | Plot |
|---|---|
| CZT HV Monitor | 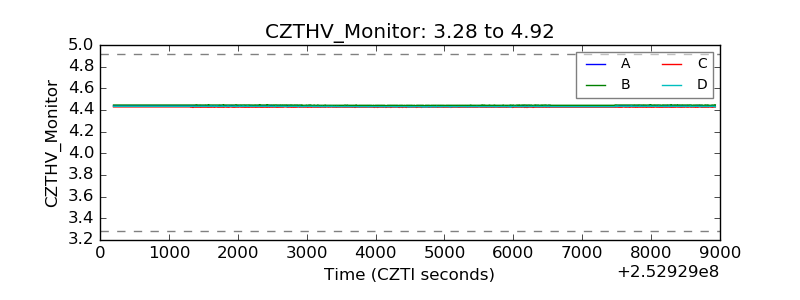 |
| D_VDD | 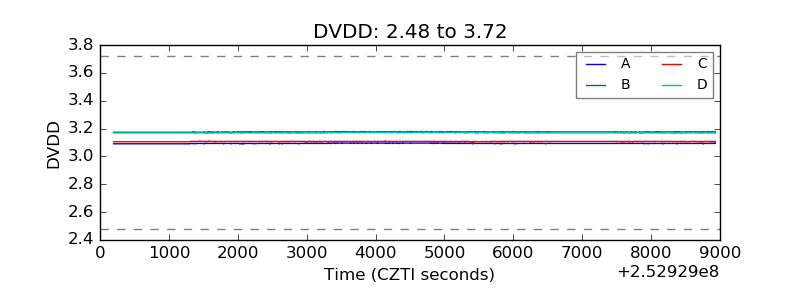 |
| Temperature 1 | 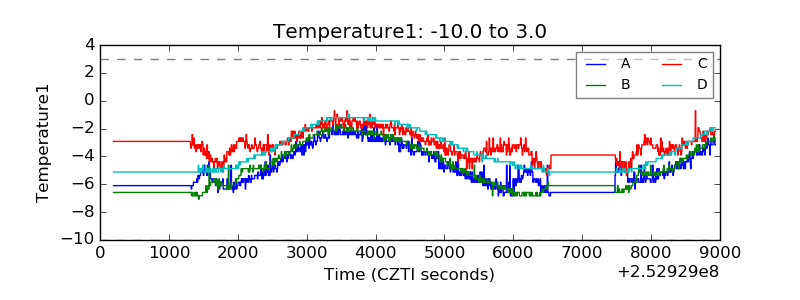 |
| Veto HV Monitor | 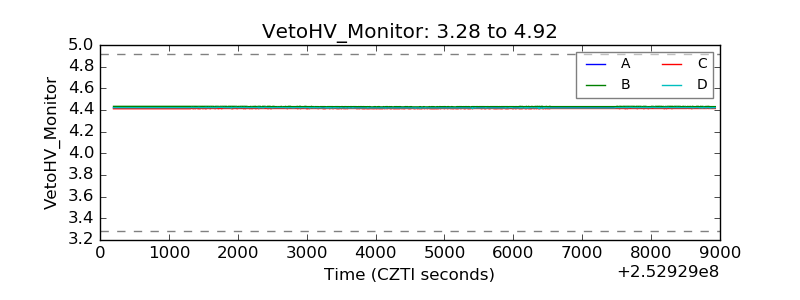 |
| Veto LLD | 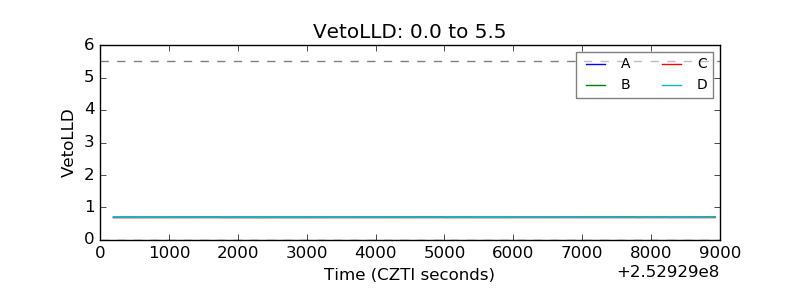 |
| Alpha Counter | 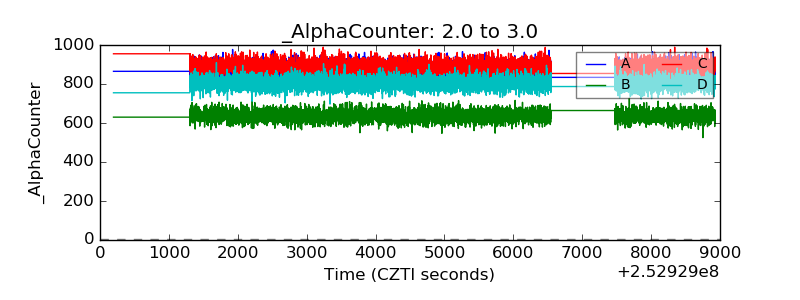 |
| _CPM_Rate | 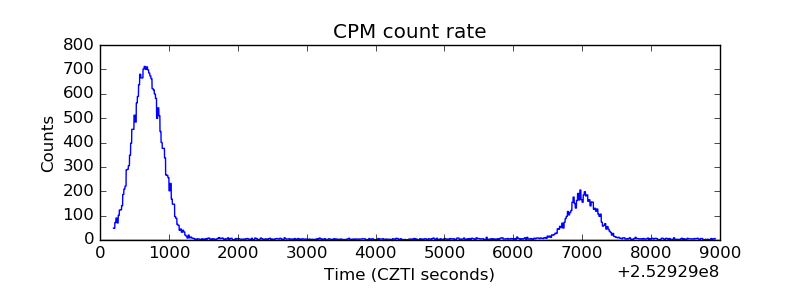 |
| CZT Counter | 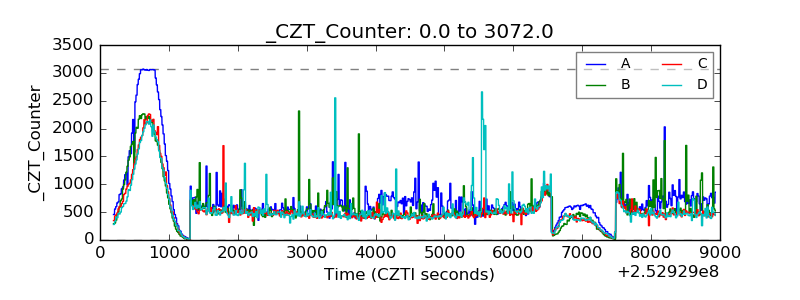 |
| +2.5 Volts monitor |  |
| +5 Volts monitor |  |
| _ROLL_ROT | 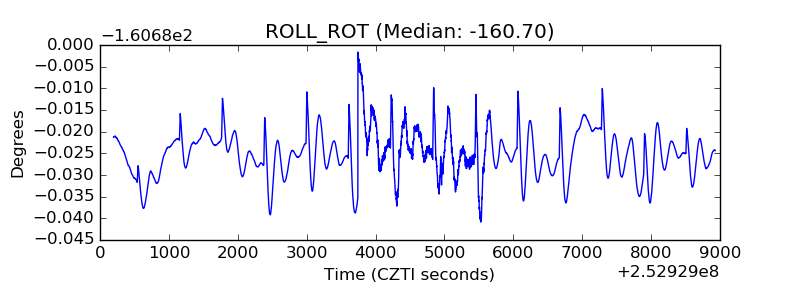 |
| _Roll_DEC | 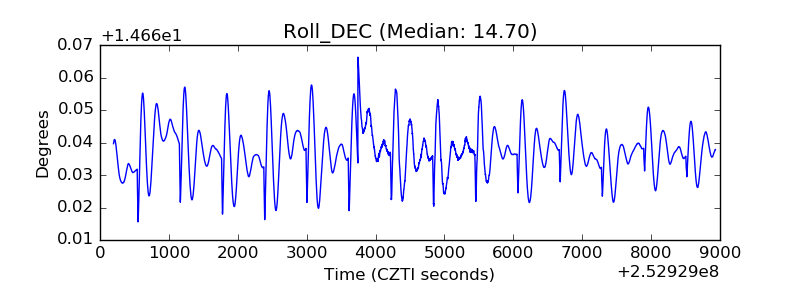 |
| _Roll_RA | 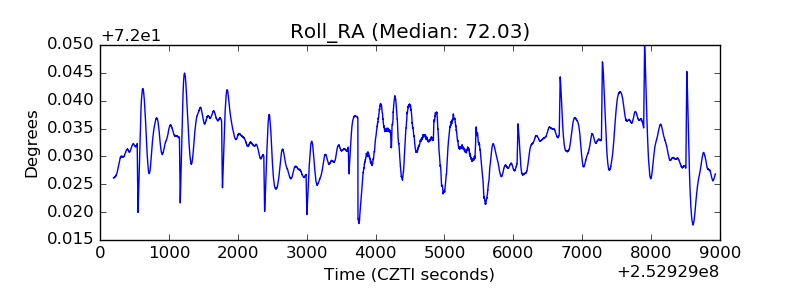 |
| Veto Counter | 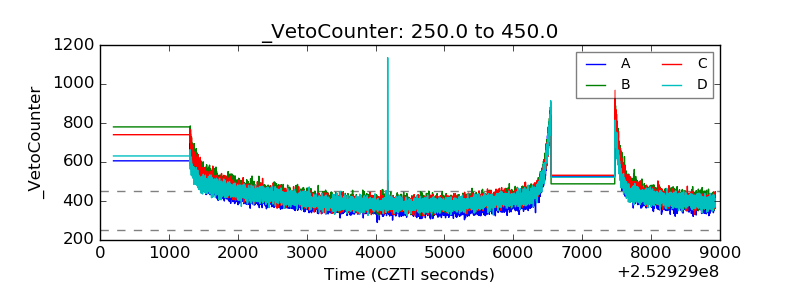 |