| Param | Original file | Final file |
|---|---|---|
| Filename | modeM0/AS1A04_183T02_9000001816_12306cztM0_level2.evt | modeM0/AS1A04_183T02_9000001816_12306cztM0_level2_quad_clean.evt |
| Size (bytes) | 542,632,320 | 88,119,360 |
| Size | 517.5 MB | 84.0 MB |
| Events in quadrant A | 5,032,441 | 546,107 |
| Events in quadrant B | 4,250,403 | 548,563 |
| Events in quadrant C | 3,104,785 | 567,664 |
| Events in quadrant D | 3,587,039 | 534,301 |
| Mode SS | |||
|---|---|---|---|
| Quadrant | BADHDUFLAG | Total packets | Discarded packets |
| A | 0 | 138 | 0 |
| B | 0 | 138 | 0 |
| C | 0 | 138 | 0 |
| D | 0 | 138 | 0 |
| Mode M9 | |||
|---|---|---|---|
| Quadrant | BADHDUFLAG | Total packets | Discarded packets |
| A | 0 | 6 | 0 |
| B | 0 | 6 | 0 |
| C | 0 | 6 | 0 |
| D | 0 | 6 | 0 |
| Mode M0 | |||
|---|---|---|---|
| Quadrant | BADHDUFLAG | Total packets | Discarded packets |
| A | 0 | 19647 | 2 |
| B | 0 | 16848 | 1 |
| C | 0 | 13834 | 1 |
| D | 0 | 15132 | 1 |
| Quadrant | Total seconds | Saturated seconds | Saturation percentage |
|---|---|---|---|
| A | 6767 | 189 | 2.792966% |
| B | 6767 | 355 | 5.246047% |
| C | 6767 | 26 | 0.384218% |
| D | 6767 | 163 | 2.408748% |
Noise dominated data is calculated using 1-second bins in cleaned event files. If a bin has >2000 counts, and if more than 50% of those come from <1% of pixels, then it is considered to be noise-dominated and hence unusable.
| Quadrant | # 1 sec bins | Bins with >0 counts | Bins with >2000 counts | High rate bins dominated by noise | Noise dominated (total time) | Noise dominated (detector-on time) | Marked lightcurve |
|---|---|---|---|---|---|---|---|
| A | 7393 | 6769 | 16 | 16 | 0.22% | 0.24% | 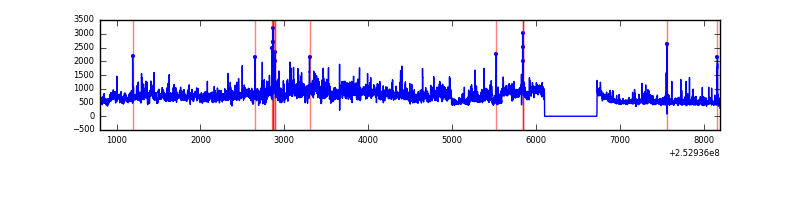 |
| B | 7393 | 6769 | 142 | 142 | 1.92% | 2.10% | 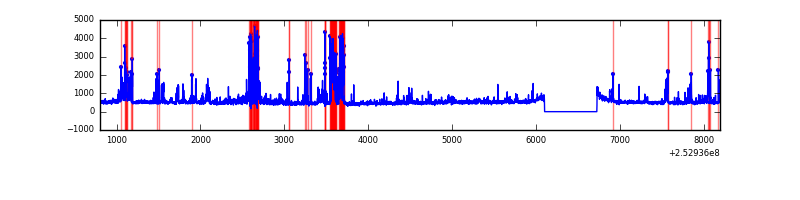 |
| C | 7393 | 6769 | 0 | 0 | 0.00% | 0.00% | 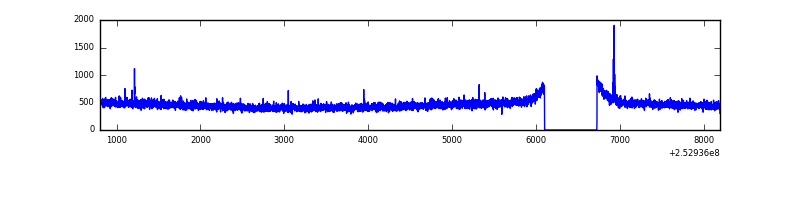 |
| D | 7393 | 6769 | 91 | 91 | 1.23% | 1.34% | 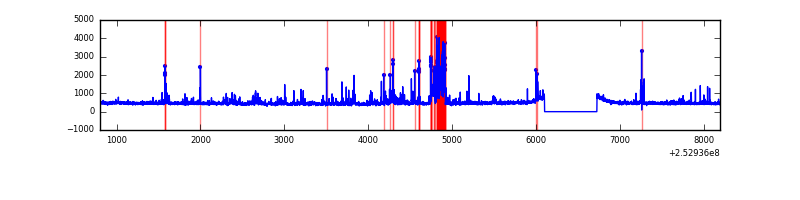 |
Top three noisy pixels from each quadrant. If the there are fewer than three noisy pixels in the level2.evt file, extra rows are filled as -1
| Pixel properties | Quadrant properties | ||||||
|---|---|---|---|---|---|---|---|
| Quadrant | DetID | PixID | Counts | Sigma | Mean | Median | Sigma |
| A | 11 | 29 | 1292811 | 7862.95 | 809 | 791 | 164.3 |
| A | 1 | 162 | 166861 | 1010.67 | 809 | 791 | 164.3 |
| A | 9 | 143 | 142710 | 863.69 | 809 | 791 | 164.3 |
| B | 4 | 239 | 723853 | 4711.57 | 802 | 783 | 153.5 |
| B | 0 | 85 | 125086 | 809.97 | 802 | 783 | 153.5 |
| B | 11 | 51 | 90652 | 585.59 | 802 | 783 | 153.5 |
| C | 14 | 234 | 11624 | 58.41 | 793 | 796 | 185.4 |
| C | 13 | 61 | 5798 | 26.98 | 793 | 796 | 185.4 |
| C | 4 | 254 | 2682 | 10.17 | 793 | 796 | 185.4 |
| D | 13 | 104 | 290905 | 1540.44 | 785 | 764 | 188.4 |
| D | 1 | 52 | 86975 | 457.72 | 785 | 764 | 188.4 |
| D | 7 | 71 | 52738 | 275.94 | 785 | 764 | 188.4 |
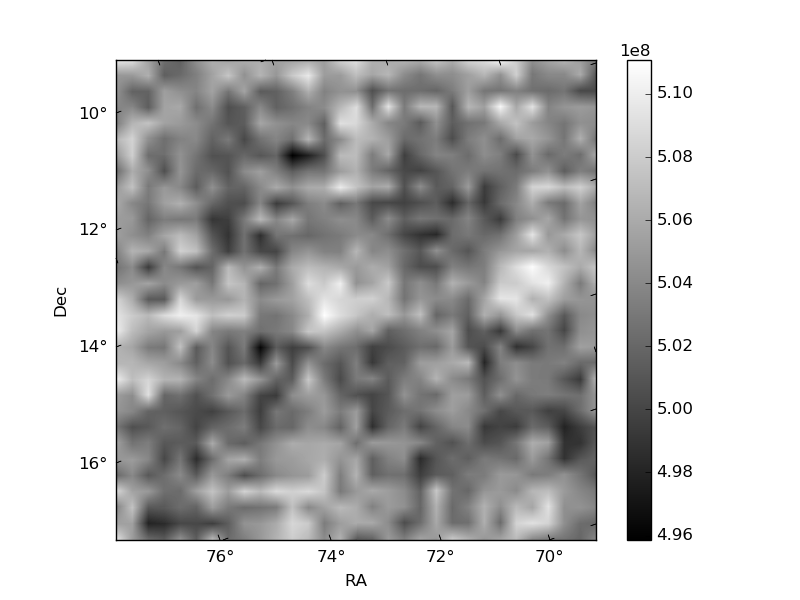
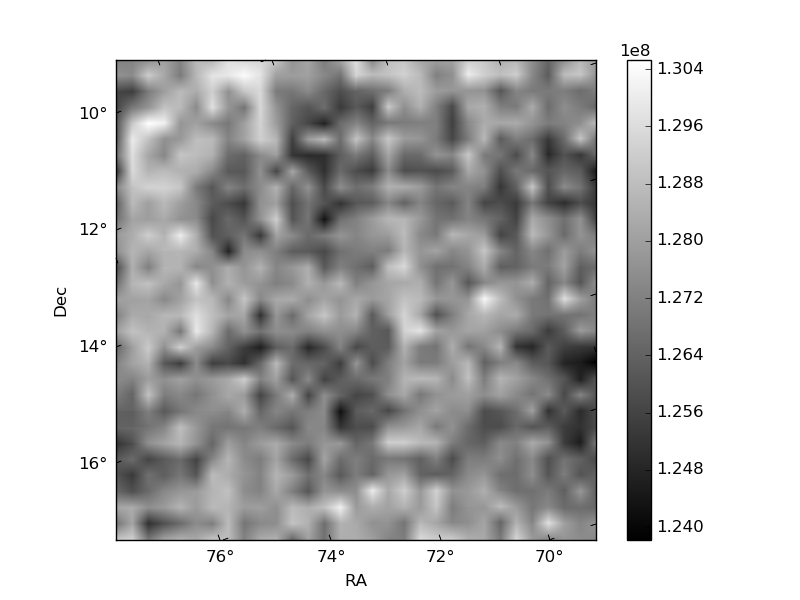
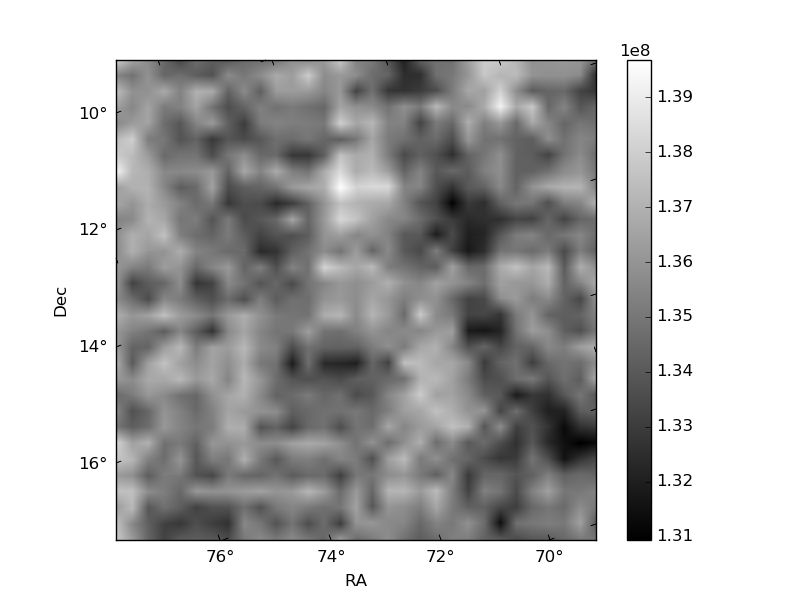
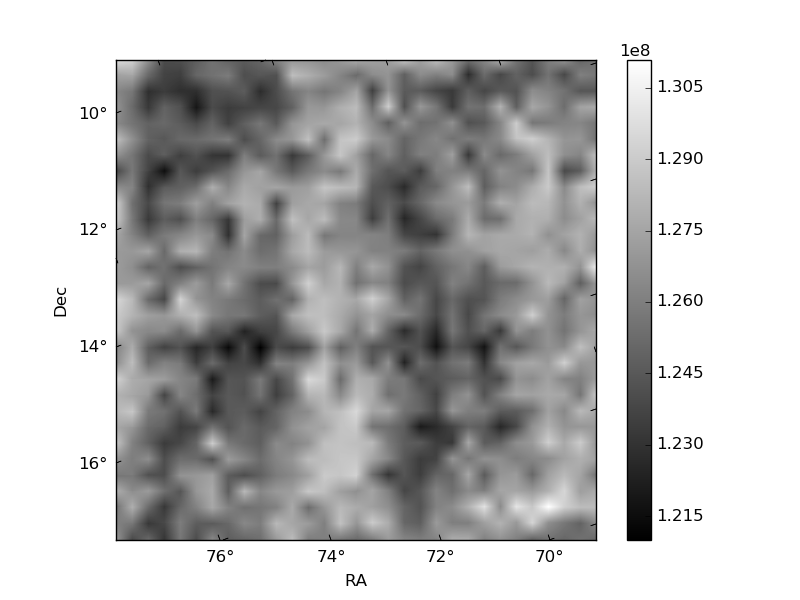
Histogram calculated using DETX and DETY for each event in the final _common_clean file
| Quadrant A | 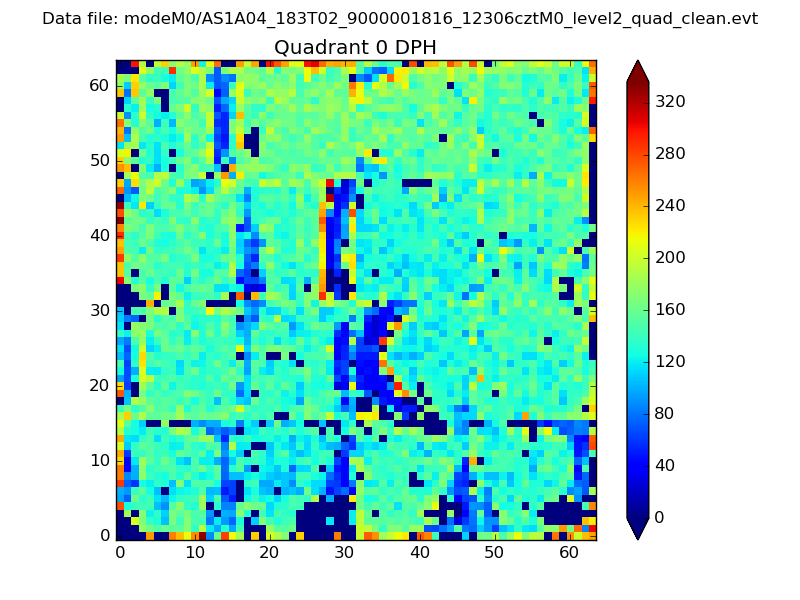 |
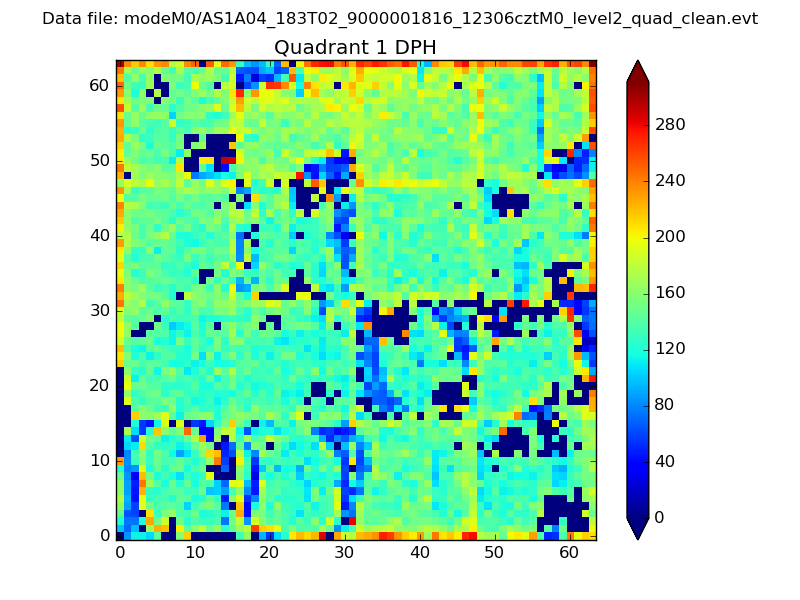 |
Quadrant B |
|---|---|---|---|
| Quadrant D | 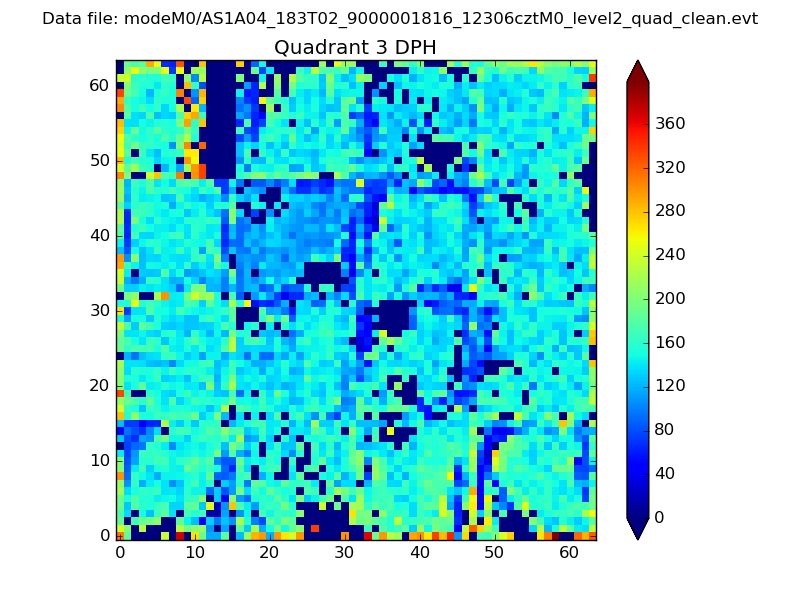 |
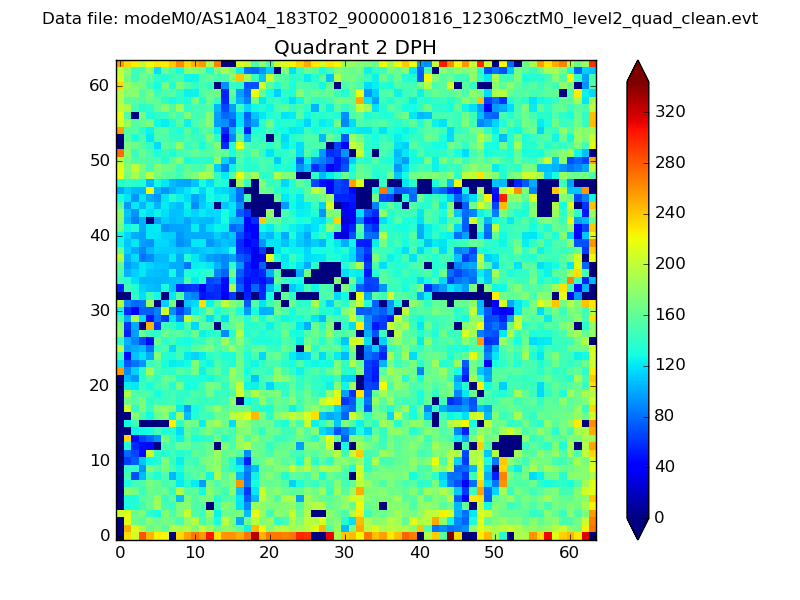 |
Quadrant C |
| Plot type | Count rate plots | Images |
|---|---|---|
| Comparison with Poisson distribution Blue bars denote a histogram of data divided into 1 sec bins. Red curve is a Poisson curve with rate = median count rate of data. |
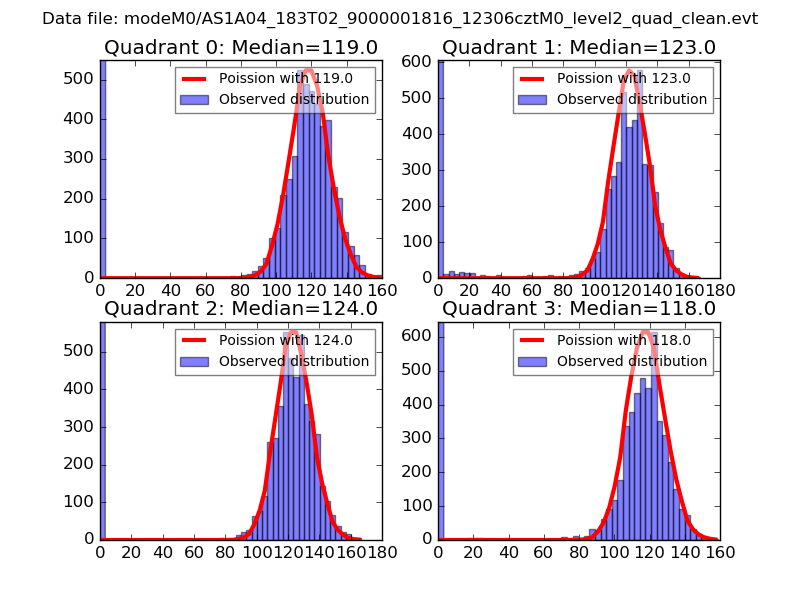 |
 |
| Quadrant-wise count rates Data is divided into 100 sec bins |
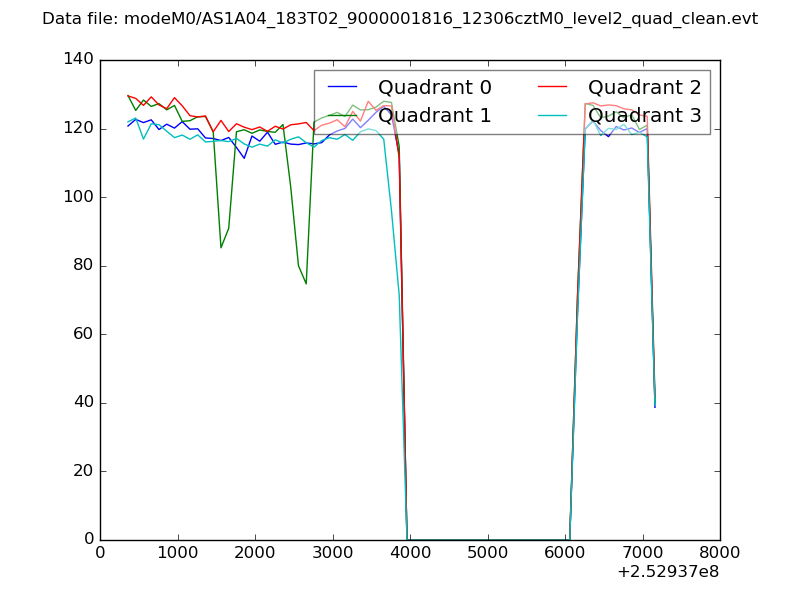 |
|
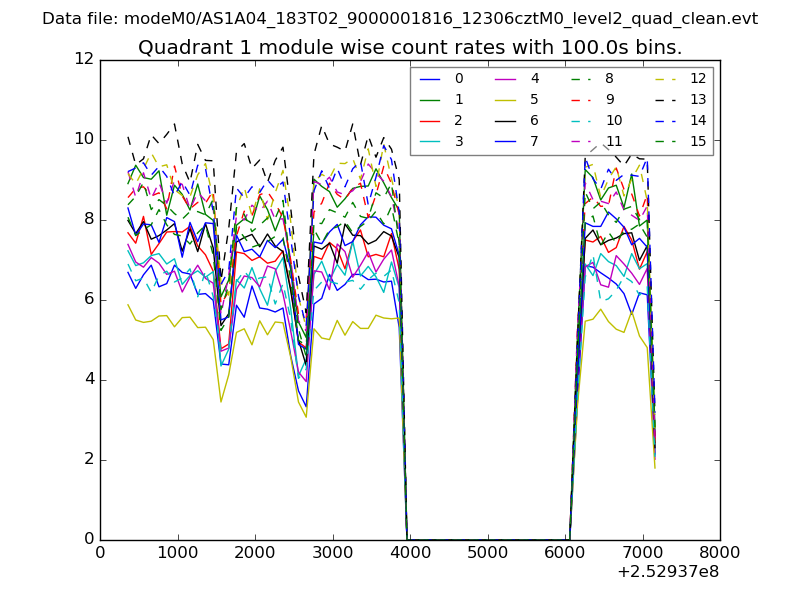
| Module-wise count rates for Quadrant A Data is divided into 100 sec bins |
 |
 |
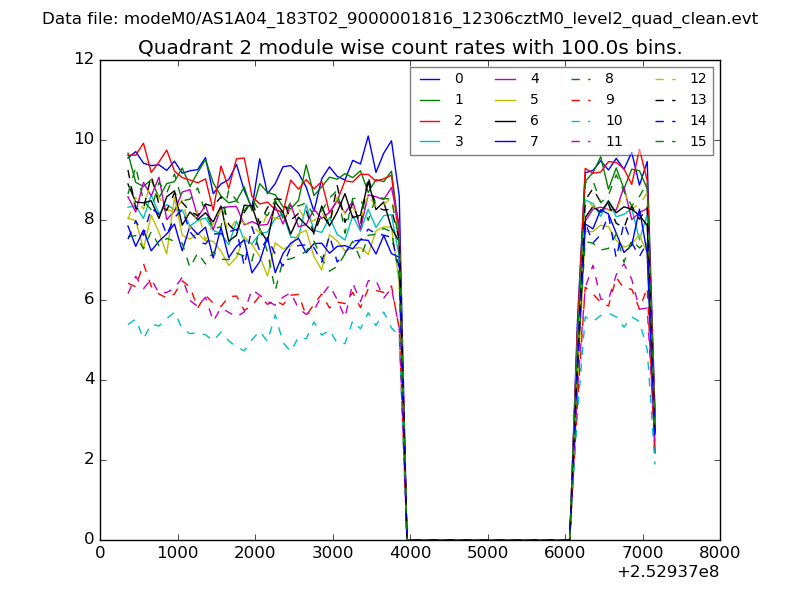
| Module-wise count rates for Quadrant B Data is divided into 100 sec bins |
 |
 |
| Module-wise count rates for Quadrant C Data is divided into 100 sec bins |
 |
 |
| Module-wise count rates for Quadrant D Data is divided into 100 sec bins |
 |
 |
| Parameter | Plot |
|---|---|
| CZT HV Monitor | 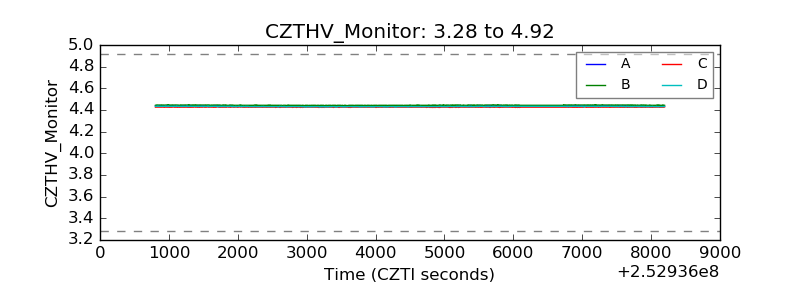 |
| D_VDD | 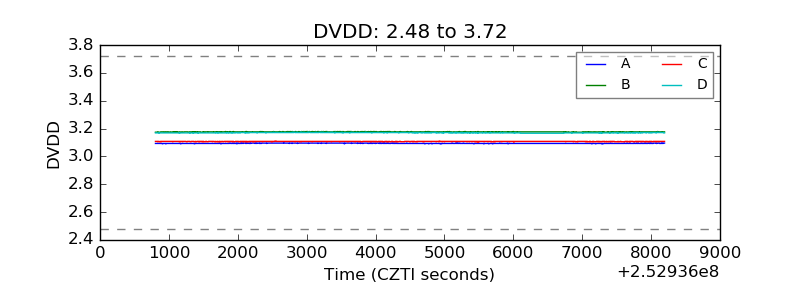 |
| Temperature 1 |  |
| Veto HV Monitor | 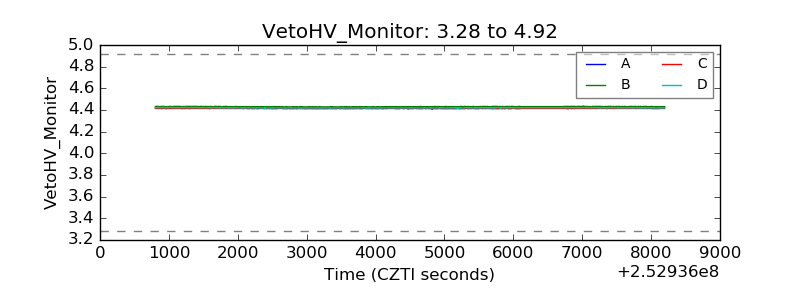 |
| Veto LLD | 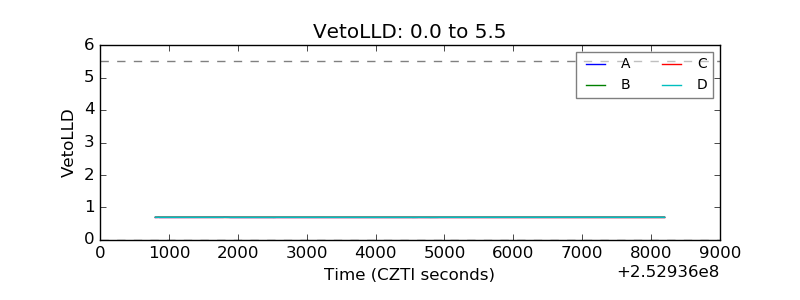 |
| Alpha Counter | 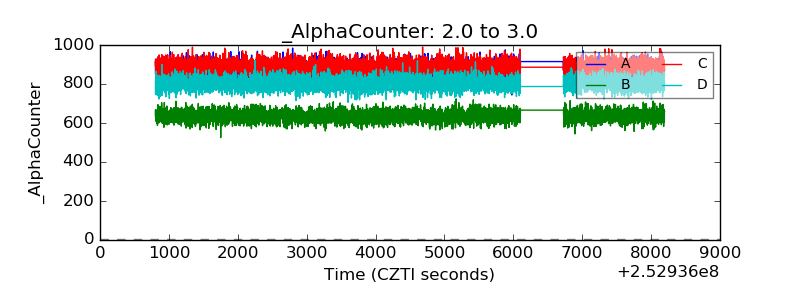 |
| _CPM_Rate | 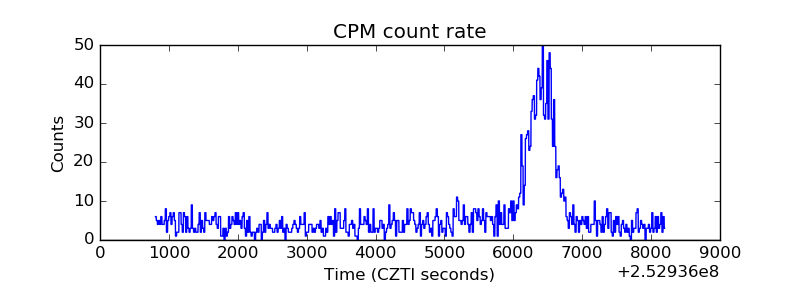 |
| CZT Counter | 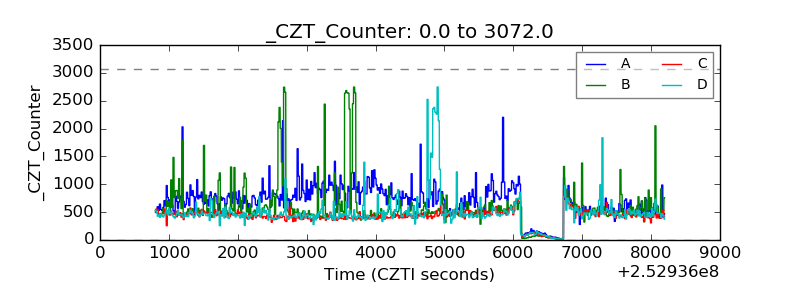 |
| +2.5 Volts monitor |  |
| +5 Volts monitor |  |
| _ROLL_ROT |  |
| _Roll_DEC |  |
| _Roll_RA | 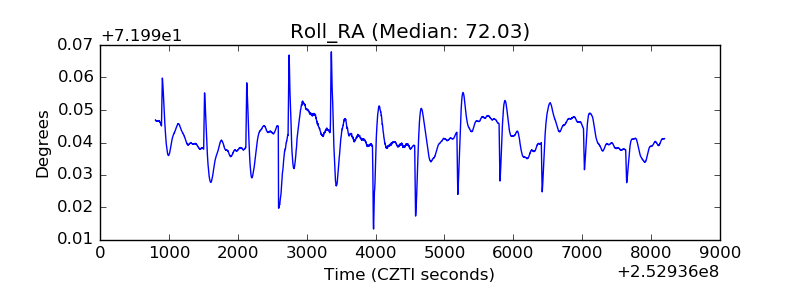 |
| Veto Counter |  |