| Param | Original file | Final file |
|---|---|---|
| Filename | modeM0/AS1A04_183T02_9000001816_12308cztM0_level2.evt | modeM0/AS1A04_183T02_9000001816_12308cztM0_level2_quad_clean.evt |
| Size (bytes) | 588,752,640 | 99,452,160 |
| Size | 561.5 MB | 94.8 MB |
| Events in quadrant A | 4,251,975 | 624,499 |
| Events in quadrant B | 4,288,230 | 629,182 |
| Events in quadrant C | 3,558,304 | 638,985 |
| Events in quadrant D | 5,217,987 | 591,663 |
| Mode SS | |||
|---|---|---|---|
| Quadrant | BADHDUFLAG | Total packets | Discarded packets |
| A | 0 | 154 | 0 |
| B | 0 | 154 | 0 |
| C | 0 | 154 | 0 |
| D | 0 | 154 | 0 |
| Mode M9 | |||
|---|---|---|---|
| Quadrant | BADHDUFLAG | Total packets | Discarded packets |
| A | 0 | 2 | 0 |
| B | 0 | 2 | 0 |
| C | 0 | 2 | 0 |
| D | 0 | 2 | 0 |
| Mode M0 | |||
|---|---|---|---|
| Quadrant | BADHDUFLAG | Total packets | Discarded packets |
| A | 0 | 17578 | 3 |
| B | 0 | 17716 | 2 |
| C | 0 | 15840 | 2 |
| D | 0 | 20439 | 2 |
| Quadrant | Total seconds | Saturated seconds | Saturation percentage |
|---|---|---|---|
| A | 7577 | 218 | 2.877128% |
| B | 7577 | 297 | 3.919757% |
| C | 7577 | 70 | 0.923848% |
| D | 7577 | 473 | 6.242576% |
Noise dominated data is calculated using 1-second bins in cleaned event files. If a bin has >2000 counts, and if more than 50% of those come from <1% of pixels, then it is considered to be noise-dominated and hence unusable.
| Quadrant | # 1 sec bins | Bins with >0 counts | Bins with >2000 counts | High rate bins dominated by noise | Noise dominated (total time) | Noise dominated (detector-on time) | Marked lightcurve |
|---|---|---|---|---|---|---|---|
| A | 7823 | 7579 | 3 | 3 | 0.04% | 0.04% | 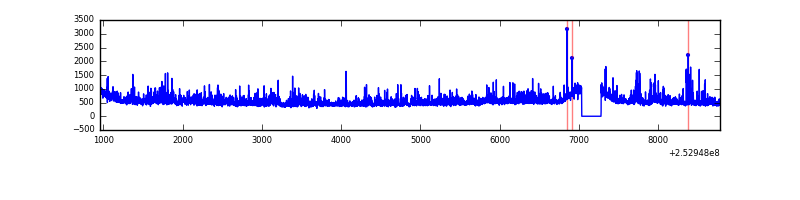 |
| B | 7823 | 7579 | 61 | 61 | 0.78% | 0.80% | 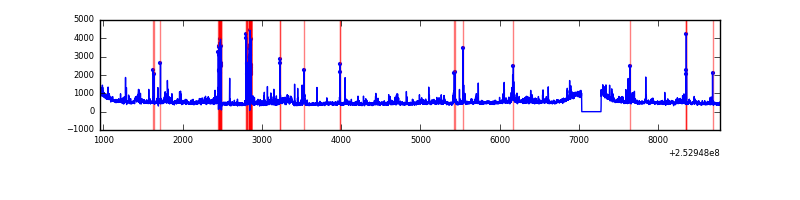 |
| C | 7823 | 7579 | 2 | 2 | 0.03% | 0.03% | 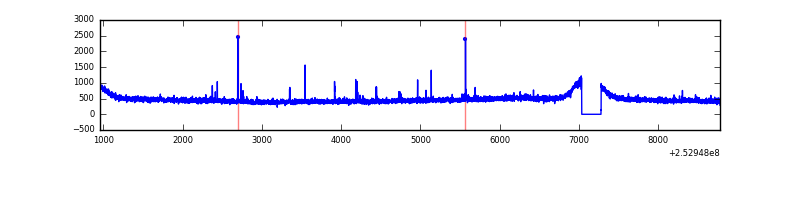 |
| D | 7823 | 7579 | 309 | 309 | 3.95% | 4.08% | 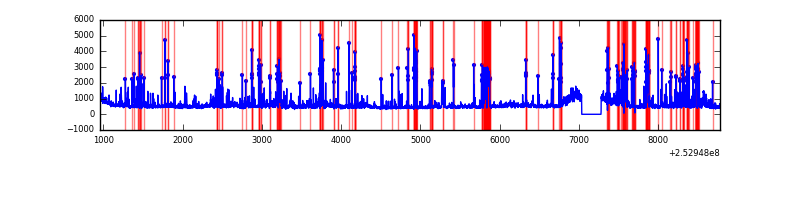 |
Top three noisy pixels from each quadrant. If the there are fewer than three noisy pixels in the level2.evt file, extra rows are filled as -1
| Pixel properties | Quadrant properties | ||||||
|---|---|---|---|---|---|---|---|
| Quadrant | DetID | PixID | Counts | Sigma | Mean | Median | Sigma |
| A | 1 | 162 | 223300 | 1160.24 | 924 | 905 | 191.7 |
| A | 1 | 178 | 129211 | 669.38 | 924 | 905 | 191.7 |
| A | 1 | 161 | 111213 | 575.48 | 924 | 905 | 191.7 |
| B | 4 | 239 | 450467 | 2513.16 | 917 | 892 | 178.9 |
| B | 0 | 190 | 47721 | 261.78 | 917 | 892 | 178.9 |
| B | 0 | 205 | 34456 | 187.63 | 917 | 892 | 178.9 |
| C | 4 | 254 | 40440 | 186.17 | 900 | 904 | 212.4 |
| C | 14 | 234 | 8272 | 34.69 | 900 | 904 | 212.4 |
| C | 13 | 61 | 6697 | 27.28 | 900 | 904 | 212.4 |
| D | 1 | 52 | 1100974 | 5221.67 | 876 | 852 | 210.7 |
| D | 5 | 222 | 401779 | 1902.98 | 876 | 852 | 210.7 |
| D | 8 | 195 | 88219 | 414.68 | 876 | 852 | 210.7 |
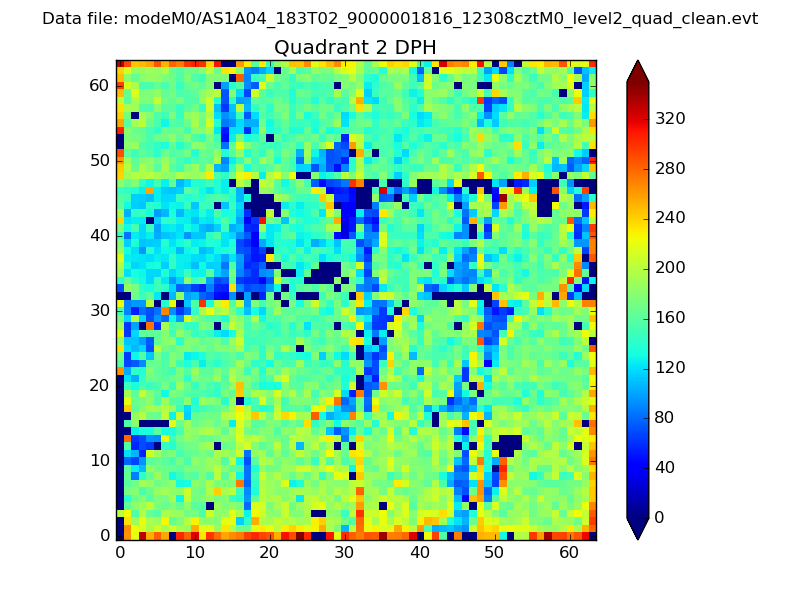
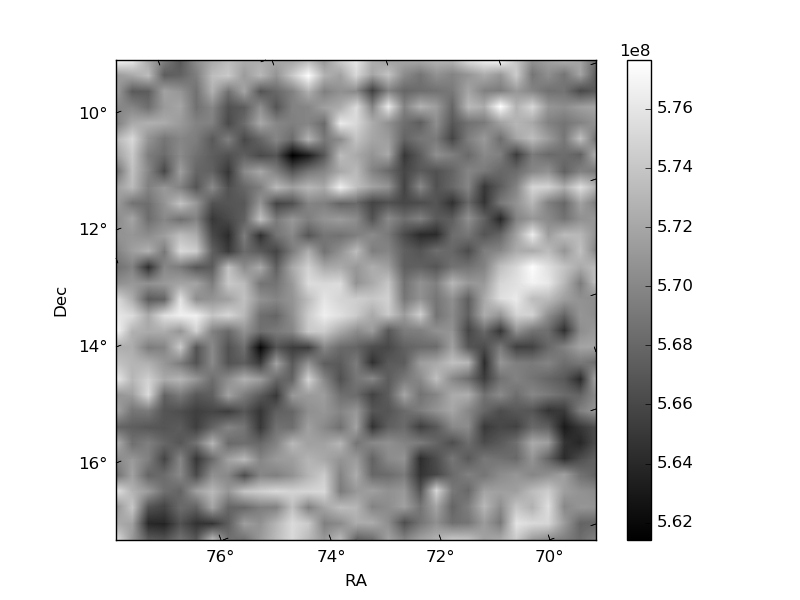
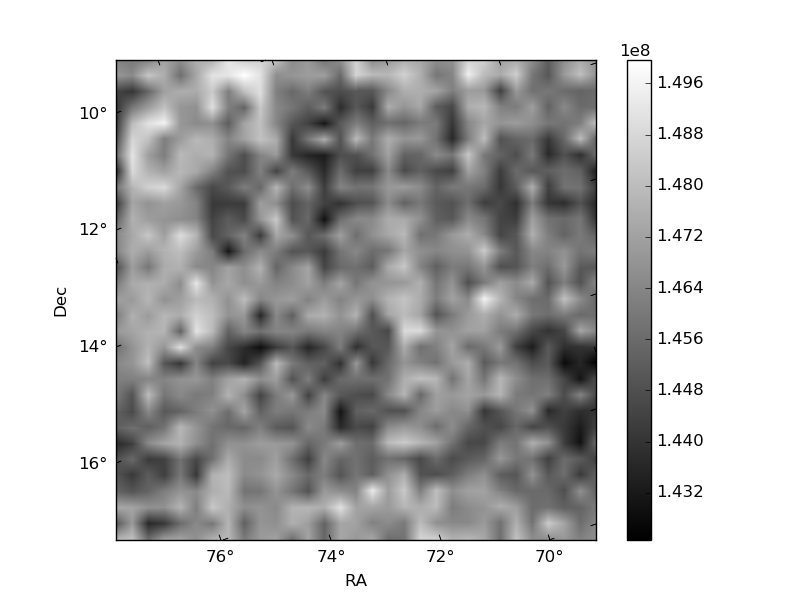
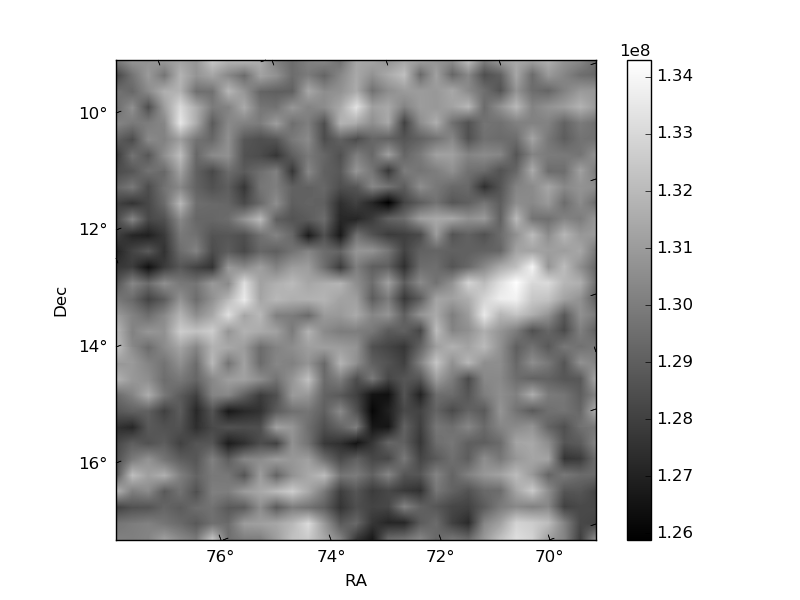
Histogram calculated using DETX and DETY for each event in the final _common_clean file
| Quadrant A | 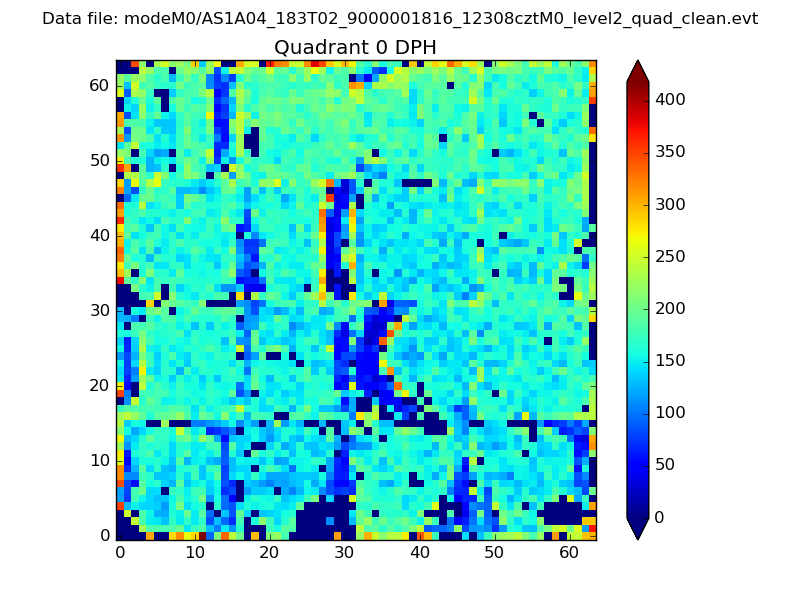 |
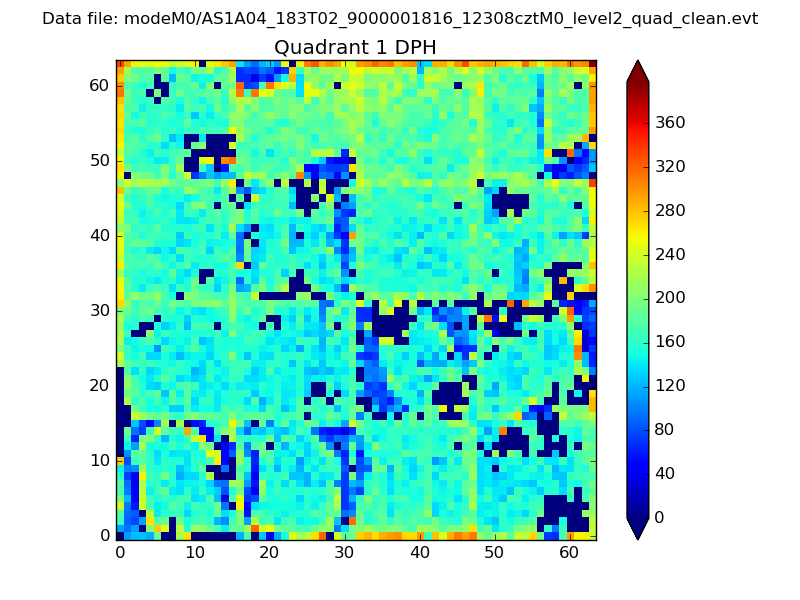 |
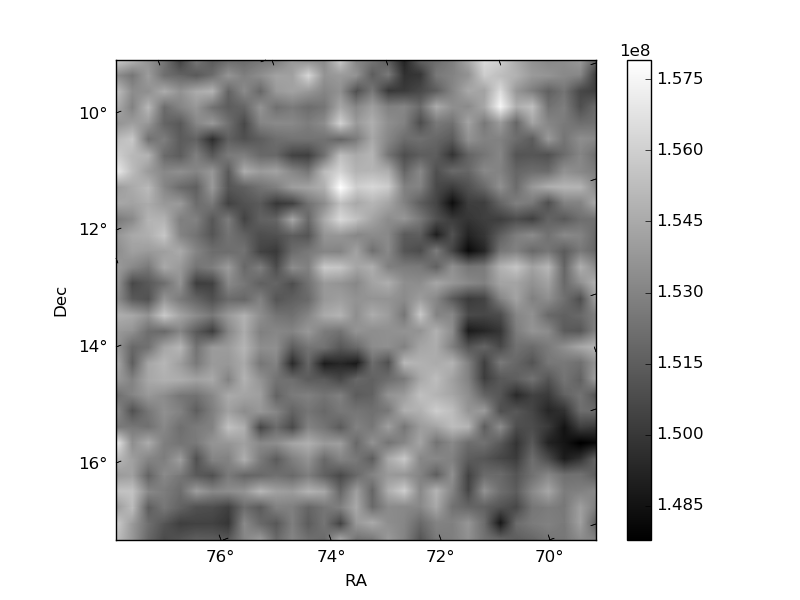
Quadrant B |
|---|---|---|---|
| Quadrant D | 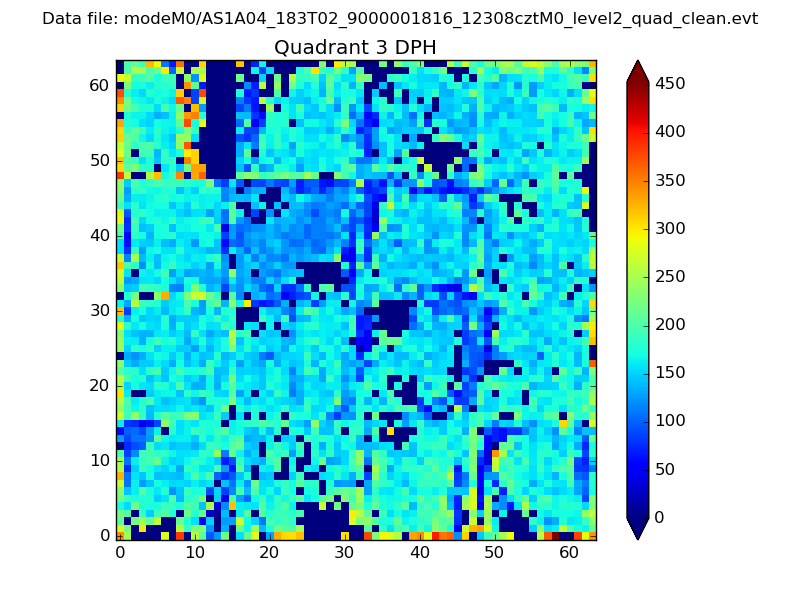 |
 |
Quadrant C |
| Plot type | Count rate plots | Images |
|---|---|---|
| Comparison with Poisson distribution Blue bars denote a histogram of data divided into 1 sec bins. Red curve is a Poisson curve with rate = median count rate of data. |
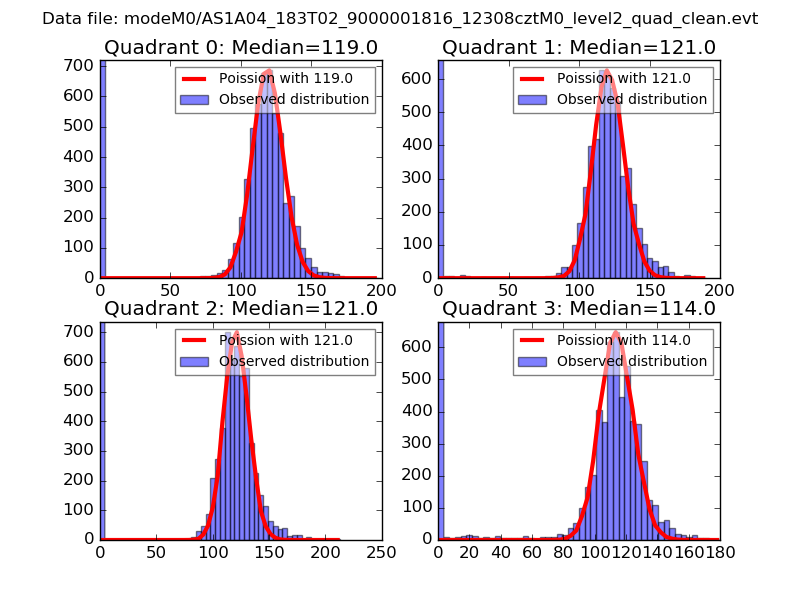 |
 |
| Quadrant-wise count rates Data is divided into 100 sec bins |
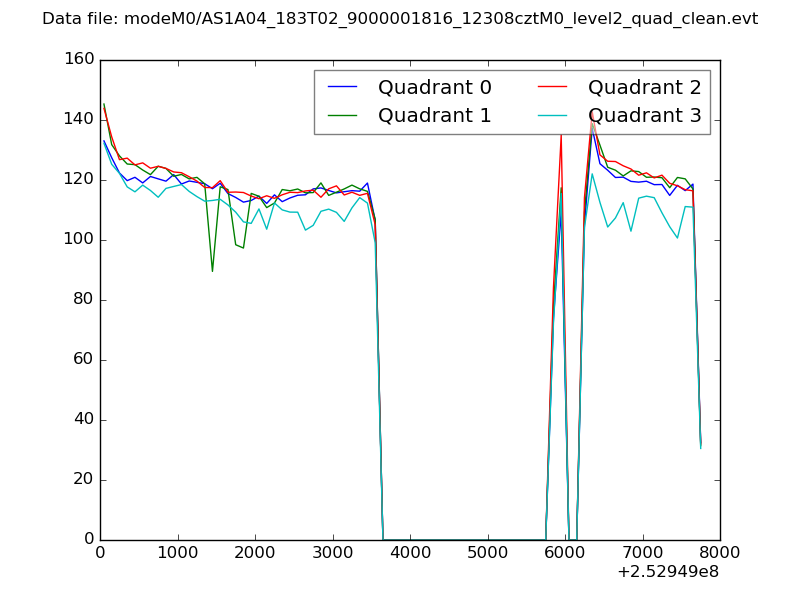 |
|
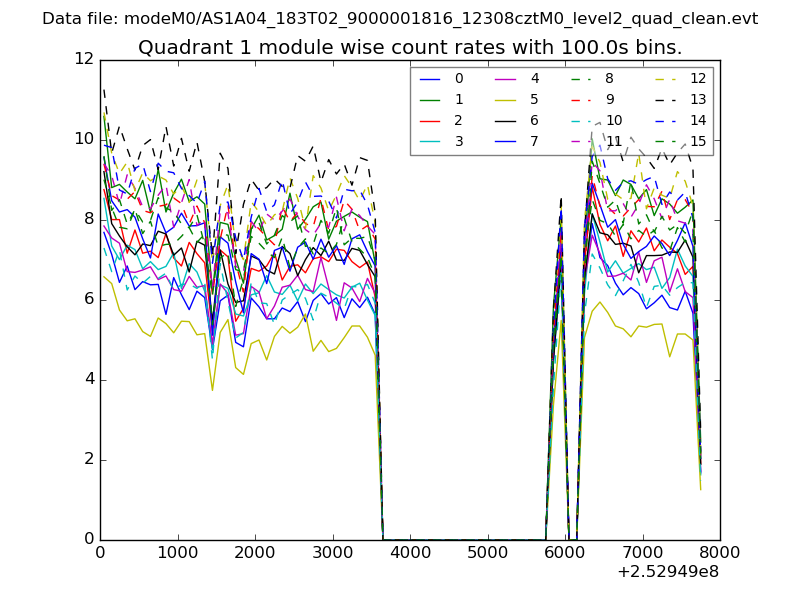
| Module-wise count rates for Quadrant A Data is divided into 100 sec bins |
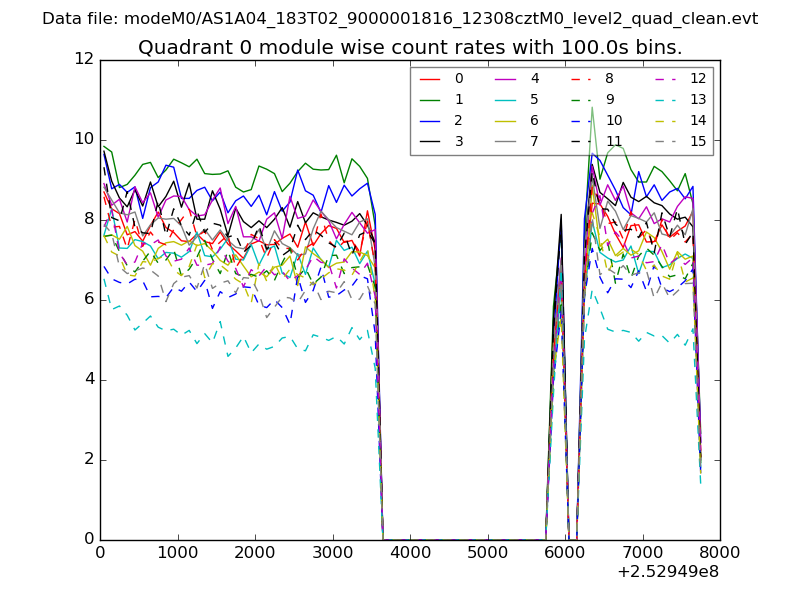 |
 |
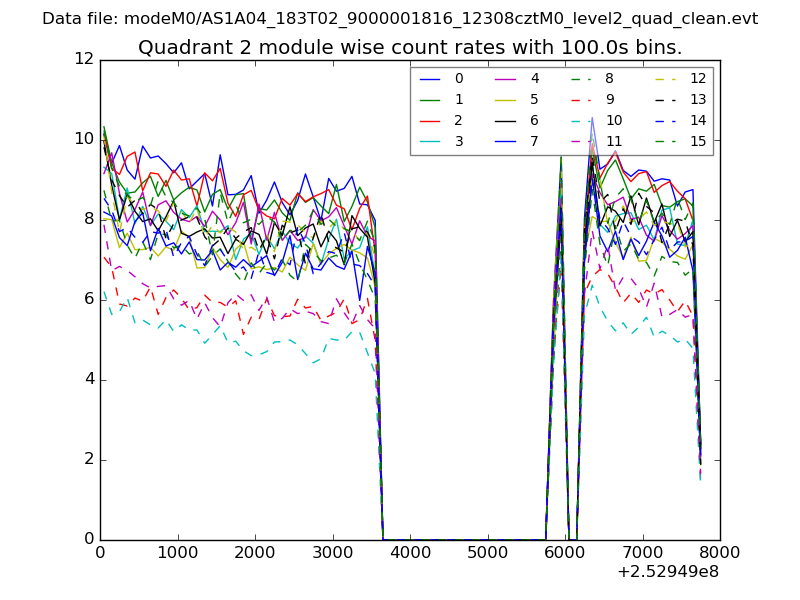
| Module-wise count rates for Quadrant B Data is divided into 100 sec bins |
 |
 |
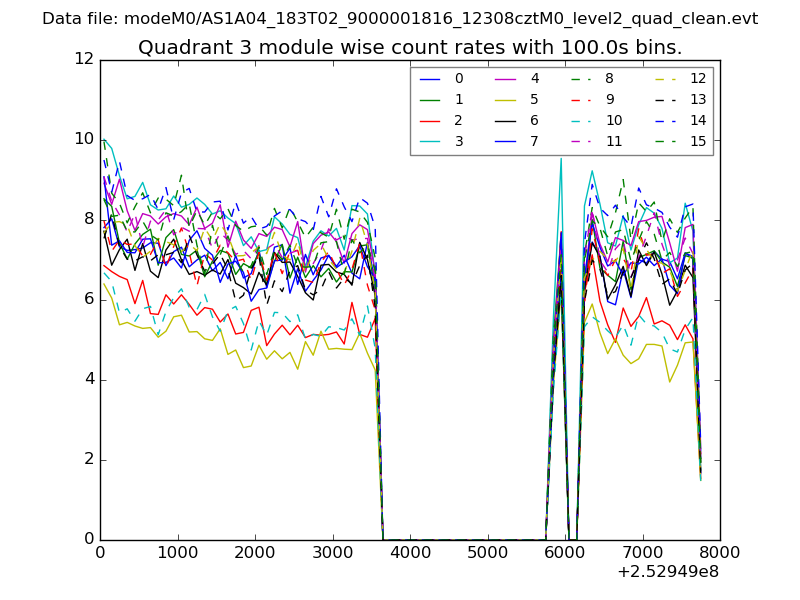
| Module-wise count rates for Quadrant C Data is divided into 100 sec bins |
 |
 |
| Module-wise count rates for Quadrant D Data is divided into 100 sec bins |
 |
 |
| Parameter | Plot |
|---|---|
| CZT HV Monitor |  |
| D_VDD | 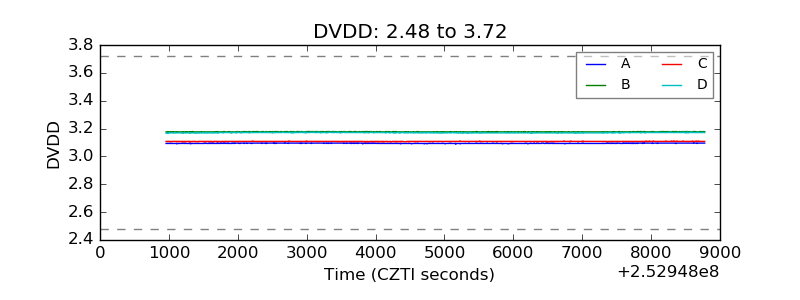 |
| Temperature 1 | 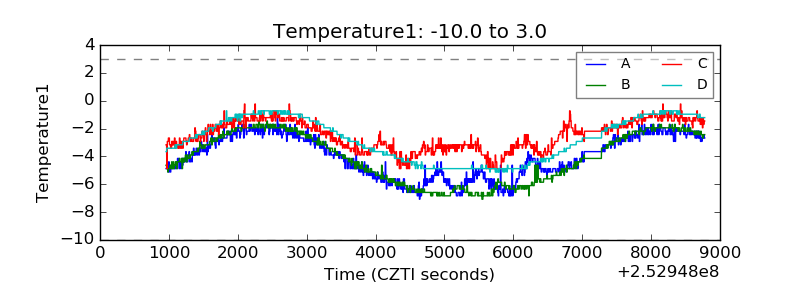 |
| Veto HV Monitor | 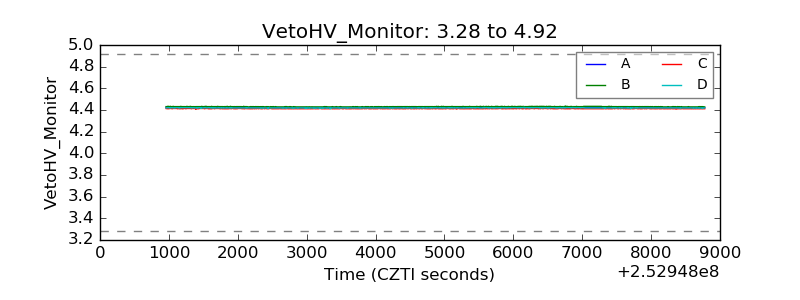 |
| Veto LLD | 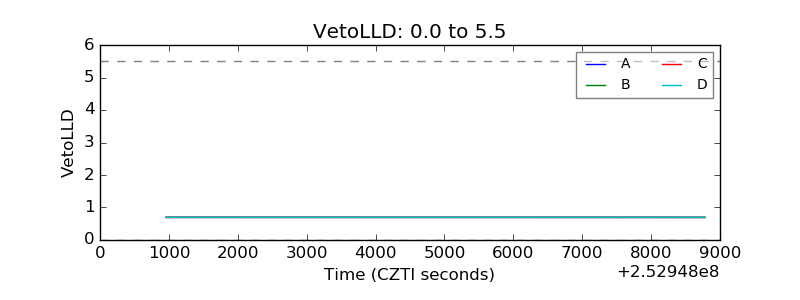 |
| Alpha Counter | 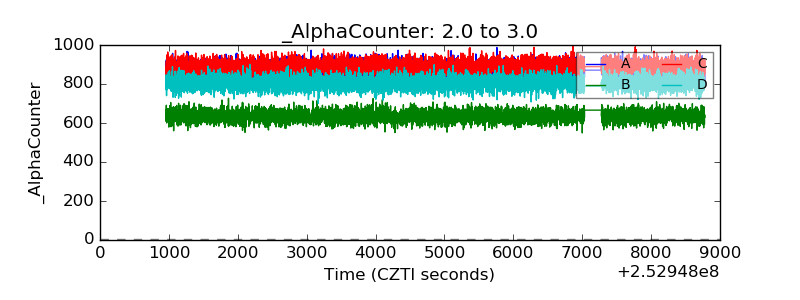 |
| _CPM_Rate | 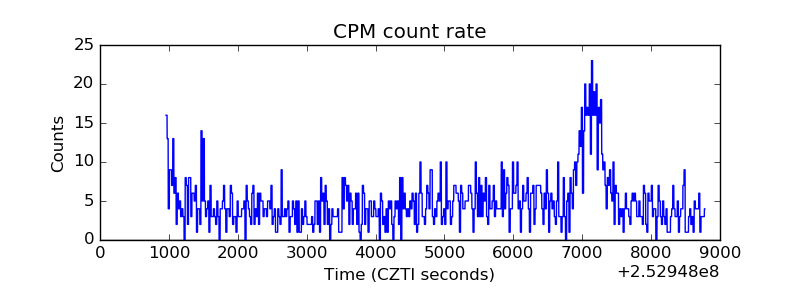 |
| CZT Counter | 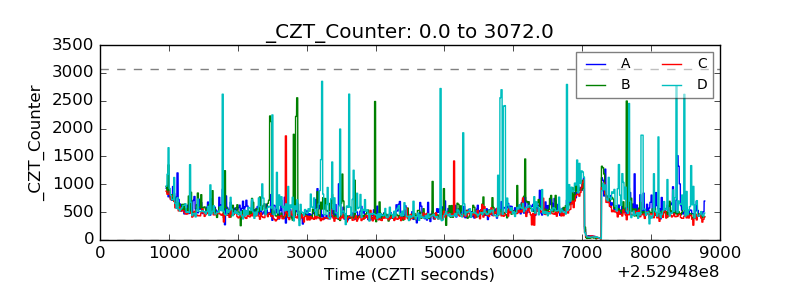 |
| +2.5 Volts monitor |  |
| +5 Volts monitor | 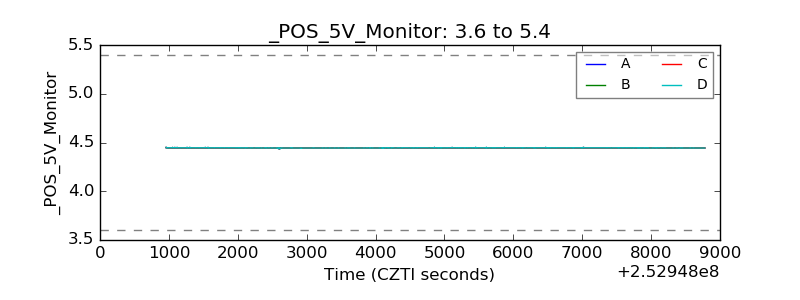 |
| _ROLL_ROT |  |
| _Roll_DEC | 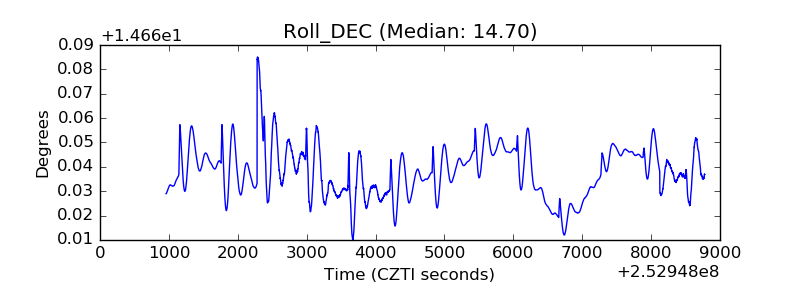 |
| _Roll_RA | 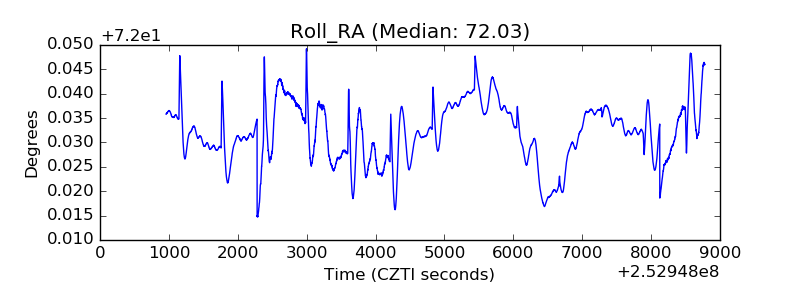 |
| Veto Counter | 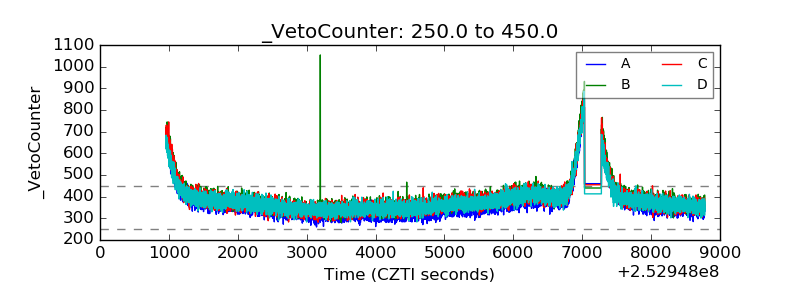 |