| Param | Original file | Final file |
|---|---|---|
| Filename | modeM0/AS1A04_183T02_9000001816_12311cztM0_level2.evt | modeM0/AS1A04_183T02_9000001816_12311cztM0_level2_quad_clean.evt |
| Size (bytes) | 1,321,689,600 | 229,515,840 |
| Size | 1.2 GB | 218.9 MB |
| Events in quadrant A | 10,188,395 | 1,418,235 |
| Events in quadrant B | 9,623,798 | 1,446,510 |
| Events in quadrant C | 8,401,699 | 1,445,885 |
| Events in quadrant D | 10,556,104 | 1,358,271 |
| Mode SS | |||
|---|---|---|---|
| Quadrant | BADHDUFLAG | Total packets | Discarded packets |
| A | 0 | 376 | 0 |
| B | 0 | 376 | 0 |
| C | 0 | 376 | 0 |
| D | 0 | 376 | 0 |
| Mode M9 | |||
|---|---|---|---|
| Quadrant | BADHDUFLAG | Total packets | Discarded packets |
| A | 0 | 19 | 0 |
| B | 0 | 19 | 0 |
| C | 0 | 19 | 0 |
| D | 0 | 19 | 0 |
| Mode M0 | |||
|---|---|---|---|
| Quadrant | BADHDUFLAG | Total packets | Discarded packets |
| A | 0 | 42655 | 4 |
| B | 0 | 40792 | 3 |
| C | 0 | 38058 | 3 |
| D | 0 | 44240 | 3 |
| Quadrant | Total seconds | Saturated seconds | Saturation percentage |
|---|---|---|---|
| A | 18615 | 297 | 1.595488% |
| B | 18615 | 278 | 1.493419% |
| C | 18615 | 94 | 0.504969% |
| D | 18615 | 476 | 2.557078% |
Noise dominated data is calculated using 1-second bins in cleaned event files. If a bin has >2000 counts, and if more than 50% of those come from <1% of pixels, then it is considered to be noise-dominated and hence unusable.
| Quadrant | # 1 sec bins | Bins with >0 counts | Bins with >2000 counts | High rate bins dominated by noise | Noise dominated (total time) | Noise dominated (detector-on time) | Marked lightcurve |
|---|---|---|---|---|---|---|---|
| A | 20426 | 18619 | 22 | 22 | 0.11% | 0.12% | 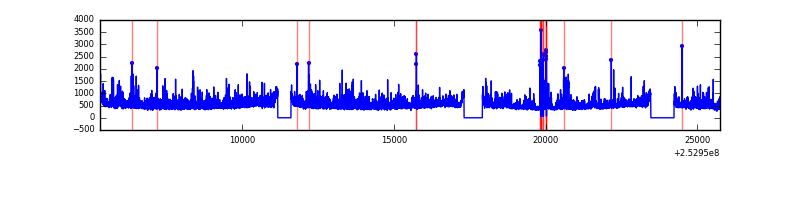 |
| B | 20426 | 18619 | 34 | 34 | 0.17% | 0.18% | 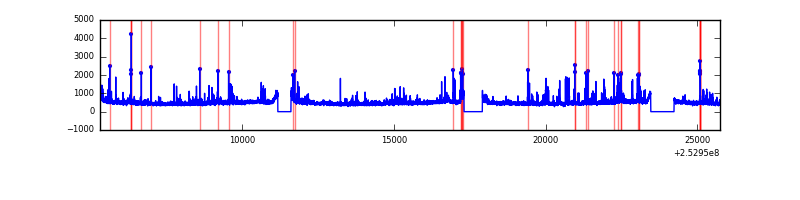 |
| C | 20426 | 18619 | 3 | 3 | 0.01% | 0.02% | 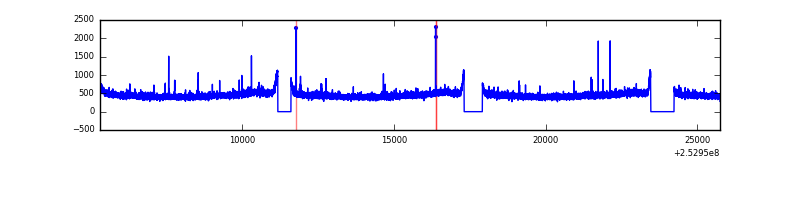 |
| D | 20426 | 18619 | 320 | 320 | 1.57% | 1.72% | 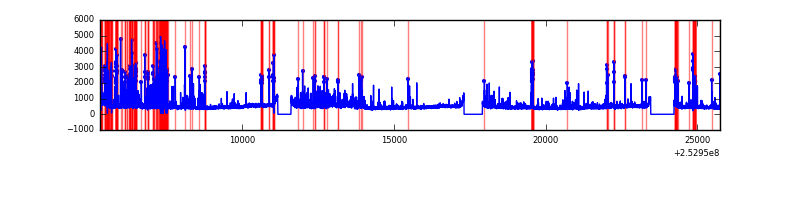 |
Top three noisy pixels from each quadrant. If the there are fewer than three noisy pixels in the level2.evt file, extra rows are filled as -1
| Pixel properties | Quadrant properties | ||||||
|---|---|---|---|---|---|---|---|
| Quadrant | DetID | PixID | Counts | Sigma | Mean | Median | Sigma |
| A | 1 | 162 | 593292 | 1318.75 | 2186 | 2140 | 448.3 |
| A | 1 | 178 | 320327 | 709.82 | 2186 | 2140 | 448.3 |
| A | 1 | 161 | 275754 | 610.38 | 2186 | 2140 | 448.3 |
| B | 4 | 239 | 662311 | 1569.26 | 2197 | 2140 | 420.7 |
| B | 3 | 64 | 79579 | 184.08 | 2197 | 2140 | 420.7 |
| B | 0 | 190 | 67784 | 156.04 | 2197 | 2140 | 420.7 |
| C | 4 | 254 | 59040 | 114.39 | 2138 | 2149 | 497.4 |
| C | 13 | 61 | 15926 | 27.7 | 2138 | 2149 | 497.4 |
| C | 14 | 234 | 9608 | 15.0 | 2138 | 2149 | 497.4 |
| D | 1 | 52 | 1582877 | 3134.45 | 2109 | 2056 | 504.3 |
| D | 5 | 222 | 340610 | 671.28 | 2109 | 2056 | 504.3 |
| D | 13 | 249 | 147349 | 288.09 | 2109 | 2056 | 504.3 |
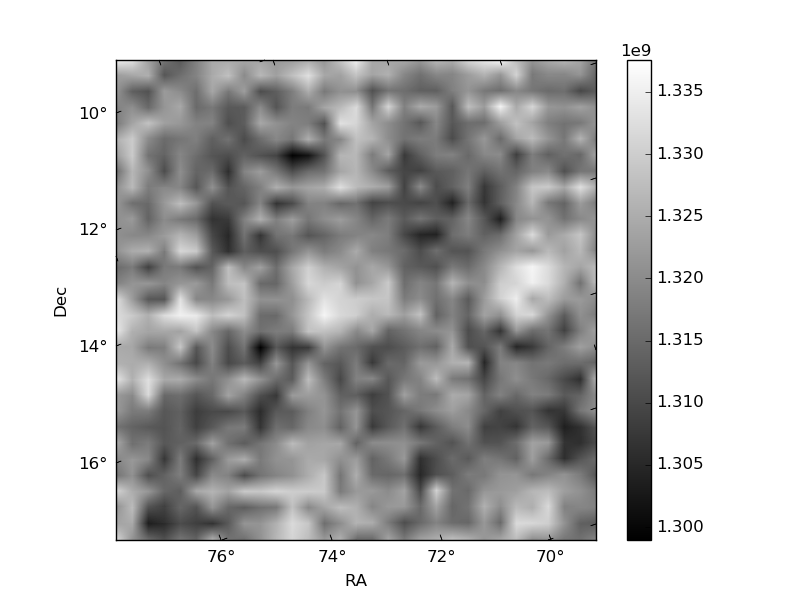
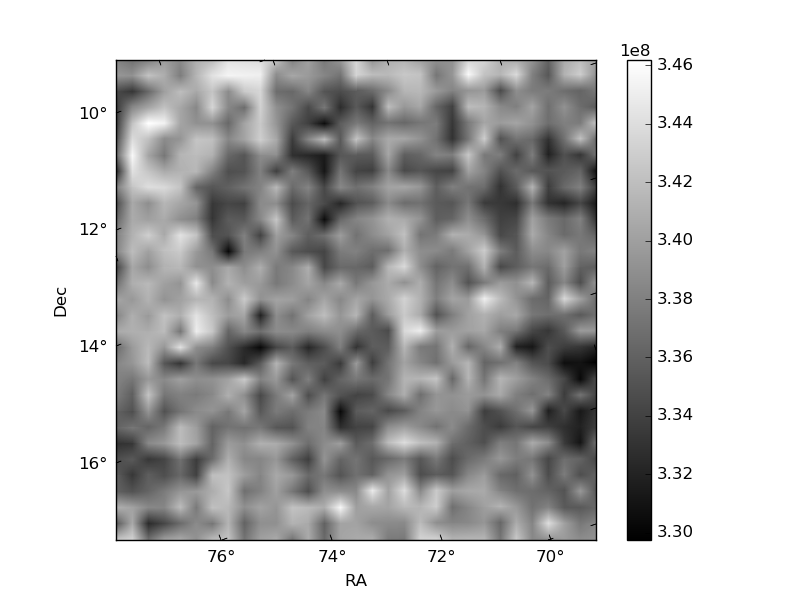
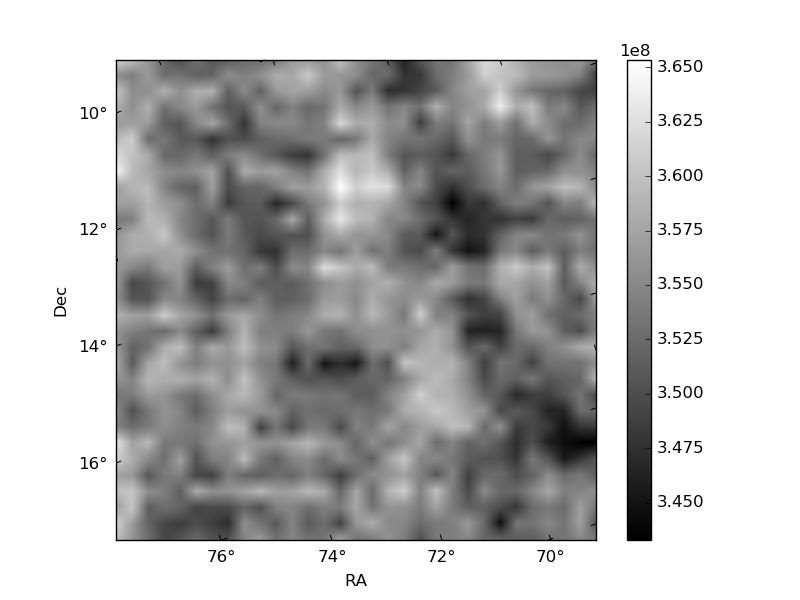
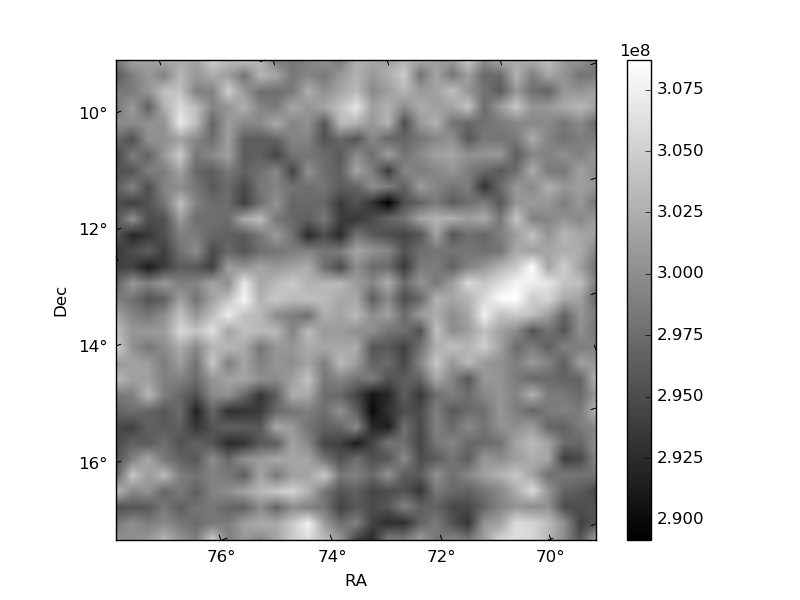
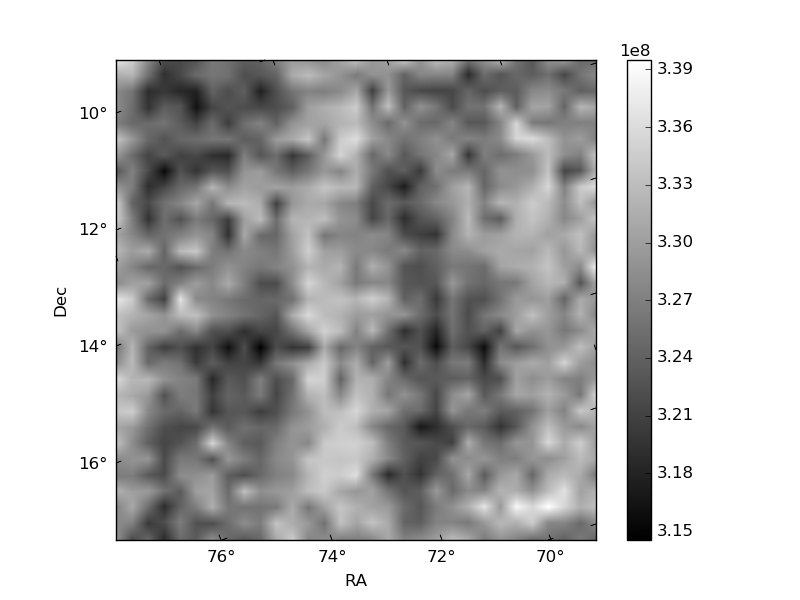
Histogram calculated using DETX and DETY for each event in the final _common_clean file
| Quadrant A | 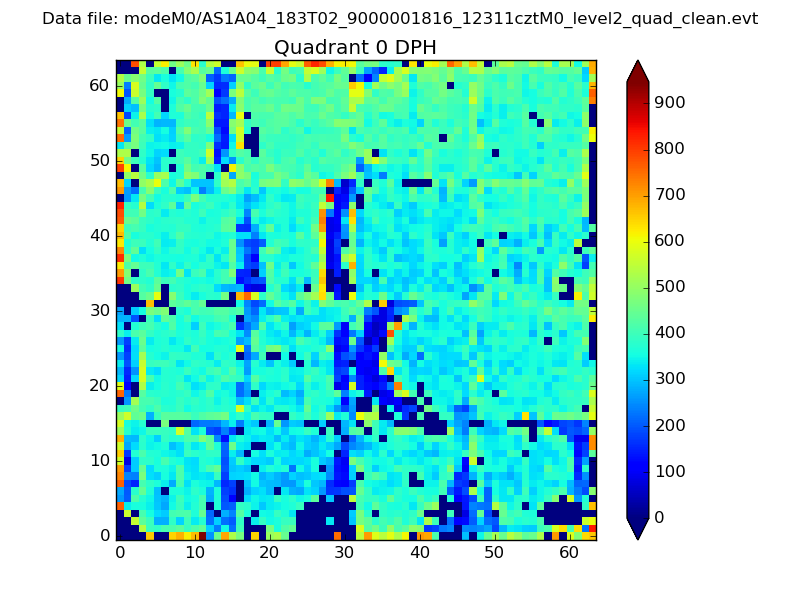 |
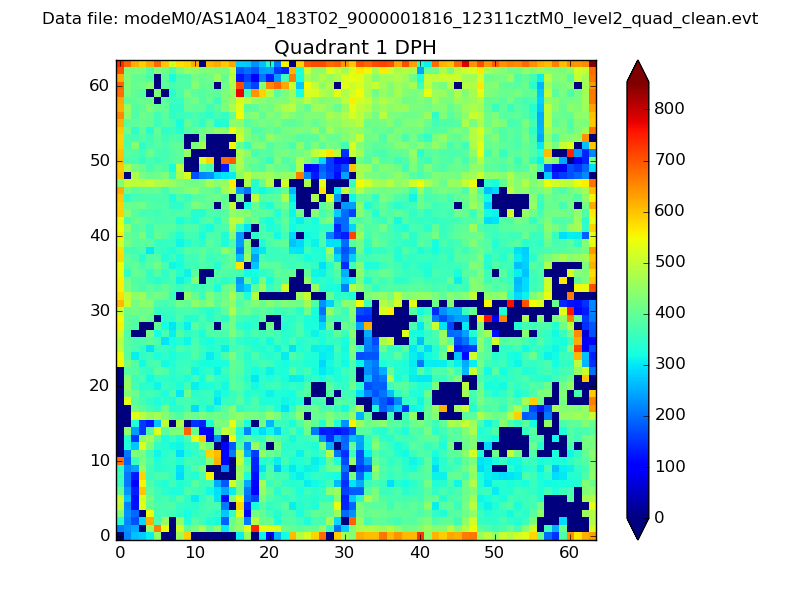 |
Quadrant B |
|---|---|---|---|
| Quadrant D | 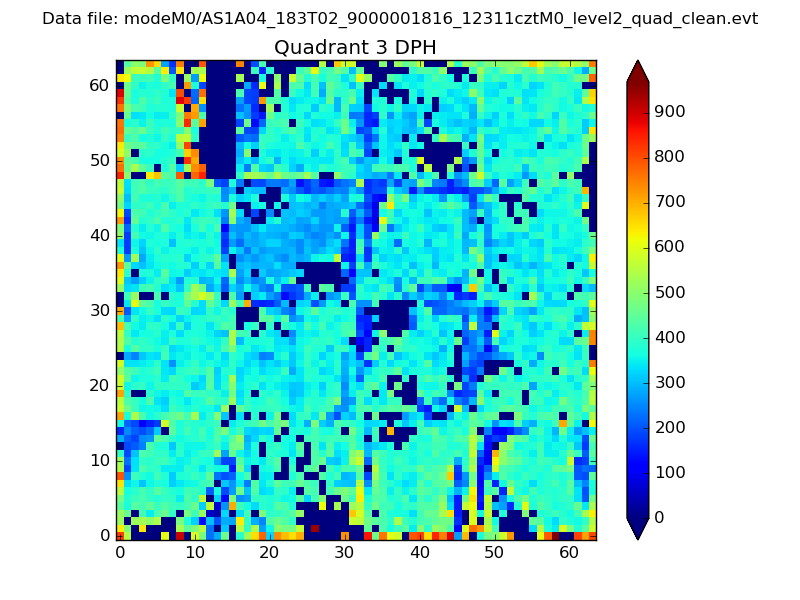 |
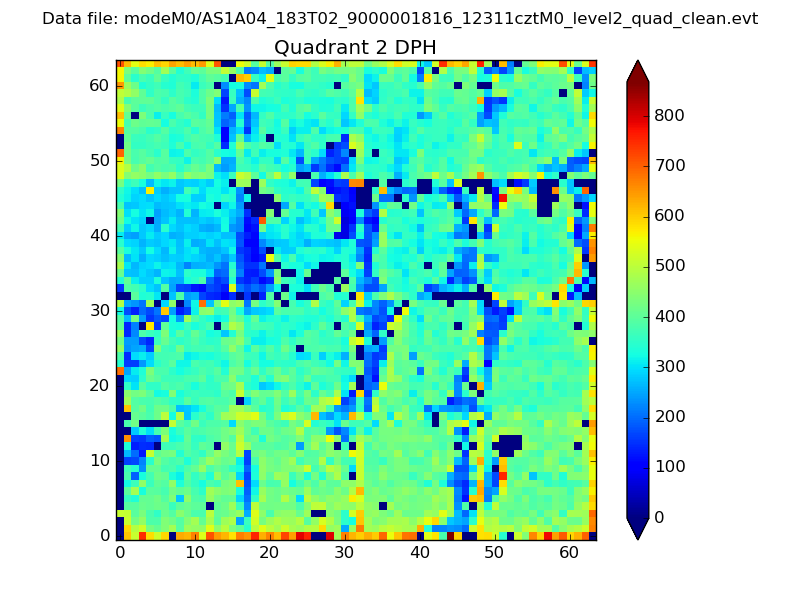 |
Quadrant C |
| Plot type | Count rate plots | Images |
|---|---|---|
| Comparison with Poisson distribution Blue bars denote a histogram of data divided into 1 sec bins. Red curve is a Poisson curve with rate = median count rate of data. |
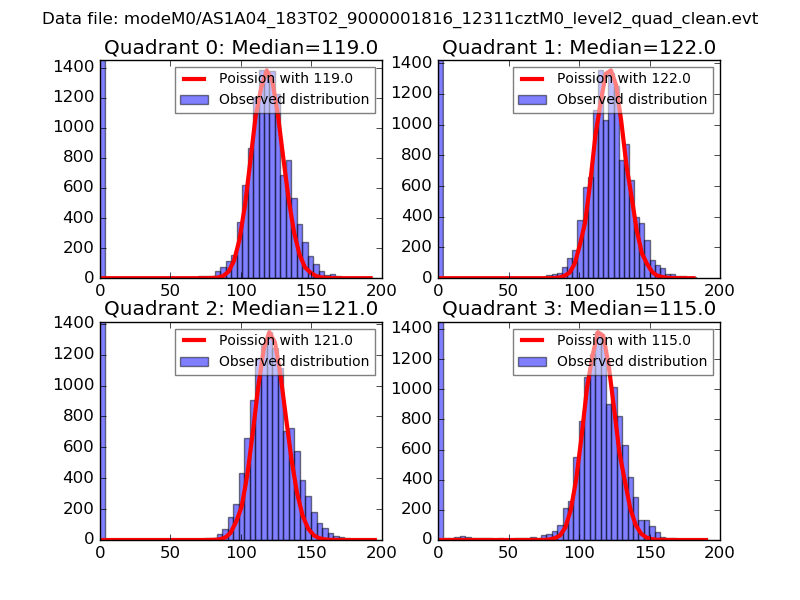 |
 |
| Quadrant-wise count rates Data is divided into 100 sec bins |
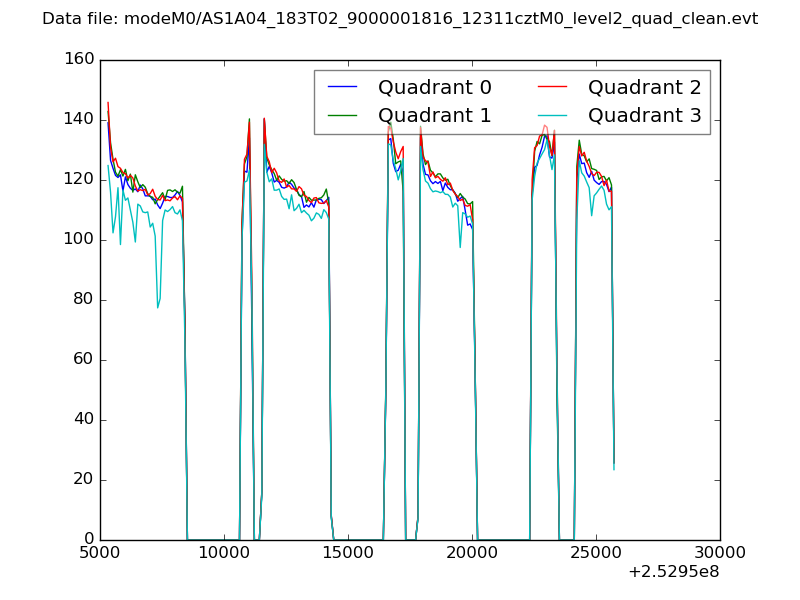 |
|
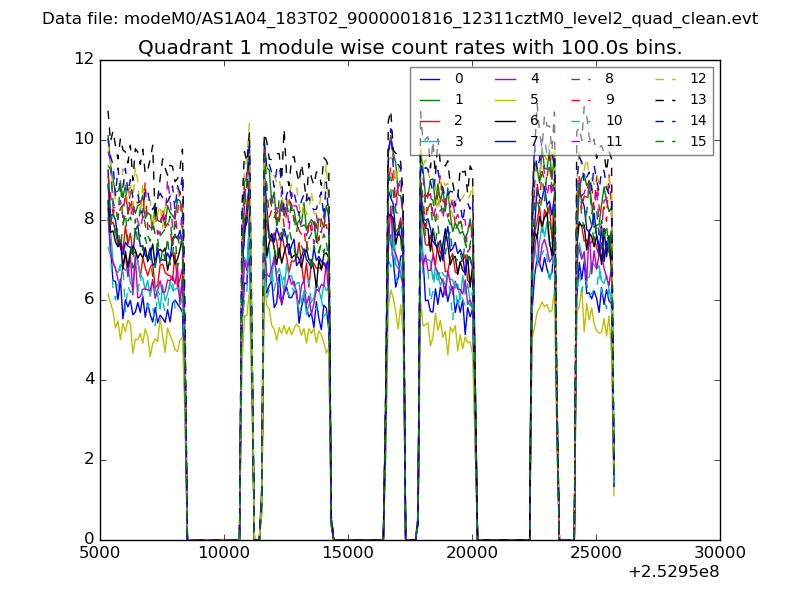
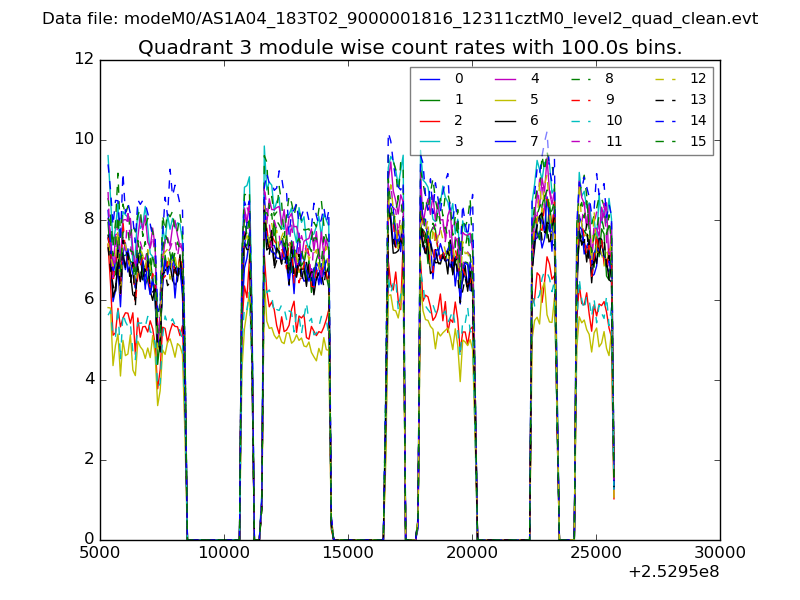
| Module-wise count rates for Quadrant A Data is divided into 100 sec bins |
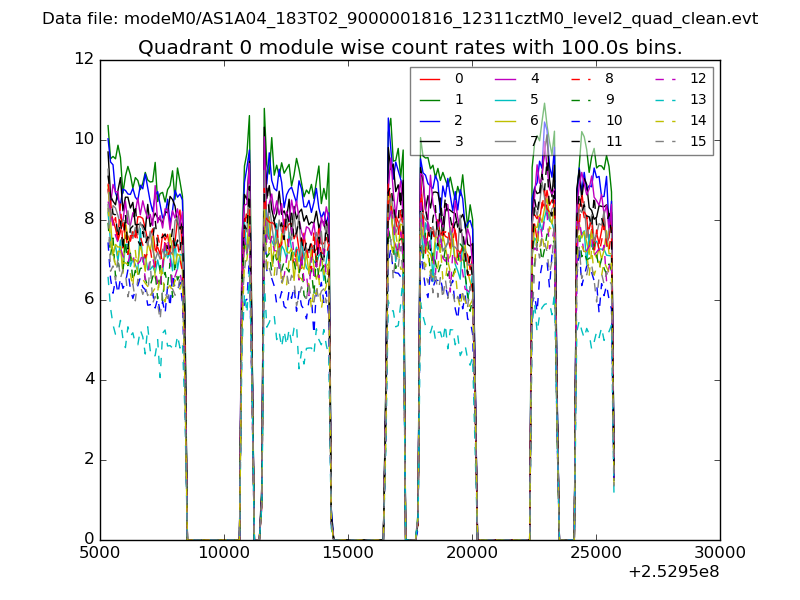 |
 |
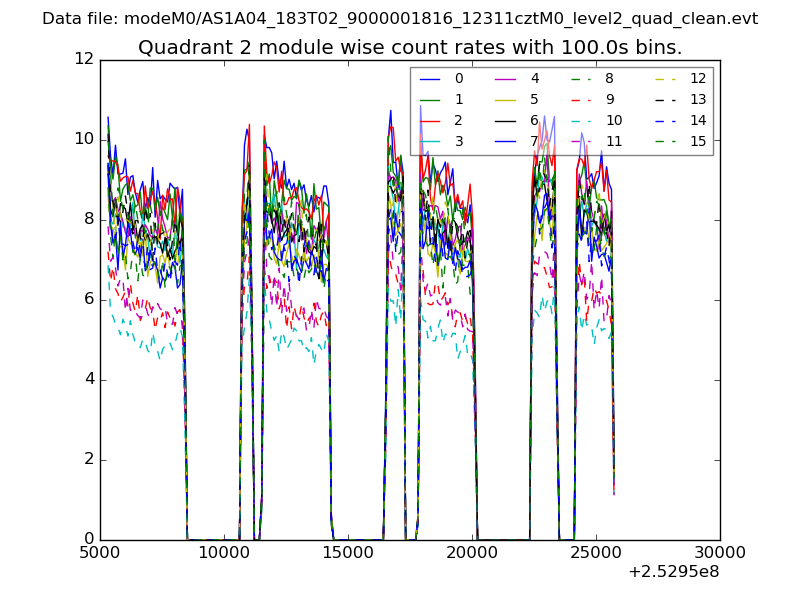
| Module-wise count rates for Quadrant B Data is divided into 100 sec bins |
 |
 |
| Module-wise count rates for Quadrant C Data is divided into 100 sec bins |
 |
 |
| Module-wise count rates for Quadrant D Data is divided into 100 sec bins |
 |
 |
| Parameter | Plot |
|---|---|
| CZT HV Monitor | 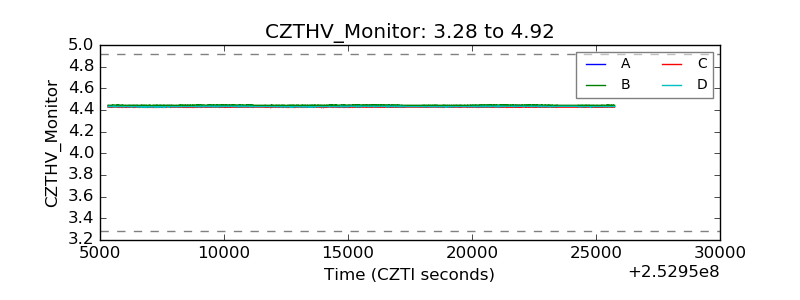 |
| D_VDD | 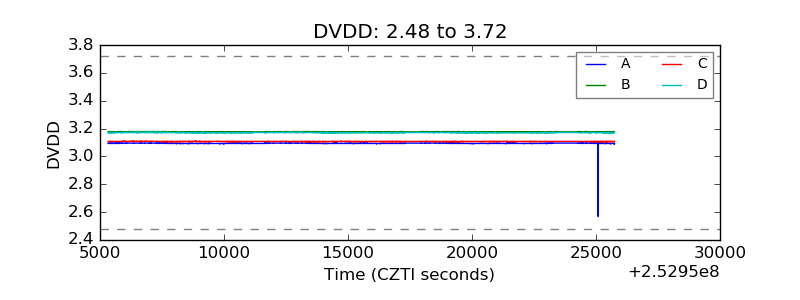 |
| Temperature 1 | 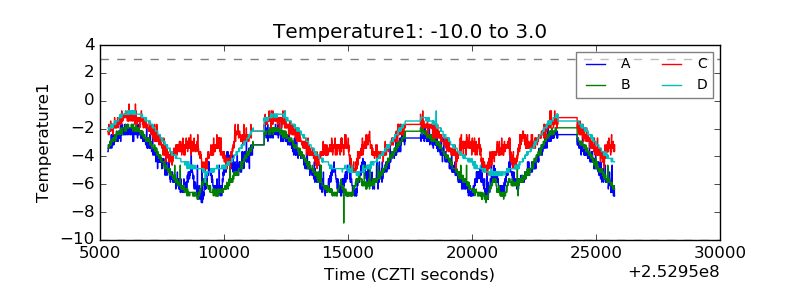 |
| Veto HV Monitor | 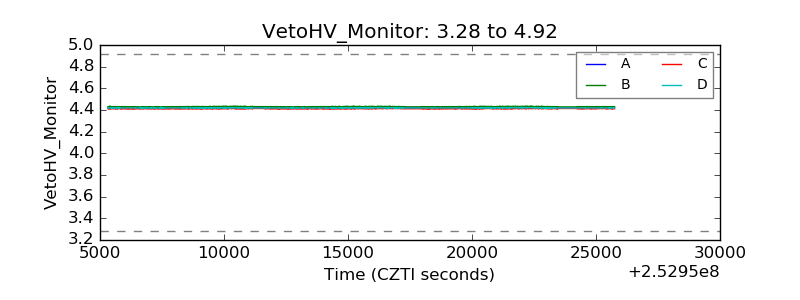 |
| Veto LLD | 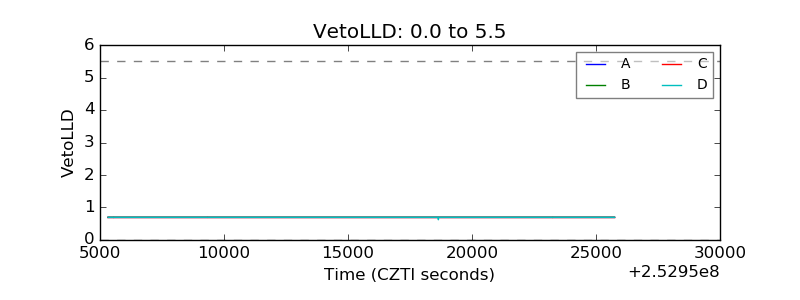 |
| Alpha Counter | 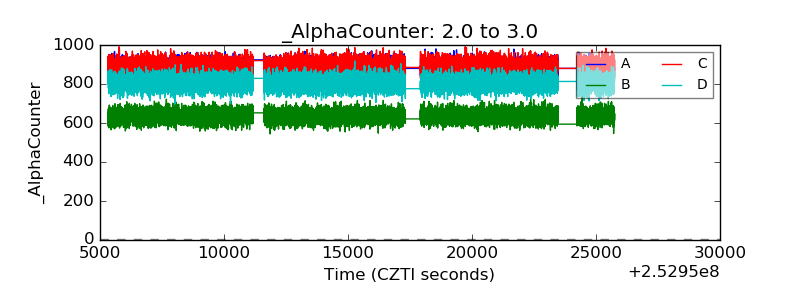 |
| _CPM_Rate | 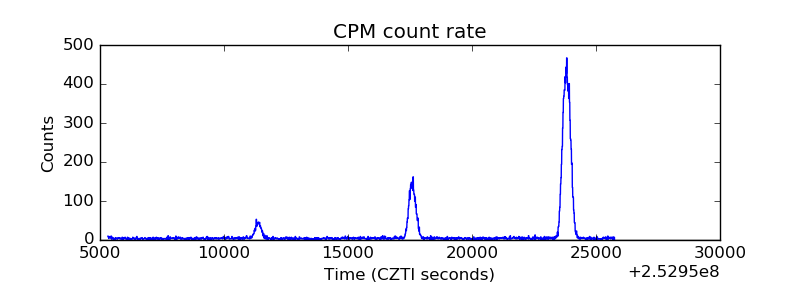 |
| CZT Counter | 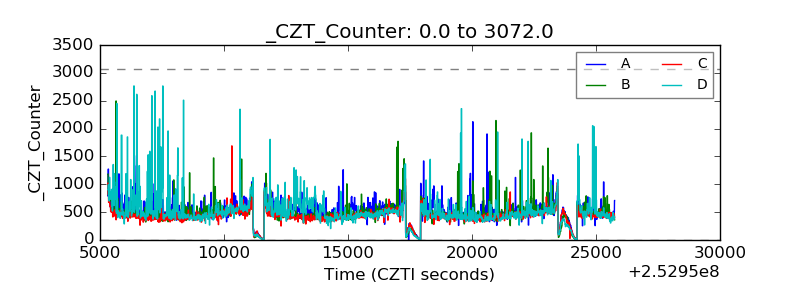 |
| +2.5 Volts monitor |  |
| +5 Volts monitor |  |
| _ROLL_ROT | 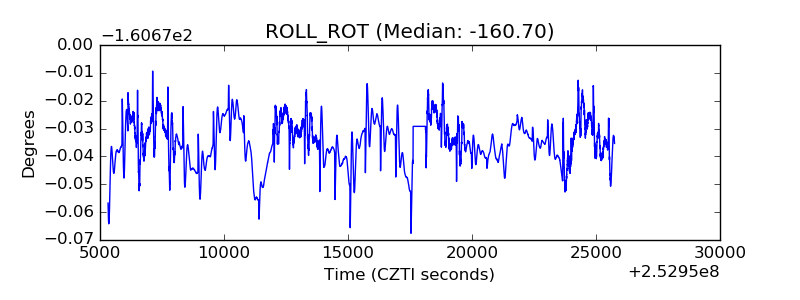 |
| _Roll_DEC | 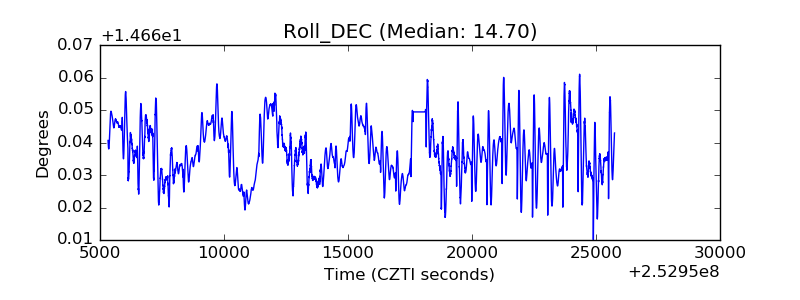 |
| _Roll_RA | 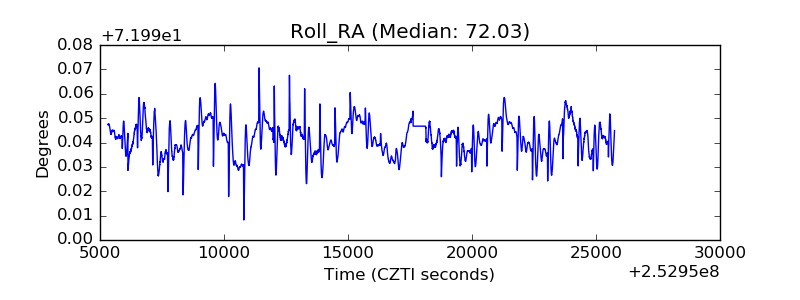 |
| Veto Counter | 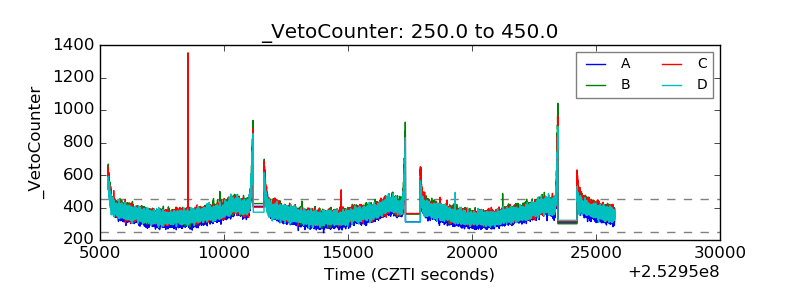 |