| Param | Original file | Final file |
|---|---|---|
| Filename | modeM0/AS1A04_183T02_9000001816_12312cztM0_level2.evt | modeM0/AS1A04_183T02_9000001816_12312cztM0_level2_quad_clean.evt |
| Size (bytes) | 507,643,200 | 96,992,640 |
| Size | 484.1 MB | 92.5 MB |
| Events in quadrant A | 3,990,907 | 610,727 |
| Events in quadrant B | 3,938,753 | 619,004 |
| Events in quadrant C | 3,264,797 | 620,539 |
| Events in quadrant D | 3,695,420 | 590,617 |
| Mode SS | |||
|---|---|---|---|
| Quadrant | BADHDUFLAG | Total packets | Discarded packets |
| A | 0 | 146 | 0 |
| B | 0 | 146 | 0 |
| C | 0 | 146 | 0 |
| D | 0 | 146 | 0 |
| Mode M9 | |||
|---|---|---|---|
| Quadrant | BADHDUFLAG | Total packets | Discarded packets |
| A | 0 | 18 | 0 |
| B | 0 | 18 | 0 |
| C | 0 | 18 | 0 |
| D | 0 | 18 | 0 |
| Mode M0 | |||
|---|---|---|---|
| Quadrant | BADHDUFLAG | Total packets | Discarded packets |
| A | 0 | 16642 | 3 |
| B | 0 | 16311 | 2 |
| C | 0 | 14538 | 2 |
| D | 0 | 15894 | 2 |
| Quadrant | Total seconds | Saturated seconds | Saturation percentage |
|---|---|---|---|
| A | 7131 | 116 | 1.626700% |
| B | 7131 | 201 | 2.818679% |
| C | 7131 | 61 | 0.855420% |
| D | 7131 | 108 | 1.514514% |
Noise dominated data is calculated using 1-second bins in cleaned event files. If a bin has >2000 counts, and if more than 50% of those come from <1% of pixels, then it is considered to be noise-dominated and hence unusable.
| Quadrant | # 1 sec bins | Bins with >0 counts | Bins with >2000 counts | High rate bins dominated by noise | Noise dominated (total time) | Noise dominated (detector-on time) | Marked lightcurve |
|---|---|---|---|---|---|---|---|
| A | 8822 | 7134 | 5 | 5 | 0.06% | 0.07% | 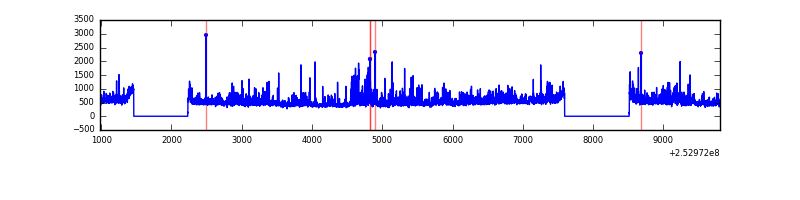 |
| B | 8822 | 7134 | 56 | 56 | 0.63% | 0.78% | 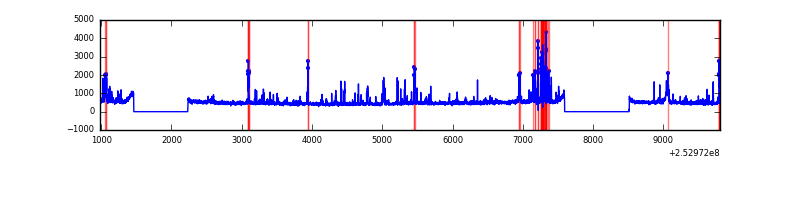 |
| C | 8822 | 7134 | 0 | 0 | 0.00% | 0.00% | 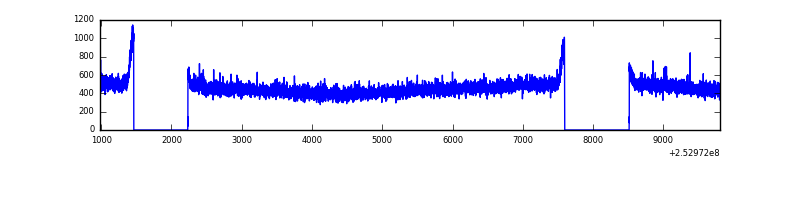 |
| D | 8822 | 7134 | 53 | 53 | 0.60% | 0.74% | 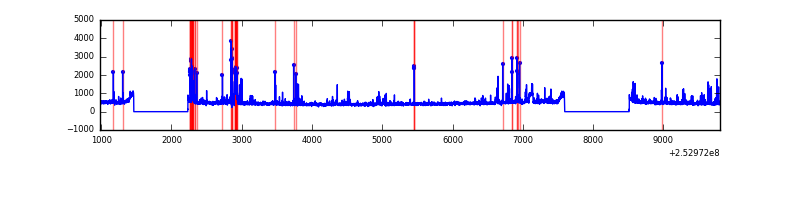 |
Top three noisy pixels from each quadrant. If the there are fewer than three noisy pixels in the level2.evt file, extra rows are filled as -1
| Pixel properties | Quadrant properties | ||||||
|---|---|---|---|---|---|---|---|
| Quadrant | DetID | PixID | Counts | Sigma | Mean | Median | Sigma |
| A | 1 | 162 | 226918 | 1285.91 | 852 | 833 | 175.8 |
| A | 1 | 178 | 132706 | 750.06 | 852 | 833 | 175.8 |
| A | 1 | 161 | 113405 | 640.28 | 852 | 833 | 175.8 |
| B | 4 | 239 | 447905 | 2700.27 | 853 | 831 | 165.6 |
| B | 3 | 64 | 56411 | 335.7 | 853 | 831 | 165.6 |
| B | 0 | 230 | 21208 | 123.07 | 853 | 831 | 165.6 |
| C | 13 | 61 | 6088 | 26.72 | 835 | 838 | 196.5 |
| C | 4 | 254 | 4824 | 20.28 | 835 | 838 | 196.5 |
| C | 8 | 128 | 3881 | 15.49 | 835 | 838 | 196.5 |
| D | 1 | 52 | 279624 | 1391.23 | 827 | 804 | 200.4 |
| D | 13 | 122 | 99459 | 492.26 | 827 | 804 | 200.4 |
| D | 8 | 195 | 45353 | 222.29 | 827 | 804 | 200.4 |
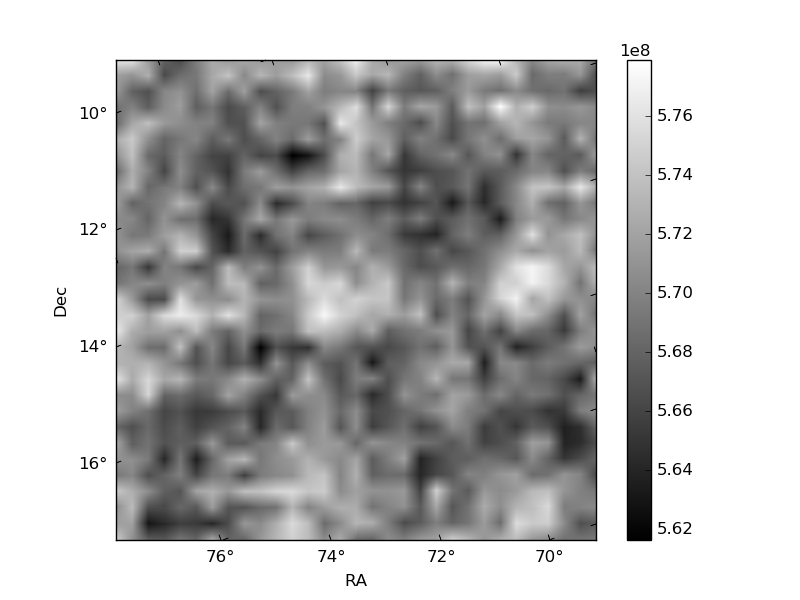
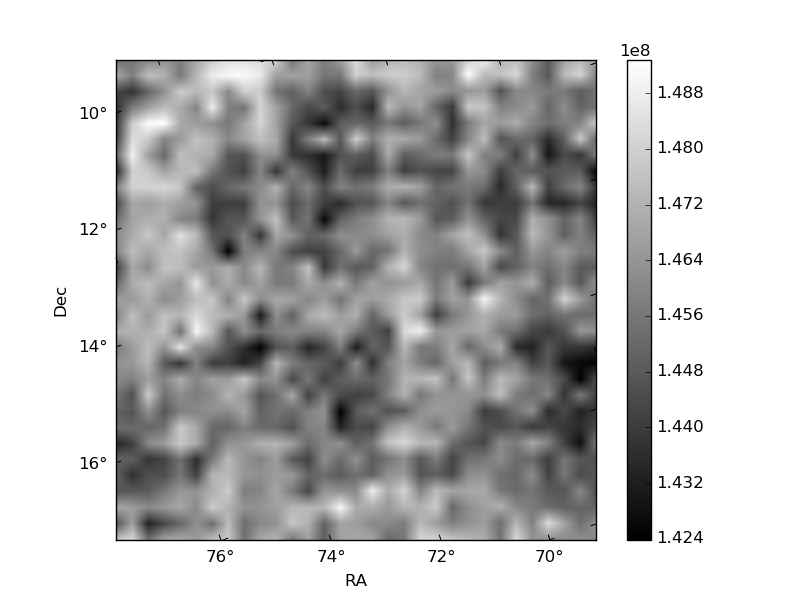
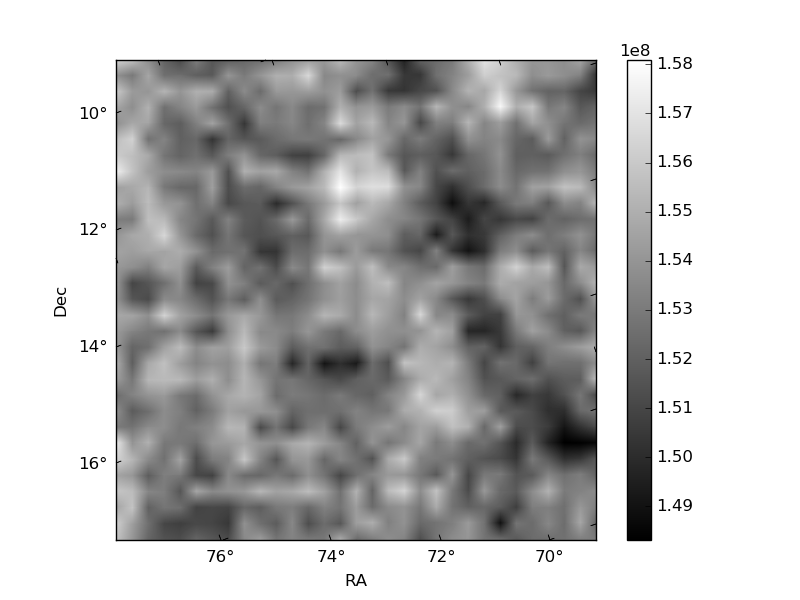
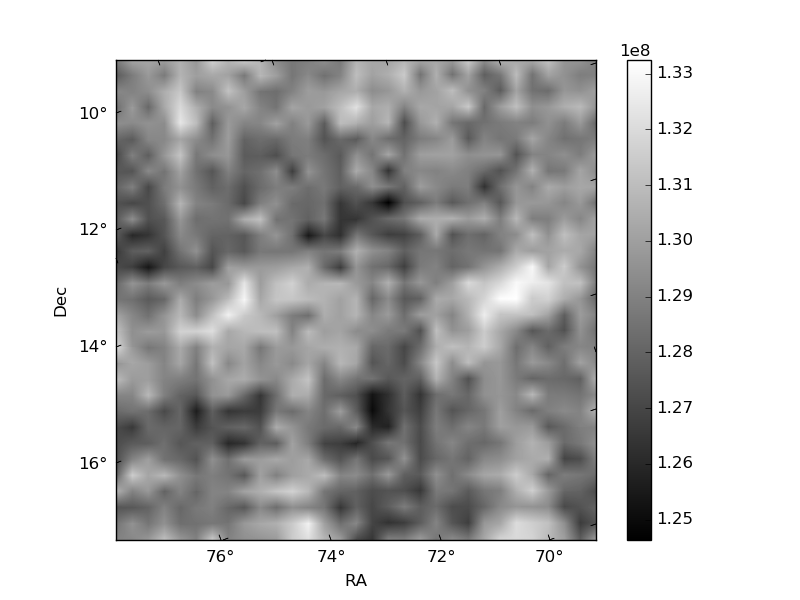
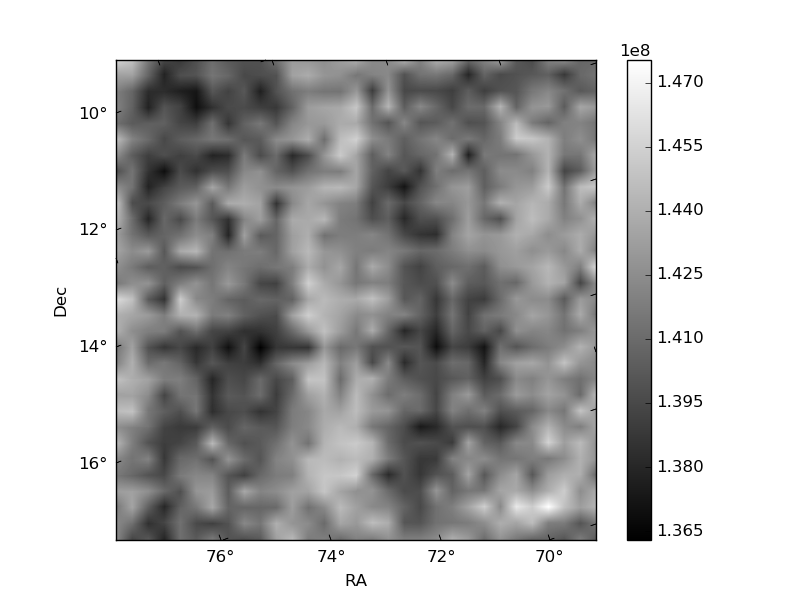
Histogram calculated using DETX and DETY for each event in the final _common_clean file
| Quadrant A | 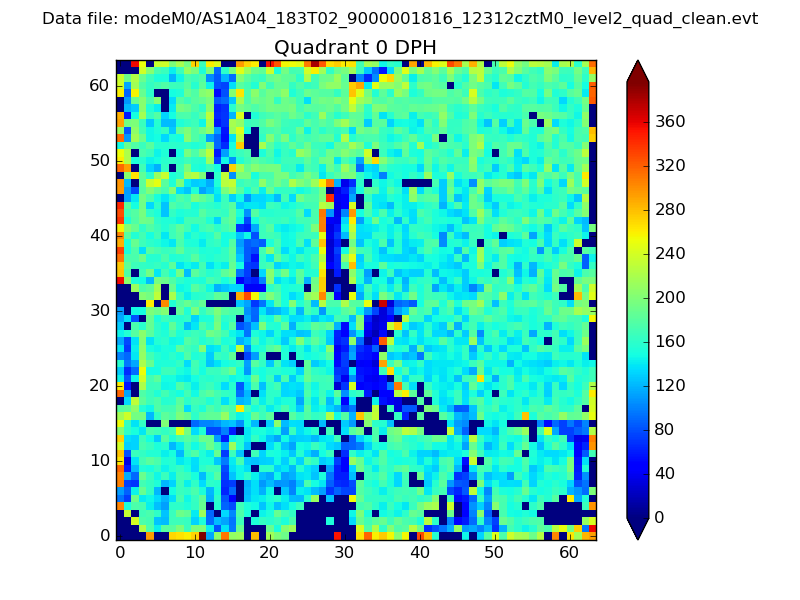 |
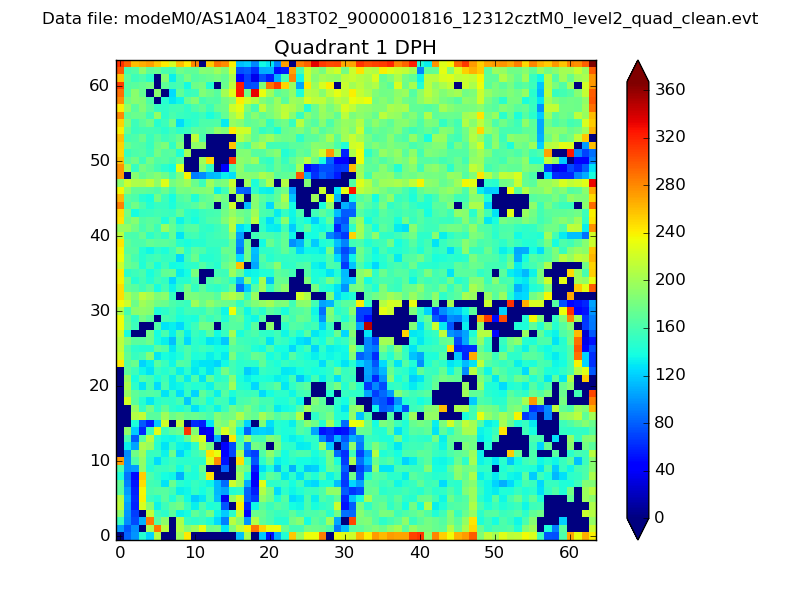 |
Quadrant B |
|---|---|---|---|
| Quadrant D | 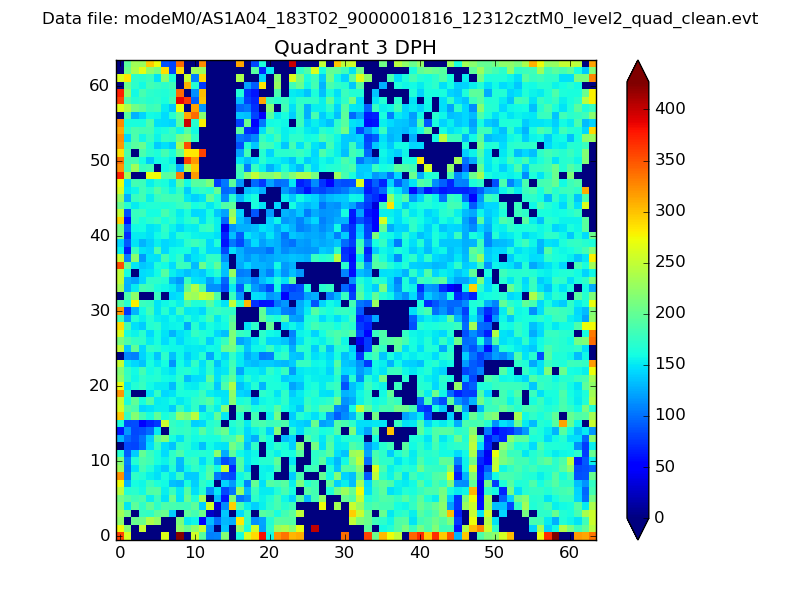 |
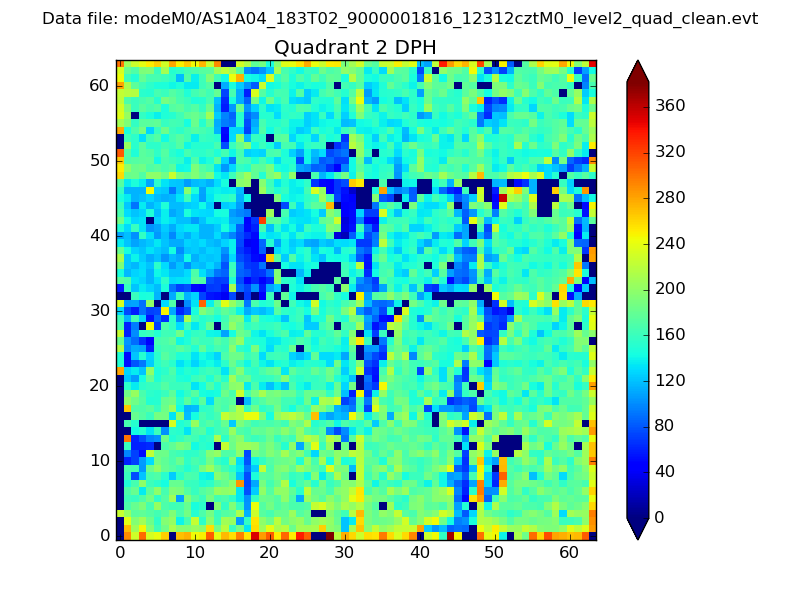 |
Quadrant C |
| Plot type | Count rate plots | Images |
|---|---|---|
| Comparison with Poisson distribution Blue bars denote a histogram of data divided into 1 sec bins. Red curve is a Poisson curve with rate = median count rate of data. |
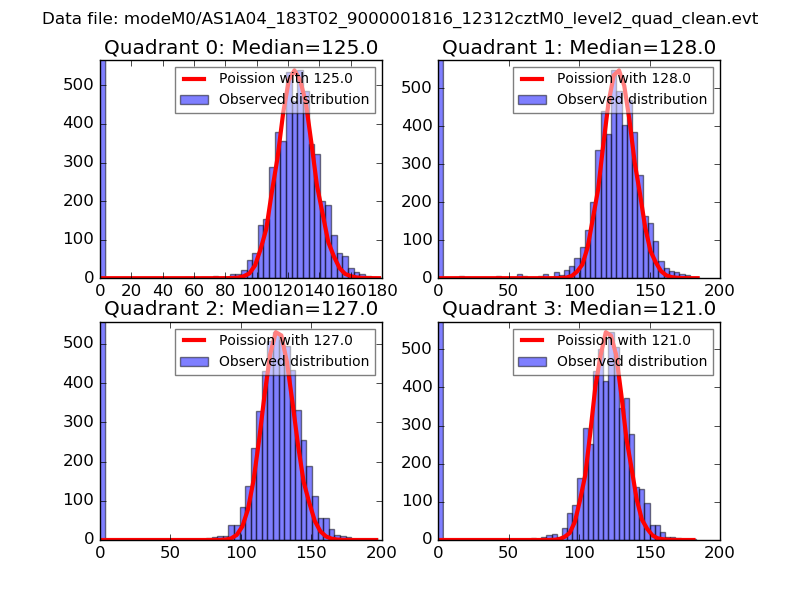 |
 |
| Quadrant-wise count rates Data is divided into 100 sec bins |
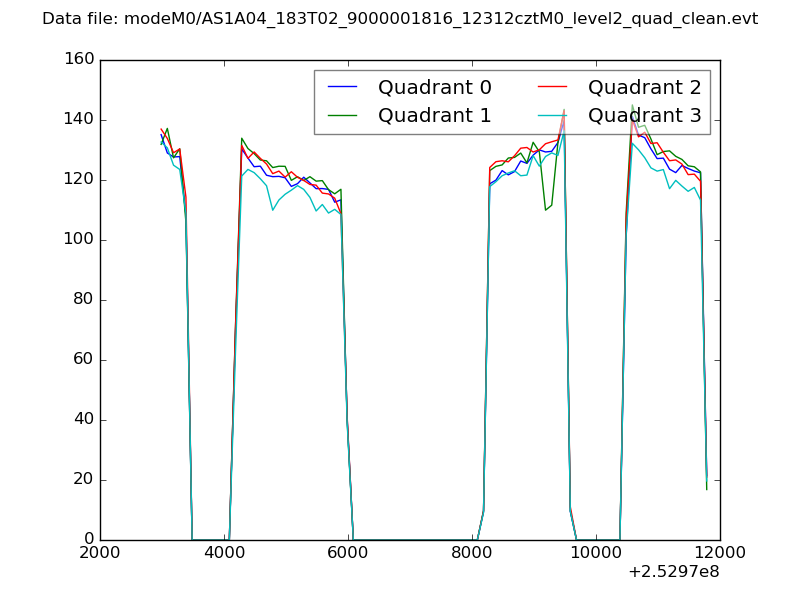 |
|
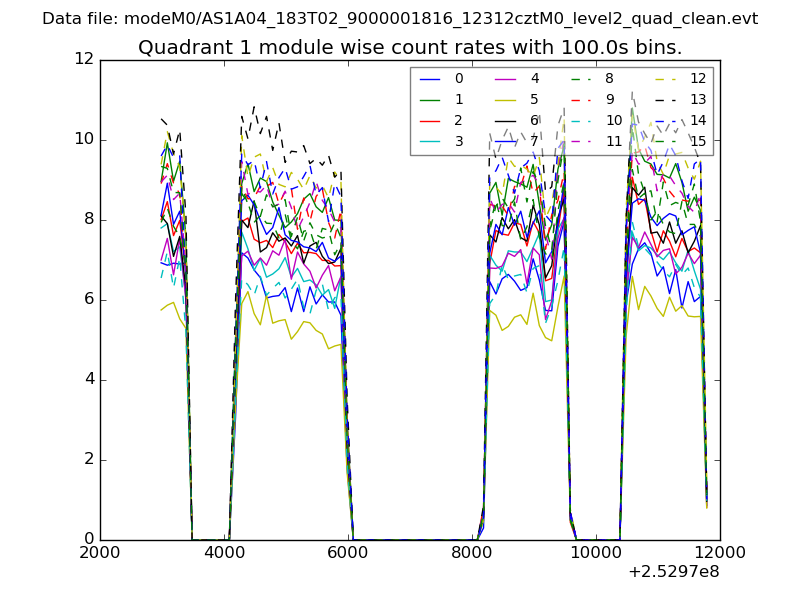
| Module-wise count rates for Quadrant A Data is divided into 100 sec bins |
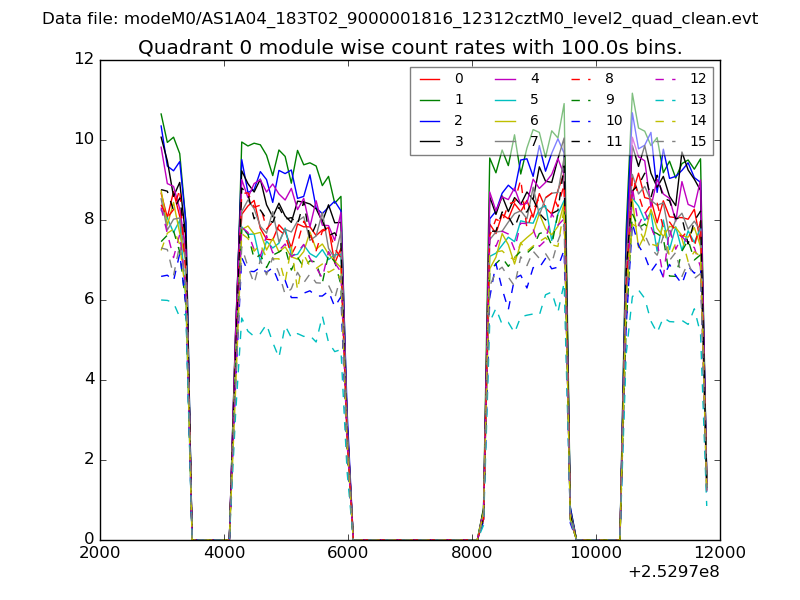 |
 |
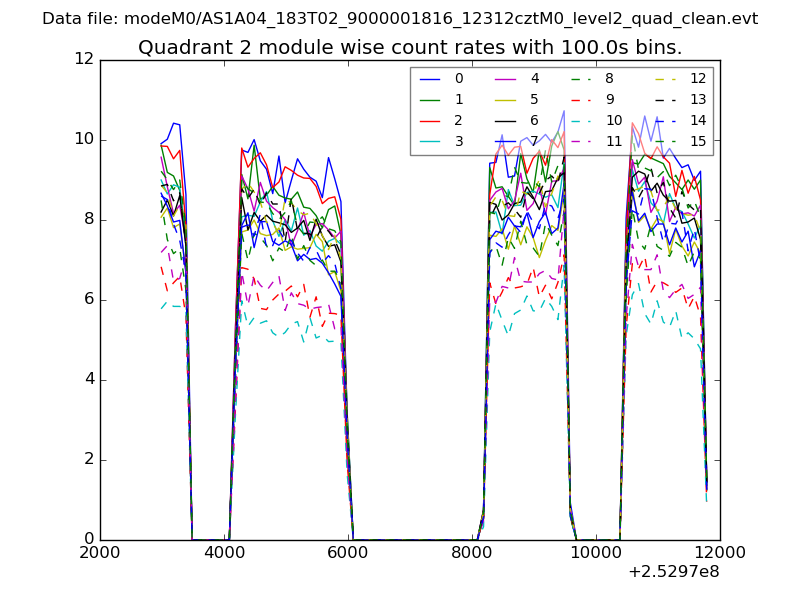
| Module-wise count rates for Quadrant B Data is divided into 100 sec bins |
 |
 |
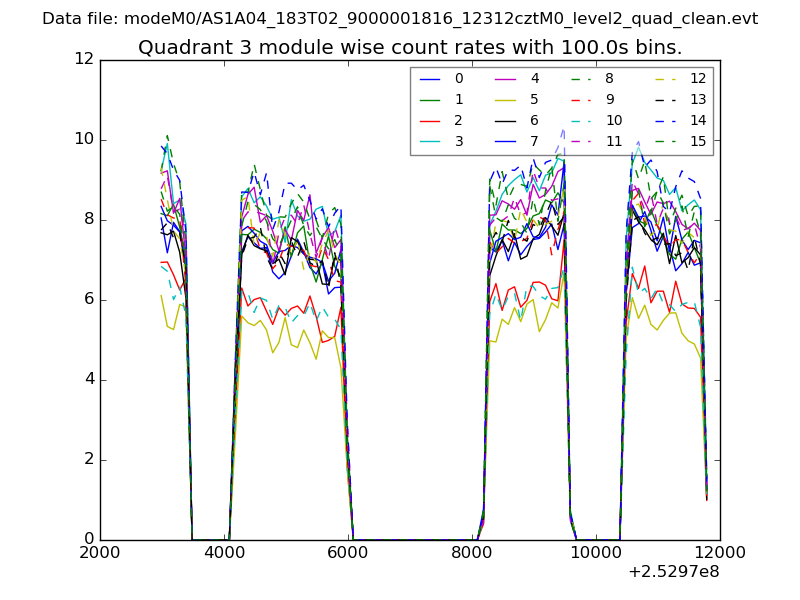
| Module-wise count rates for Quadrant C Data is divided into 100 sec bins |
 |
 |
| Module-wise count rates for Quadrant D Data is divided into 100 sec bins |
 |
 |
| Parameter | Plot |
|---|---|
| CZT HV Monitor | 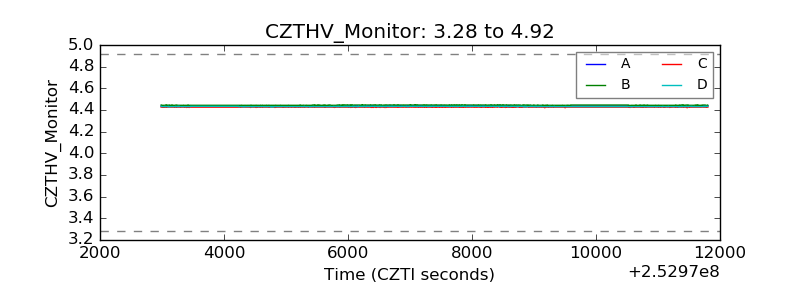 |
| D_VDD | 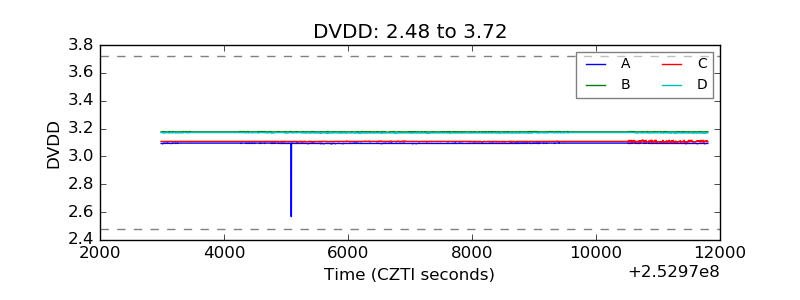 |
| Temperature 1 | 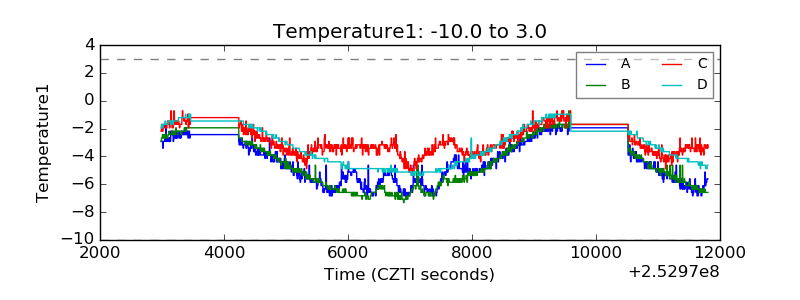 |
| Veto HV Monitor | 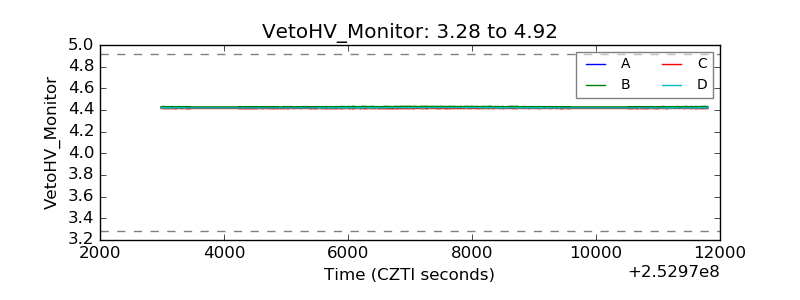 |
| Veto LLD | 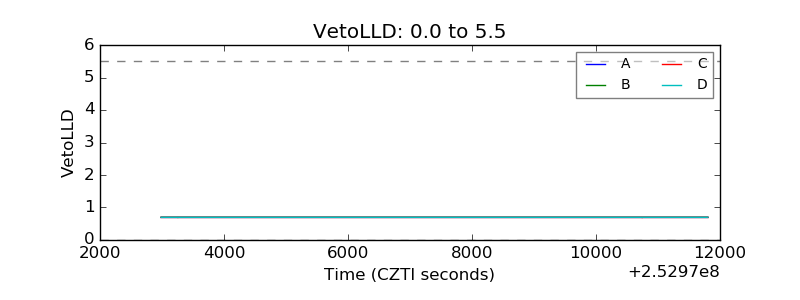 |
| Alpha Counter |  |
| _CPM_Rate | 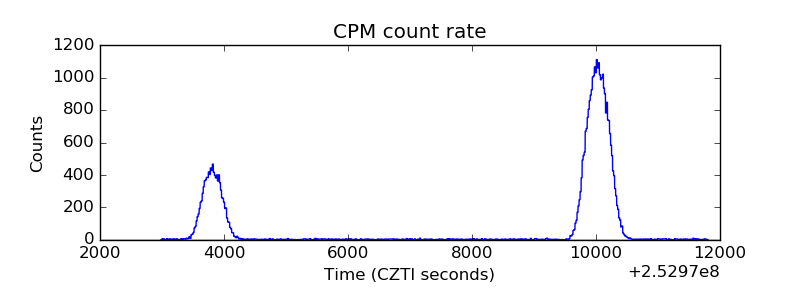 |
| CZT Counter |  |
| +2.5 Volts monitor |  |
| +5 Volts monitor |  |
| _ROLL_ROT | 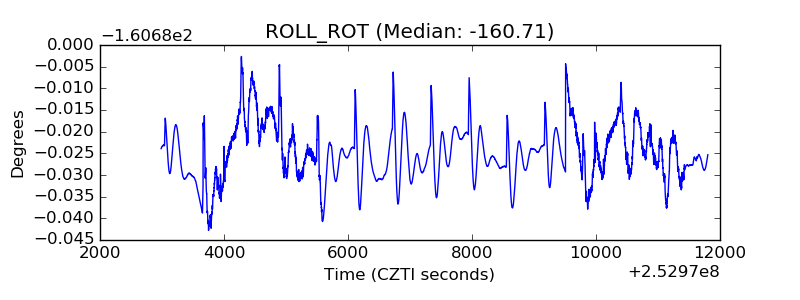 |
| _Roll_DEC | 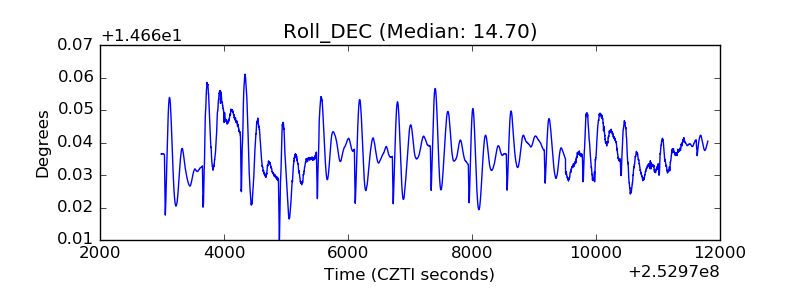 |
| _Roll_RA | 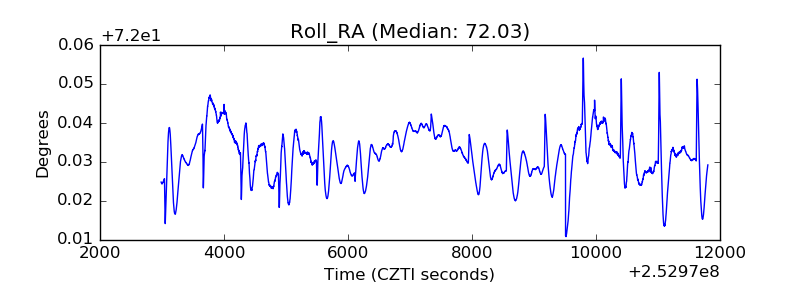 |
| Veto Counter | 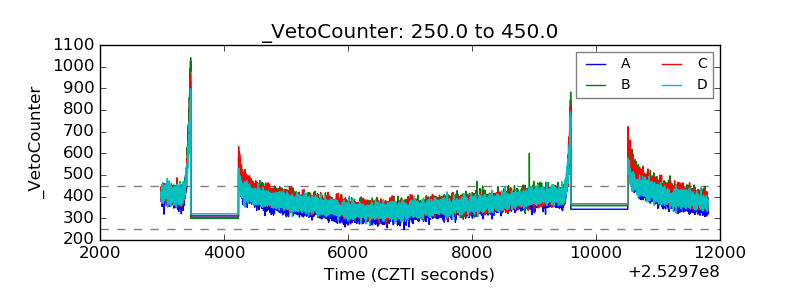 |