| Param | Original file | Final file |
|---|---|---|
| Filename | modeM0/AS1A04_183T02_9000001816_12314cztM0_level2.evt | modeM0/AS1A04_183T02_9000001816_12314cztM0_level2_quad_clean.evt |
| Size (bytes) | 477,092,160 | 82,071,360 |
| Size | 455.0 MB | 78.3 MB |
| Events in quadrant A | 3,544,108 | 505,166 |
| Events in quadrant B | 3,700,766 | 514,824 |
| Events in quadrant C | 3,113,462 | 511,095 |
| Events in quadrant D | 3,632,493 | 484,043 |
| Mode SS | |||
|---|---|---|---|
| Quadrant | BADHDUFLAG | Total packets | Discarded packets |
| A | 0 | 136 | 0 |
| B | 0 | 136 | 0 |
| C | 0 | 136 | 0 |
| D | 0 | 136 | 0 |
| Mode M9 | |||
|---|---|---|---|
| Quadrant | BADHDUFLAG | Total packets | Discarded packets |
| A | 0 | 16 | 0 |
| B | 0 | 16 | 0 |
| C | 0 | 16 | 0 |
| D | 0 | 17 | 0 |
| Mode M0 | |||
|---|---|---|---|
| Quadrant | BADHDUFLAG | Total packets | Discarded packets |
| A | 0 | 14906 | 3 |
| B | 0 | 15249 | 2 |
| C | 0 | 13726 | 2 |
| D | 0 | 15427 | 2 |
| Quadrant | Total seconds | Saturated seconds | Saturation percentage |
|---|---|---|---|
| A | 6746 | 50 | 0.741180% |
| B | 6746 | 89 | 1.319300% |
| C | 6746 | 9 | 0.133412% |
| D | 6746 | 49 | 0.726356% |
Noise dominated data is calculated using 1-second bins in cleaned event files. If a bin has >2000 counts, and if more than 50% of those come from <1% of pixels, then it is considered to be noise-dominated and hence unusable.
| Quadrant | # 1 sec bins | Bins with >0 counts | Bins with >2000 counts | High rate bins dominated by noise | Noise dominated (total time) | Noise dominated (detector-on time) | Marked lightcurve |
|---|---|---|---|---|---|---|---|
| A | 7827 | 6748 | 2 | 2 | 0.03% | 0.03% | 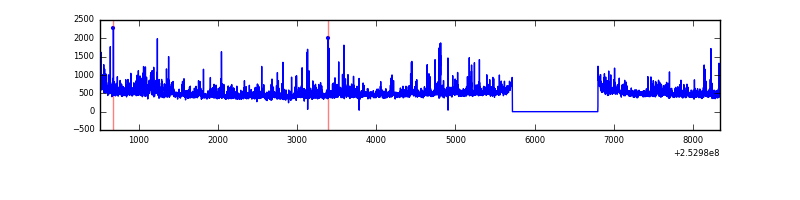 |
| B | 7827 | 6748 | 56 | 56 | 0.72% | 0.83% |  |
| C | 7827 | 6748 | 0 | 0 | 0.00% | 0.00% | 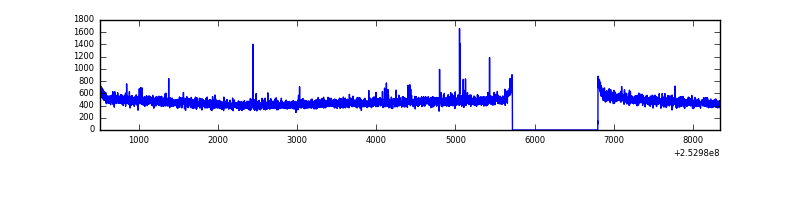 |
| D | 7827 | 6748 | 28 | 28 | 0.36% | 0.41% | 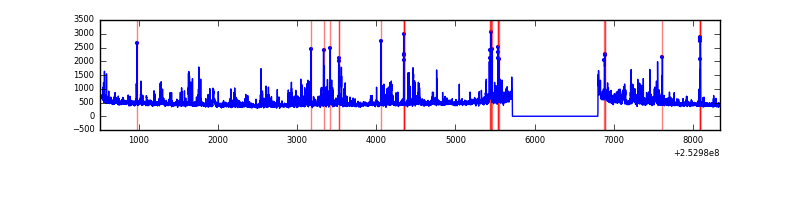 |
Top three noisy pixels from each quadrant. If the there are fewer than three noisy pixels in the level2.evt file, extra rows are filled as -1
| Pixel properties | Quadrant properties | ||||||
|---|---|---|---|---|---|---|---|
| Quadrant | DetID | PixID | Counts | Sigma | Mean | Median | Sigma |
| A | 1 | 162 | 164255 | 992.37 | 800 | 783 | 164.7 |
| A | 1 | 178 | 92466 | 556.57 | 800 | 783 | 164.7 |
| A | 1 | 161 | 79301 | 476.65 | 800 | 783 | 164.7 |
| B | 4 | 239 | 398022 | 2571.98 | 807 | 789 | 154.4 |
| B | 3 | 64 | 40861 | 259.46 | 807 | 789 | 154.4 |
| B | 0 | 197 | 27459 | 172.68 | 807 | 789 | 154.4 |
| C | 4 | 254 | 13165 | 67.27 | 788 | 794 | 183.9 |
| C | 8 | 128 | 10234 | 51.33 | 788 | 794 | 183.9 |
| C | 15 | 208 | 8511 | 41.96 | 788 | 794 | 183.9 |
| D | 1 | 52 | 344558 | 1833.51 | 777 | 756 | 187.5 |
| D | 10 | 50 | 105696 | 559.65 | 777 | 756 | 187.5 |
| D | 13 | 249 | 62622 | 329.93 | 777 | 756 | 187.5 |
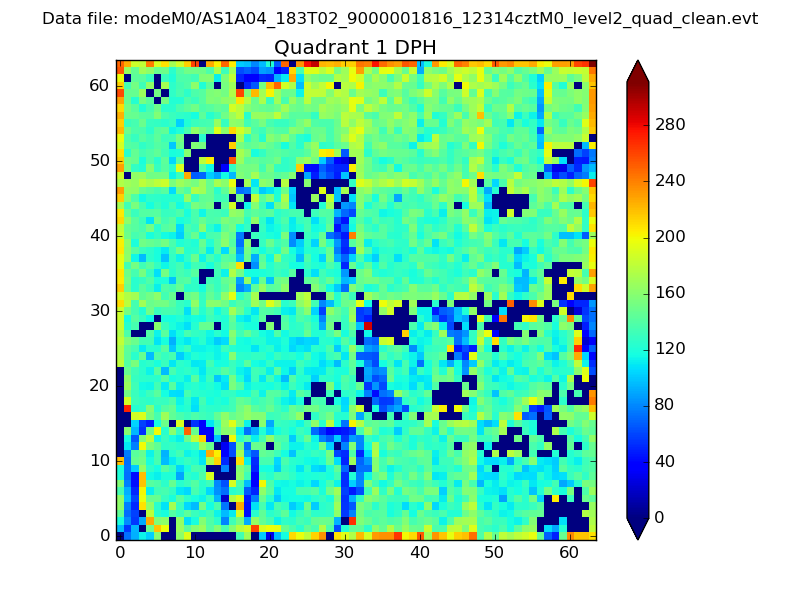
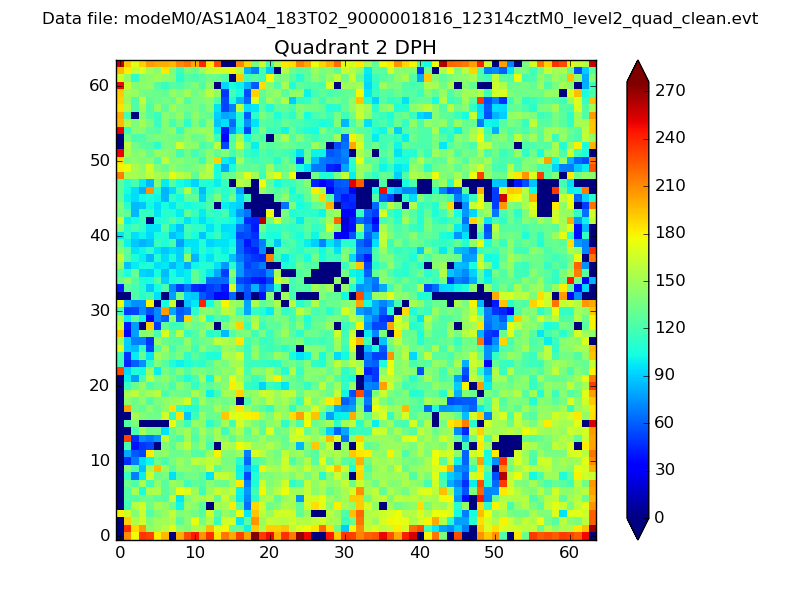
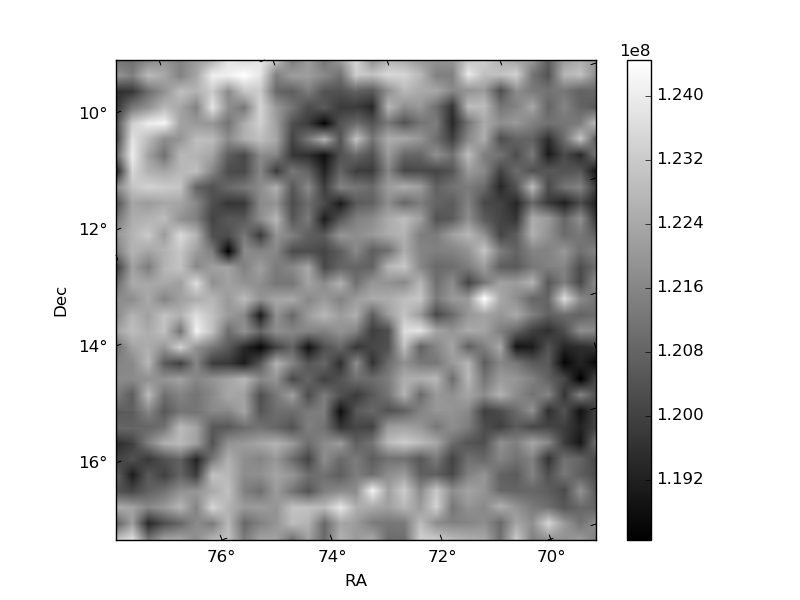
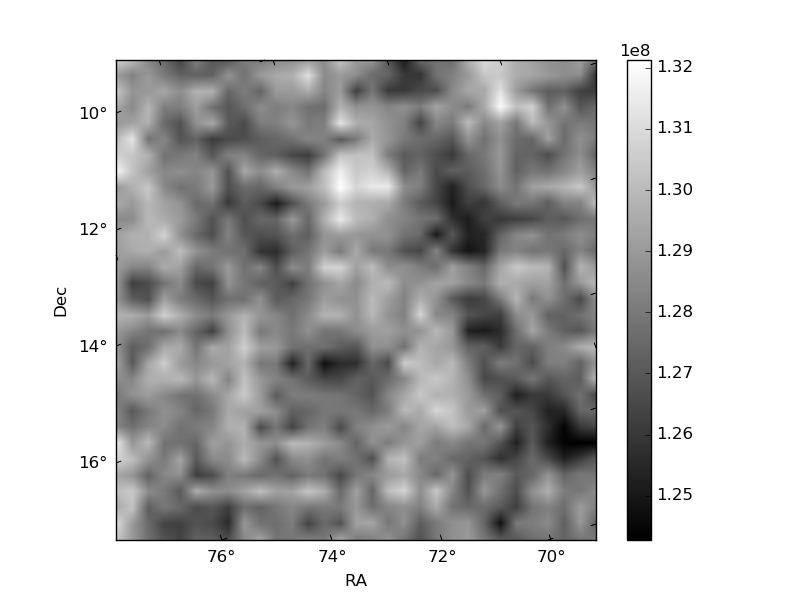
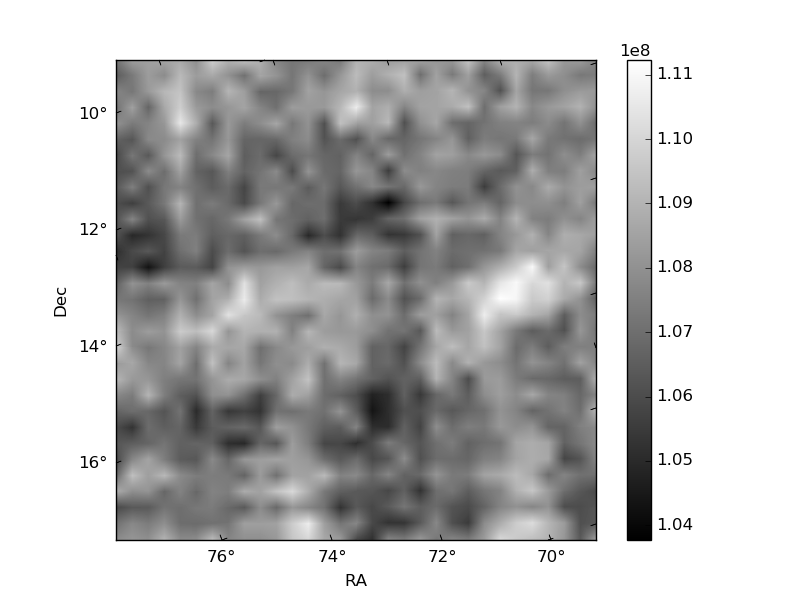
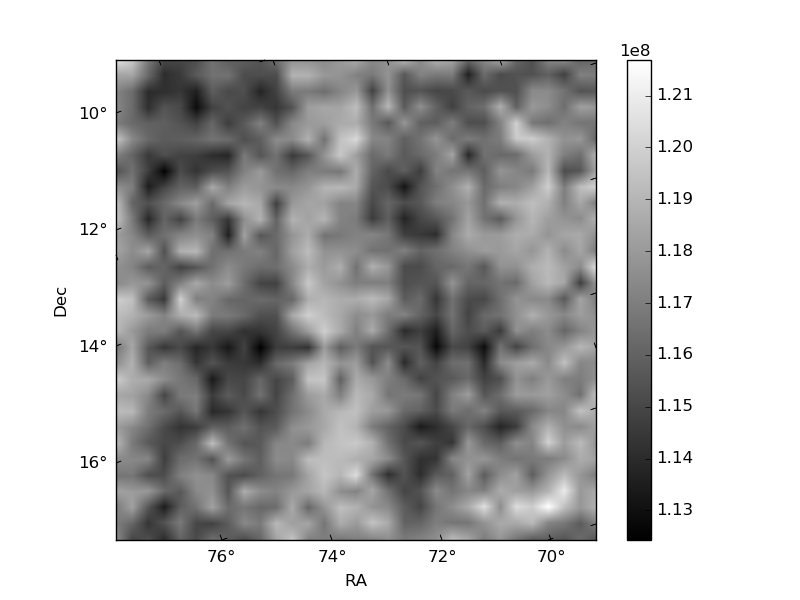
Histogram calculated using DETX and DETY for each event in the final _common_clean file
| Quadrant A | 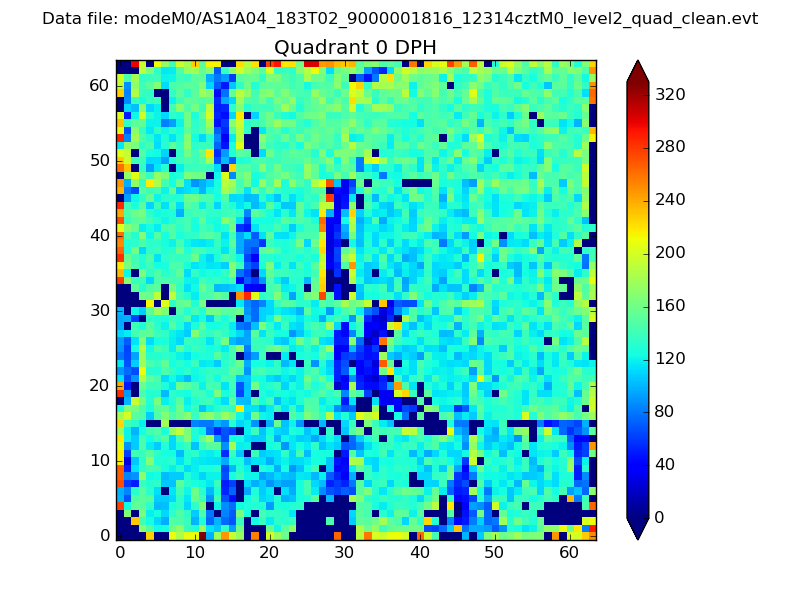 |
 |
Quadrant B |
|---|---|---|---|
| Quadrant D |  |
 |
Quadrant C |
| Plot type | Count rate plots | Images |
|---|---|---|
| Comparison with Poisson distribution Blue bars denote a histogram of data divided into 1 sec bins. Red curve is a Poisson curve with rate = median count rate of data. |
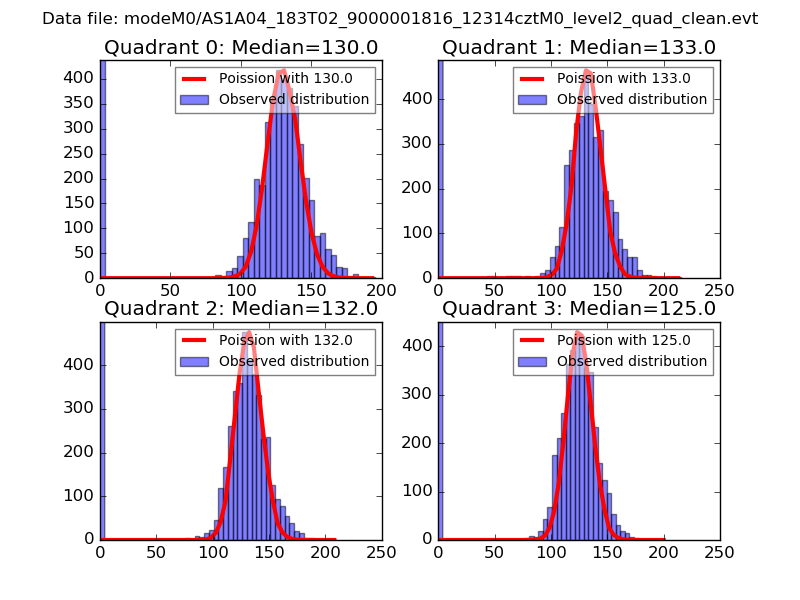 |
 |
| Quadrant-wise count rates Data is divided into 100 sec bins |
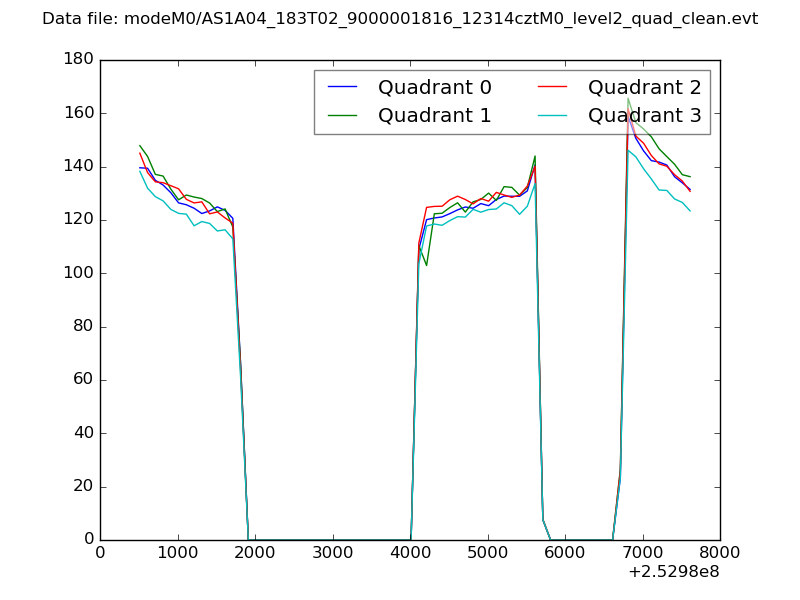 |
|
| Module-wise count rates for Quadrant A Data is divided into 100 sec bins |
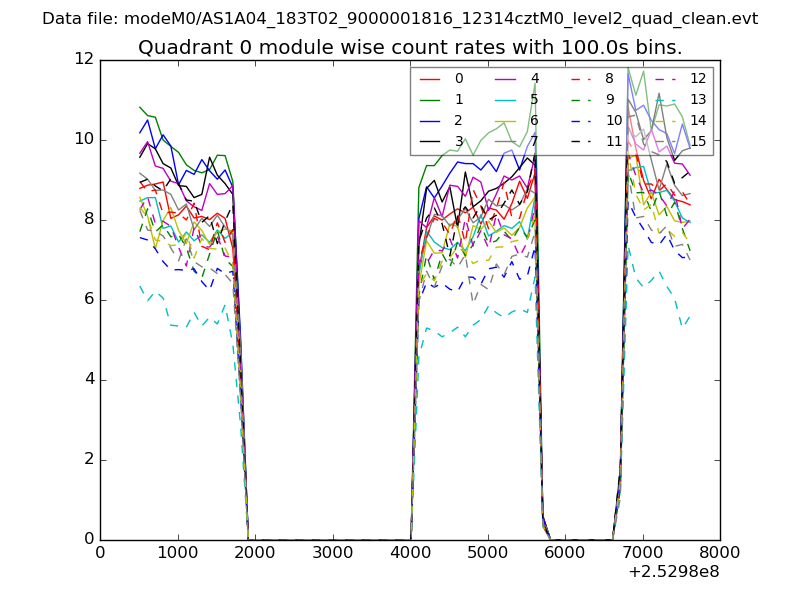 |
 |
| Module-wise count rates for Quadrant B Data is divided into 100 sec bins |
 |
 |
| Module-wise count rates for Quadrant C Data is divided into 100 sec bins |
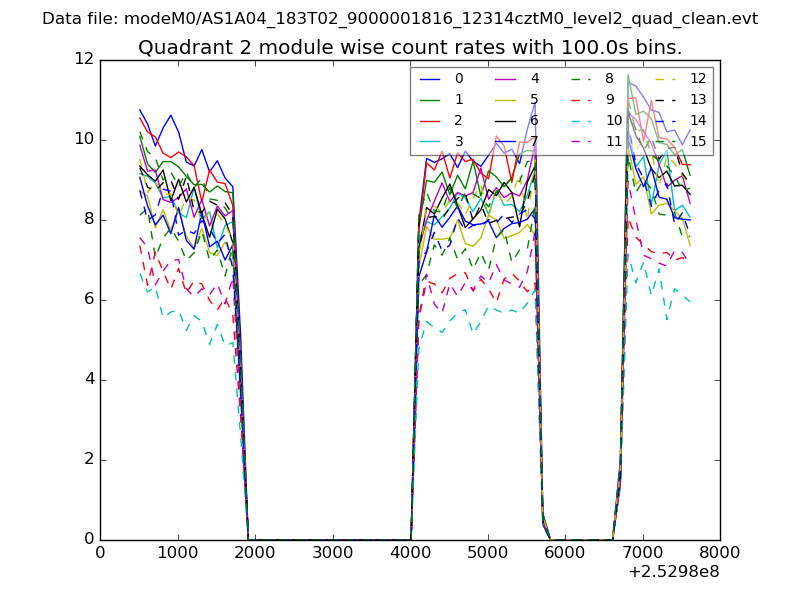 |
 |
| Module-wise count rates for Quadrant D Data is divided into 100 sec bins |
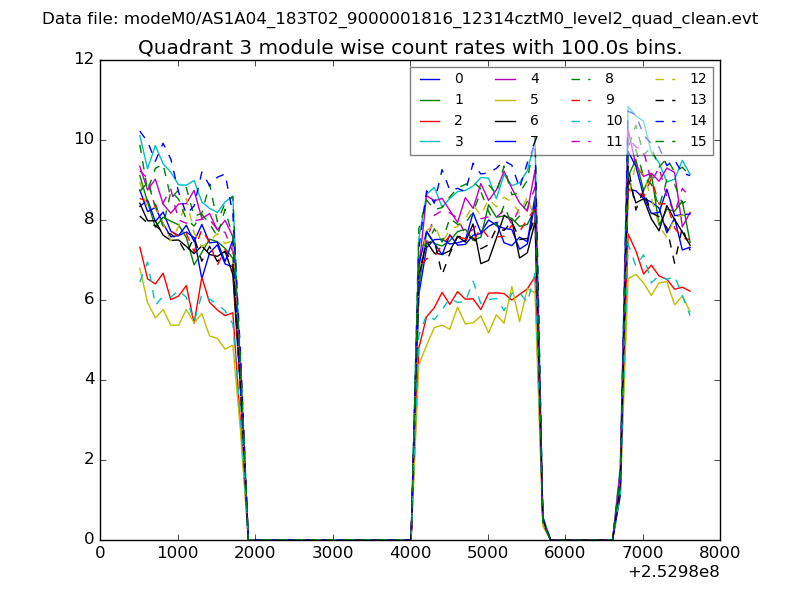 |
 |
| Parameter | Plot |
|---|---|
| CZT HV Monitor | 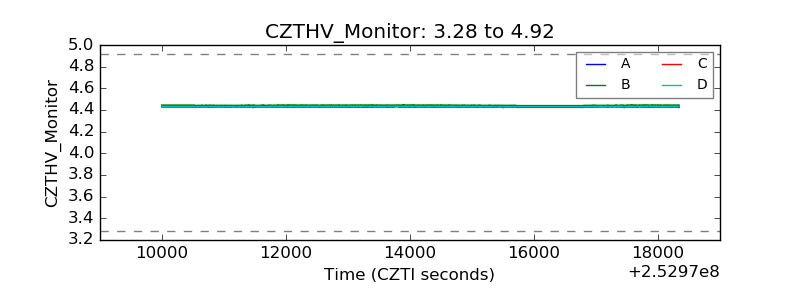 |
| D_VDD | 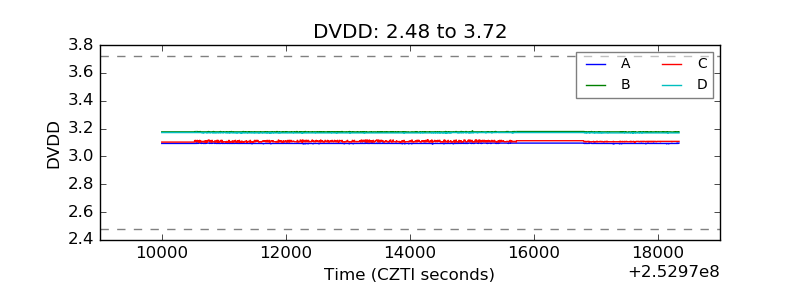 |
| Temperature 1 | 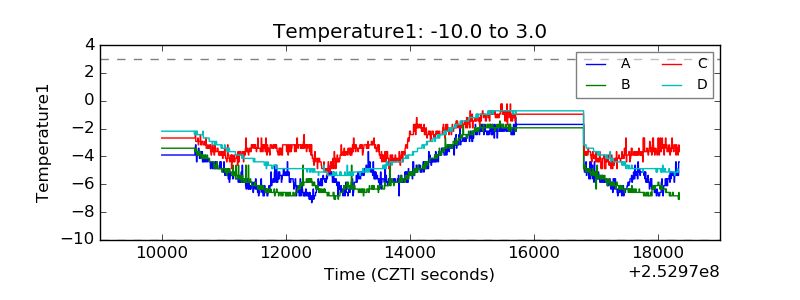 |
| Veto HV Monitor | 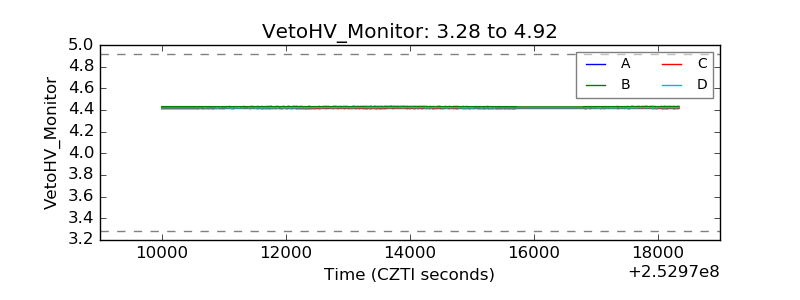 |
| Veto LLD | 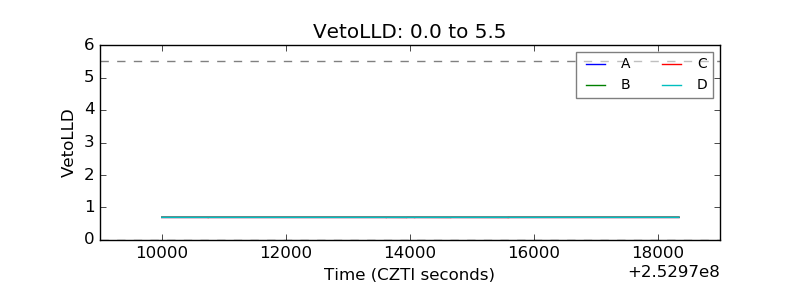 |
| Alpha Counter | 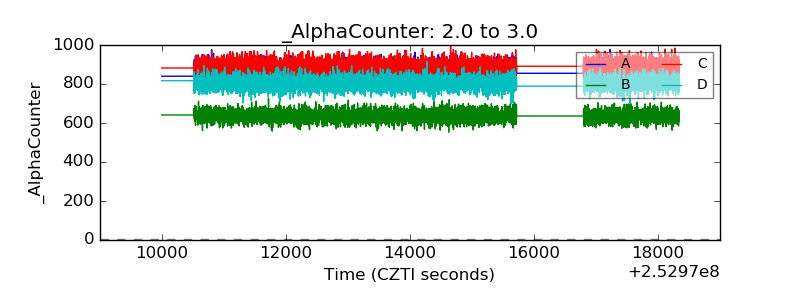 |
| _CPM_Rate | 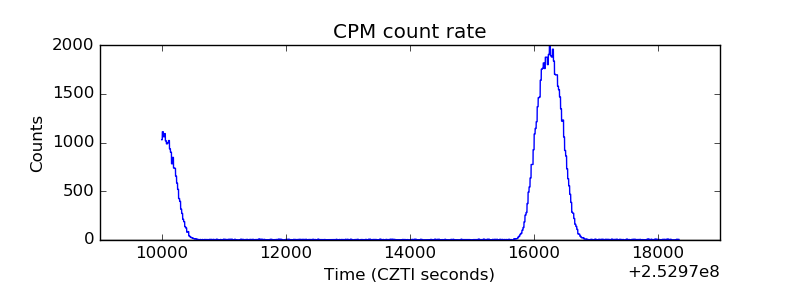 |
| CZT Counter | 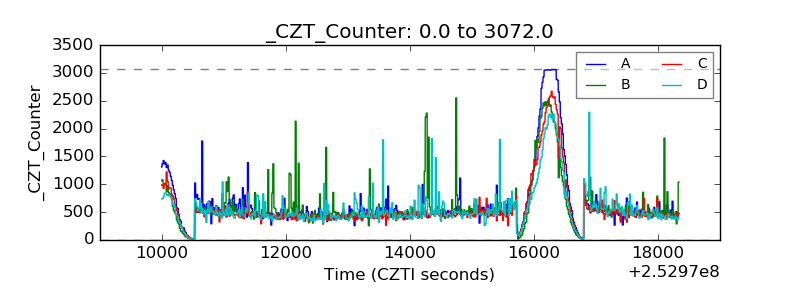 |
| +2.5 Volts monitor |  |
| +5 Volts monitor | 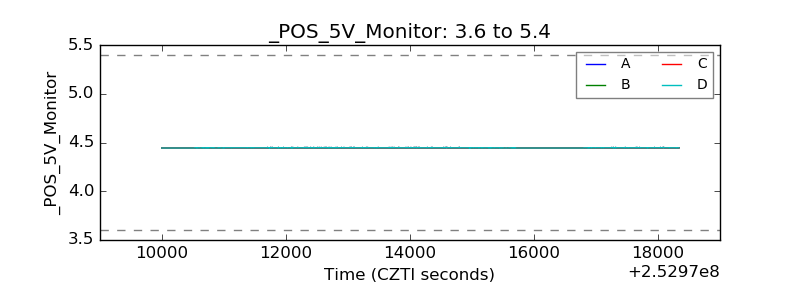 |
| _ROLL_ROT | 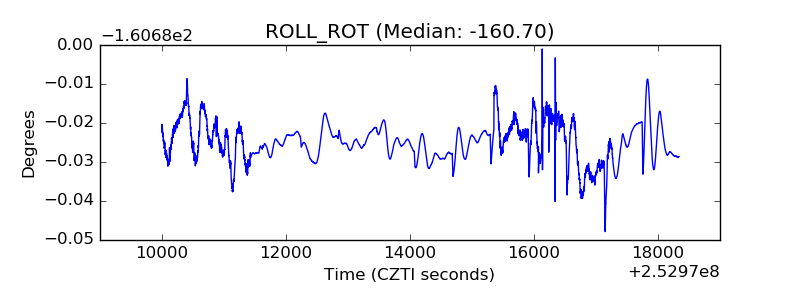 |
| _Roll_DEC | 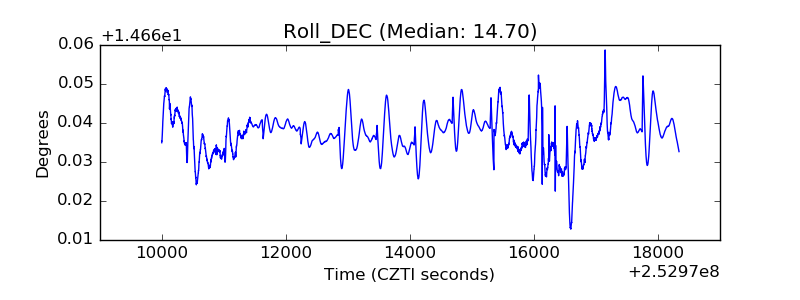 |
| _Roll_RA | 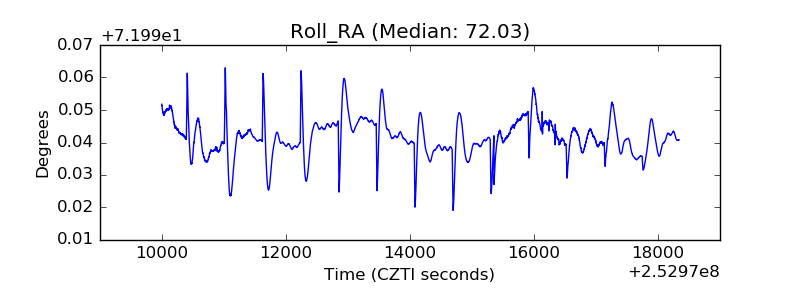 |
| Veto Counter | 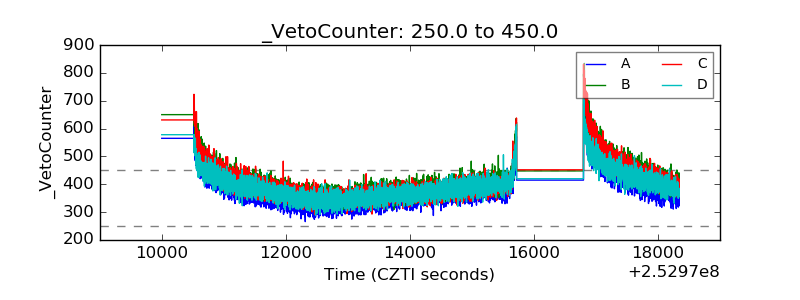 |