| Param | Original file | Final file |
|---|---|---|
| Filename | modeM0/AS1A04_183T02_9000001816_12315cztM0_level2.evt | modeM0/AS1A04_183T02_9000001816_12315cztM0_level2_quad_clean.evt |
| Size (bytes) | 469,281,600 | 72,659,520 |
| Size | 447.5 MB | 69.3 MB |
| Events in quadrant A | 3,546,143 | 439,678 |
| Events in quadrant B | 3,673,529 | 449,245 |
| Events in quadrant C | 3,098,591 | 447,566 |
| Events in quadrant D | 3,460,789 | 418,389 |
| Mode SS | |||
|---|---|---|---|
| Quadrant | BADHDUFLAG | Total packets | Discarded packets |
| A | 0 | 130 | 0 |
| B | 0 | 130 | 0 |
| C | 0 | 130 | 0 |
| D | 0 | 130 | 0 |
| Mode M9 | |||
|---|---|---|---|
| Quadrant | BADHDUFLAG | Total packets | Discarded packets |
| A | 0 | 12 | 0 |
| B | 0 | 12 | 0 |
| C | 0 | 12 | 0 |
| D | 0 | 12 | 0 |
| Mode M0 | |||
|---|---|---|---|
| Quadrant | BADHDUFLAG | Total packets | Discarded packets |
| A | 0 | 14668 | 3 |
| B | 0 | 14852 | 2 |
| C | 0 | 13330 | 2 |
| D | 0 | 14601 | 2 |
| Quadrant | Total seconds | Saturated seconds | Saturation percentage |
|---|---|---|---|
| A | 6378 | 43 | 0.674193% |
| B | 6378 | 144 | 2.257761% |
| C | 6378 | 29 | 0.454688% |
| D | 6378 | 51 | 0.799624% |
Noise dominated data is calculated using 1-second bins in cleaned event files. If a bin has >2000 counts, and if more than 50% of those come from <1% of pixels, then it is considered to be noise-dominated and hence unusable.
| Quadrant | # 1 sec bins | Bins with >0 counts | Bins with >2000 counts | High rate bins dominated by noise | Noise dominated (total time) | Noise dominated (detector-on time) | Marked lightcurve |
|---|---|---|---|---|---|---|---|
| A | 7574 | 6380 | 1 | 1 | 0.01% | 0.02% | 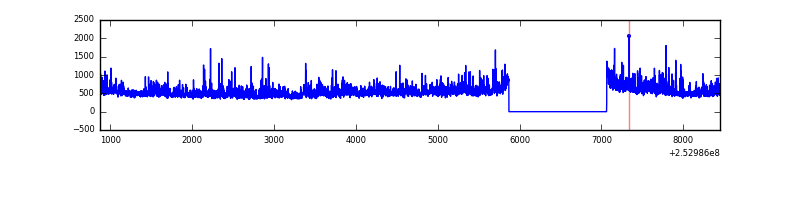 |
| B | 7574 | 6380 | 82 | 82 | 1.08% | 1.29% | 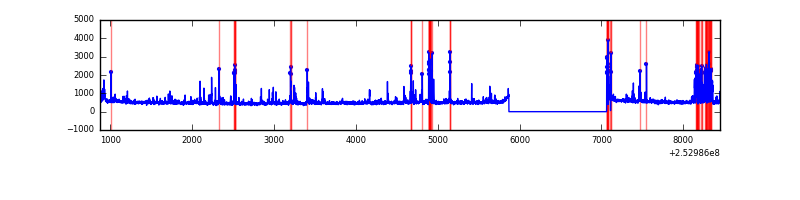 |
| C | 7574 | 6380 | 17 | 17 | 0.22% | 0.27% | 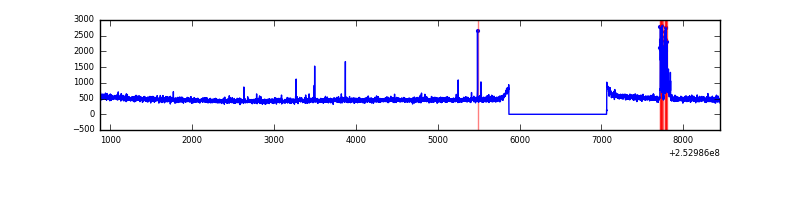 |
| D | 7574 | 6380 | 33 | 33 | 0.44% | 0.52% | 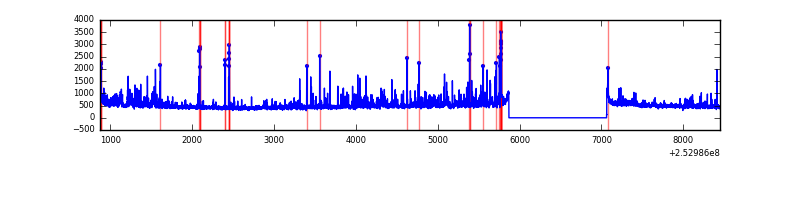 |
Top three noisy pixels from each quadrant. If the there are fewer than three noisy pixels in the level2.evt file, extra rows are filled as -1
| Pixel properties | Quadrant properties | ||||||
|---|---|---|---|---|---|---|---|
| Quadrant | DetID | PixID | Counts | Sigma | Mean | Median | Sigma |
| A | 1 | 162 | 193348 | 1213.55 | 779 | 764 | 158.7 |
| A | 1 | 178 | 110323 | 690.38 | 779 | 764 | 158.7 |
| A | 1 | 161 | 94650 | 591.62 | 779 | 764 | 158.7 |
| B | 4 | 239 | 454569 | 3027.51 | 785 | 766 | 149.9 |
| B | 3 | 64 | 66258 | 436.92 | 785 | 766 | 149.9 |
| B | 0 | 197 | 29002 | 188.37 | 785 | 766 | 149.9 |
| C | 4 | 254 | 109712 | 612.04 | 766 | 773 | 178.0 |
| C | 13 | 61 | 5607 | 27.16 | 766 | 773 | 178.0 |
| C | 8 | 222 | 1893 | 6.29 | 766 | 773 | 178.0 |
| D | 1 | 52 | 301513 | 1667.06 | 753 | 734 | 180.4 |
| D | 8 | 195 | 80389 | 441.49 | 753 | 734 | 180.4 |
| D | 10 | 50 | 64972 | 356.04 | 753 | 734 | 180.4 |
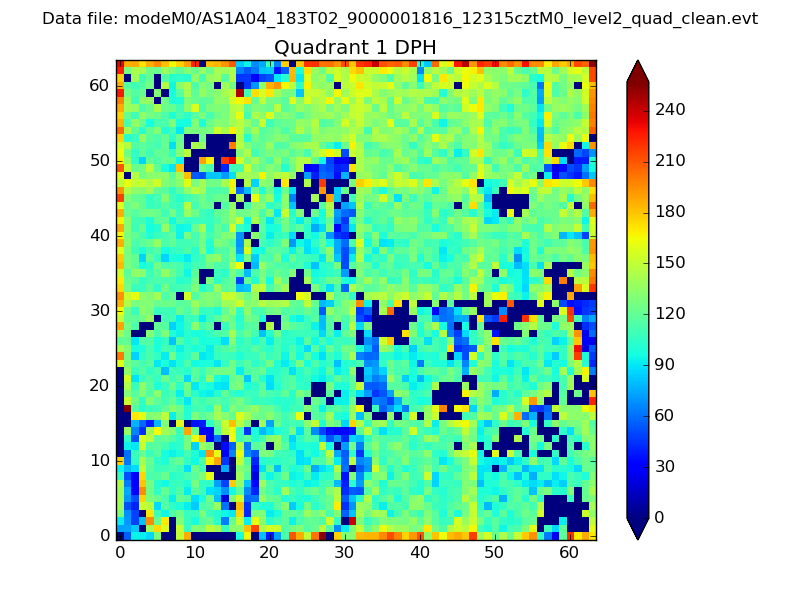
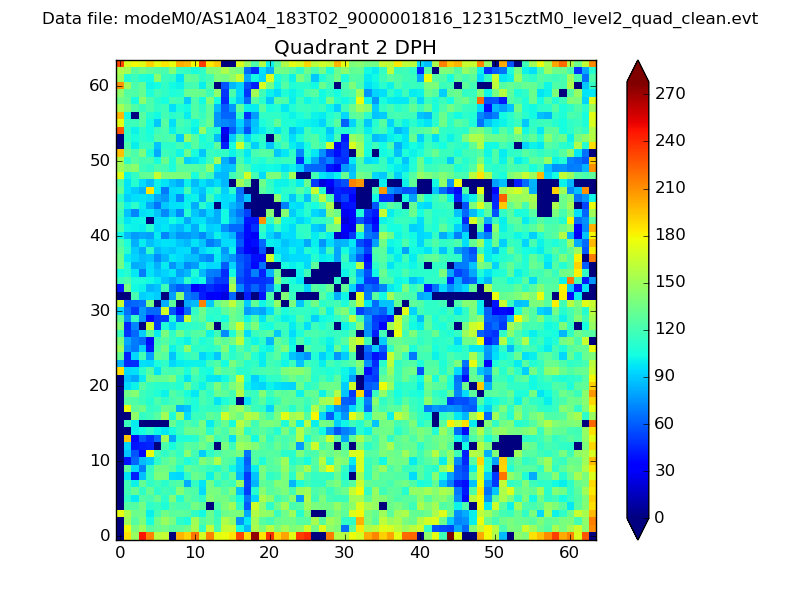
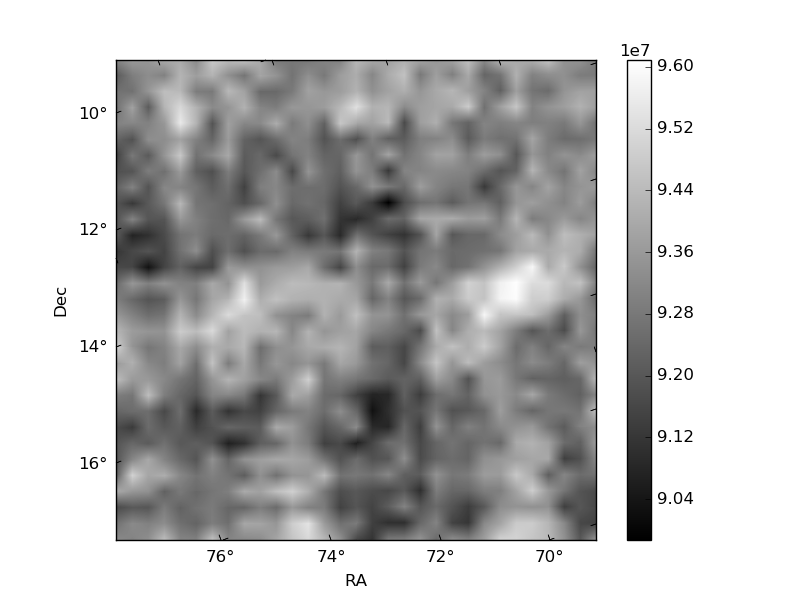
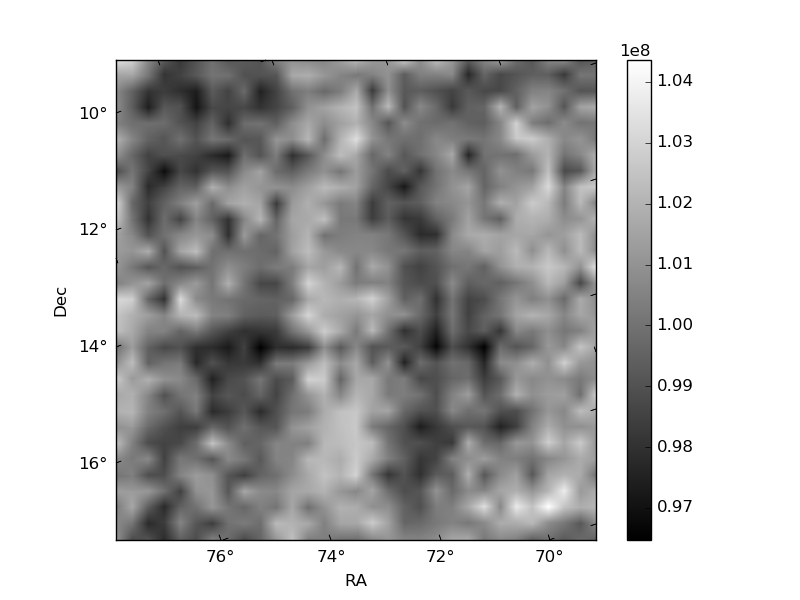
Histogram calculated using DETX and DETY for each event in the final _common_clean file
| Quadrant A |  |
 |
Quadrant B |
|---|---|---|---|
| Quadrant D |  |
 |
Quadrant C |
| Plot type | Count rate plots | Images |
|---|---|---|
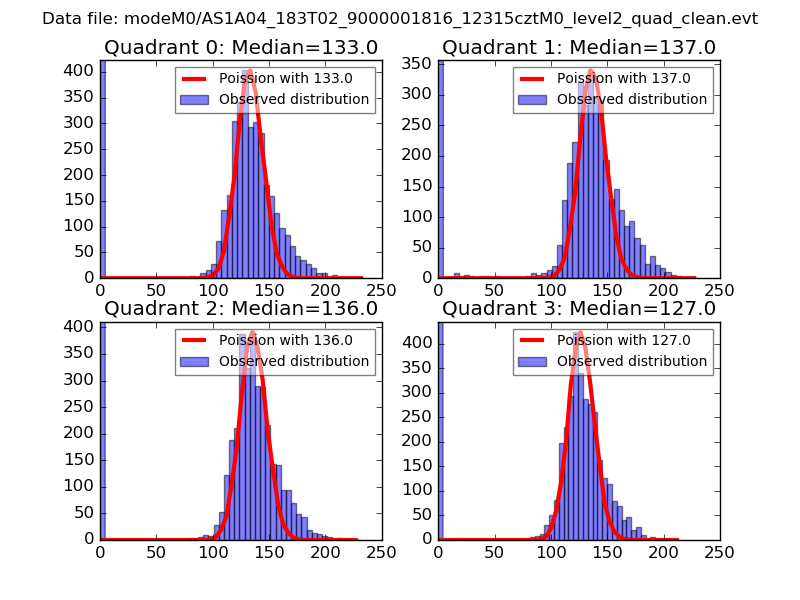
| Comparison with Poisson distribution Blue bars denote a histogram of data divided into 1 sec bins. Red curve is a Poisson curve with rate = median count rate of data. |
 |
 |
| Quadrant-wise count rates Data is divided into 100 sec bins |
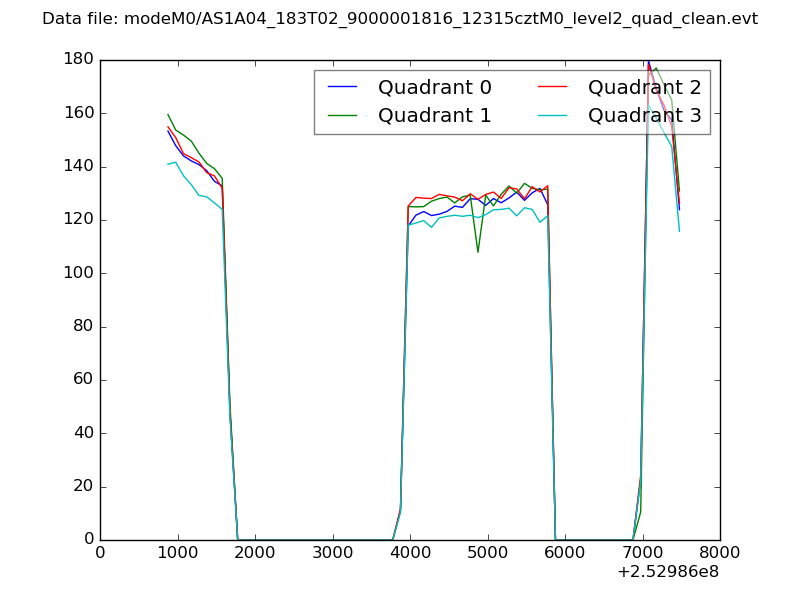 |
|
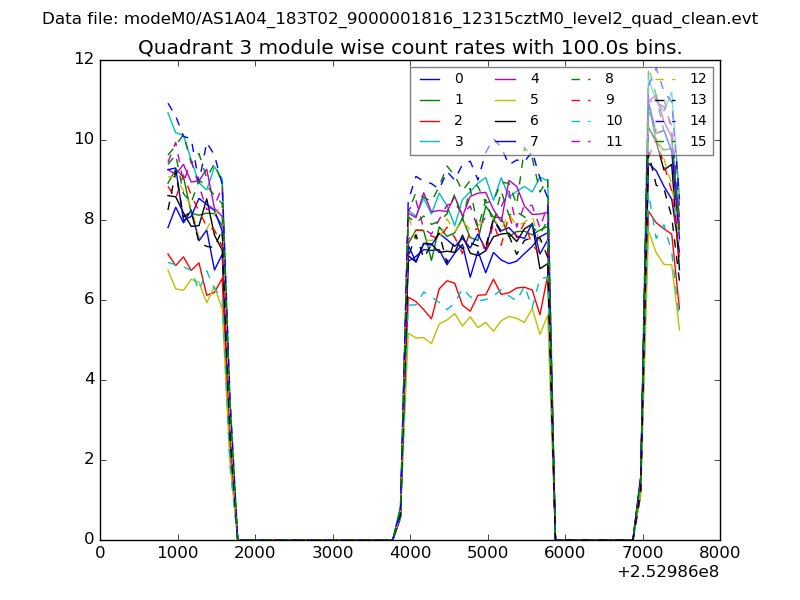
| Module-wise count rates for Quadrant A Data is divided into 100 sec bins |
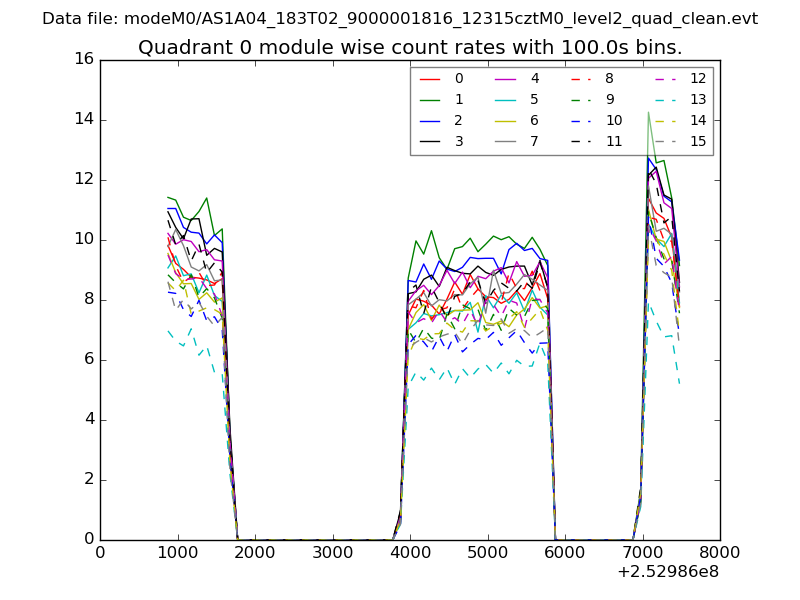 |
 |
| Module-wise count rates for Quadrant B Data is divided into 100 sec bins |
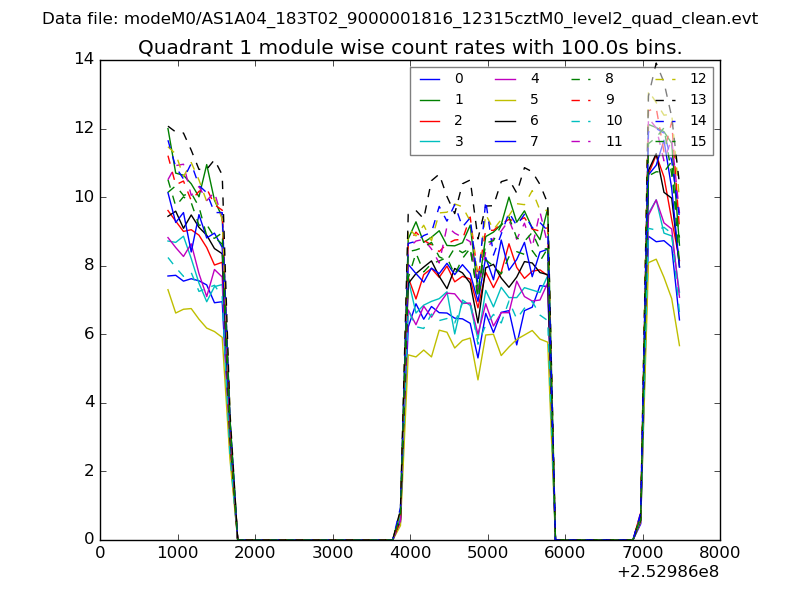 |
 |
| Module-wise count rates for Quadrant C Data is divided into 100 sec bins |
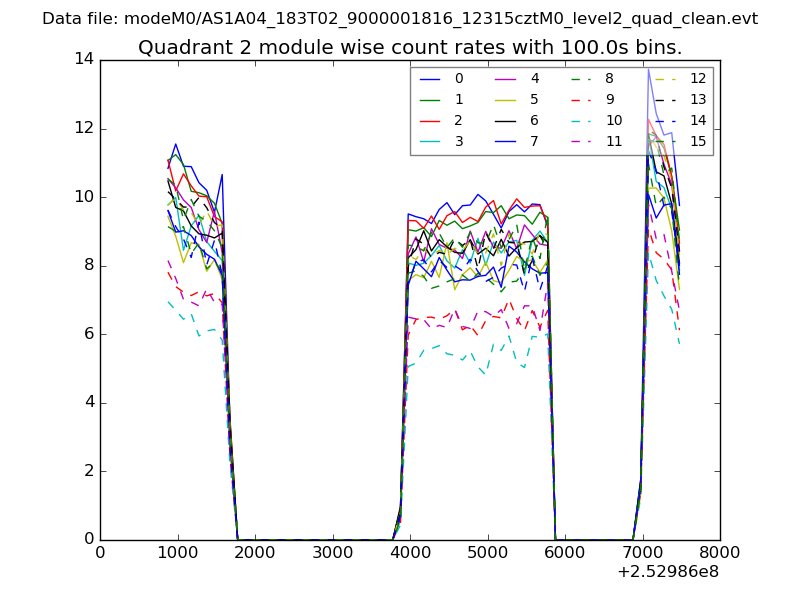 |
 |
| Module-wise count rates for Quadrant D Data is divided into 100 sec bins |
 |
 |
| Parameter | Plot |
|---|---|
| CZT HV Monitor | 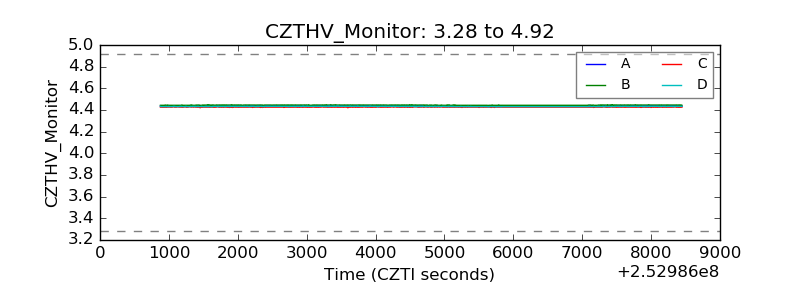 |
| D_VDD |  |
| Temperature 1 | 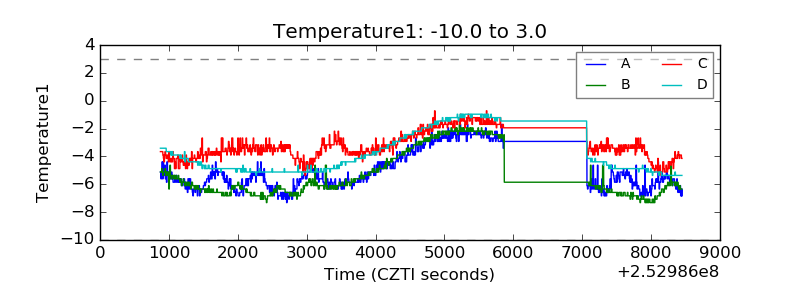 |
| Veto HV Monitor | 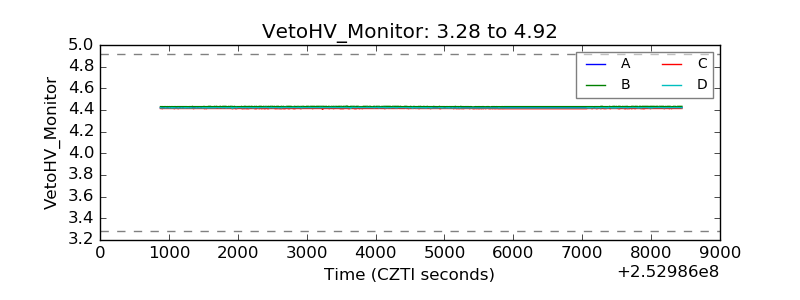 |
| Veto LLD | 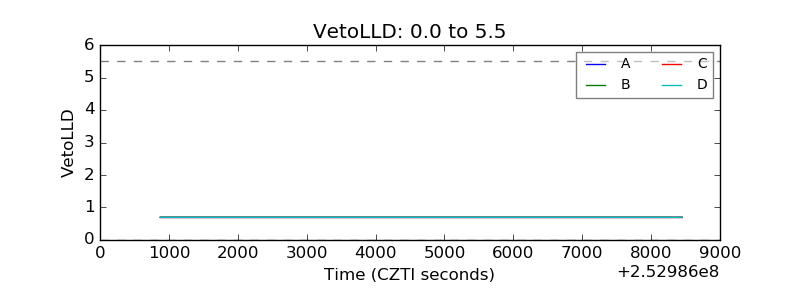 |
| Alpha Counter | 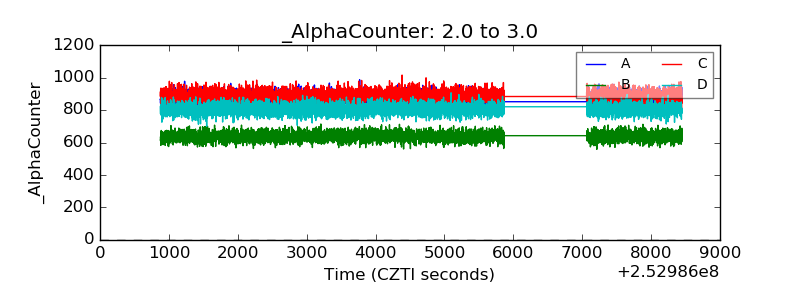 |
| _CPM_Rate | 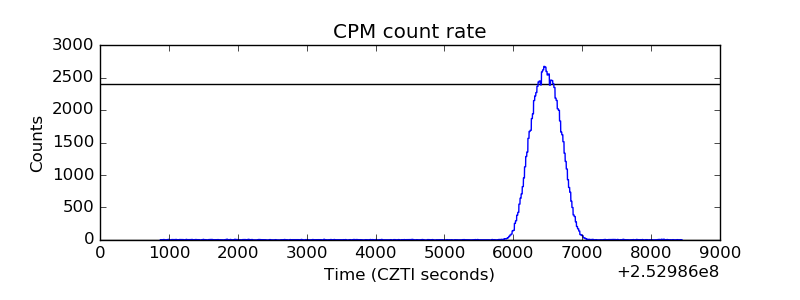 |
| CZT Counter | 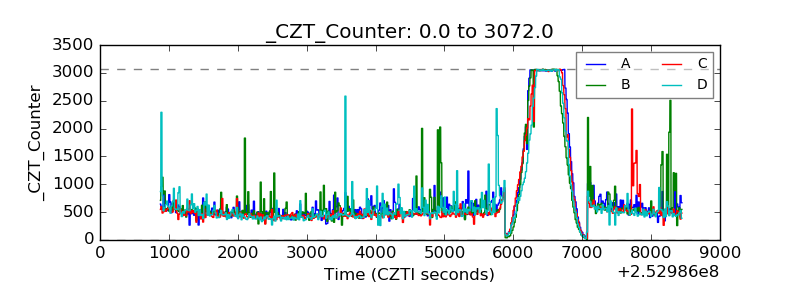 |
| +2.5 Volts monitor |  |
| +5 Volts monitor | 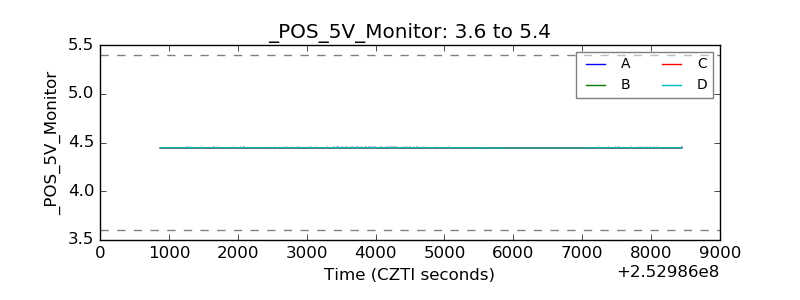 |
| _ROLL_ROT | 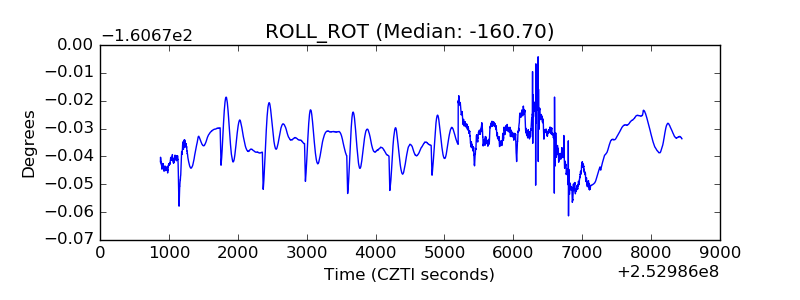 |
| _Roll_DEC | 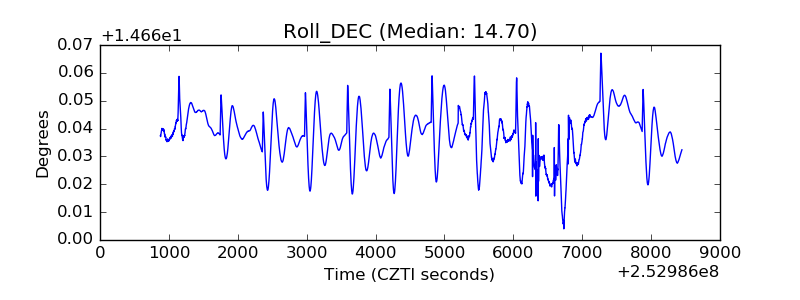 |
| _Roll_RA | 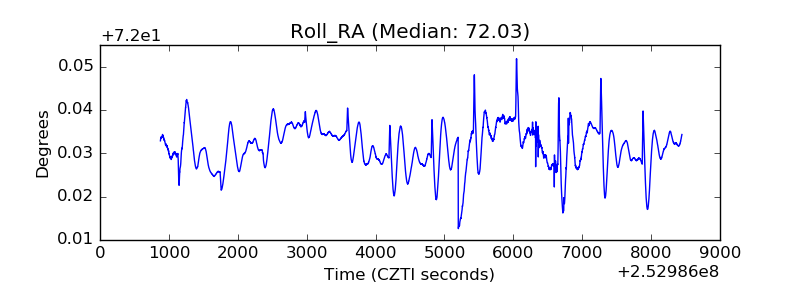 |
| Veto Counter | 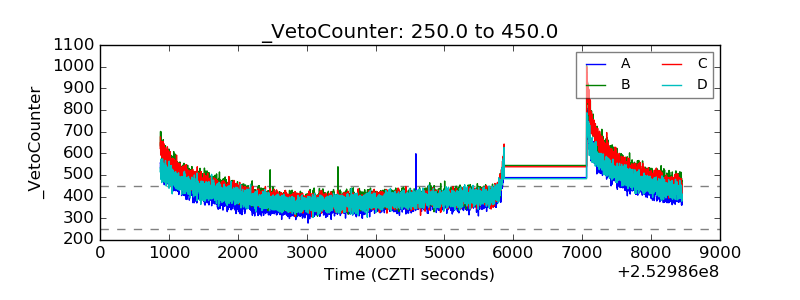 |