| Param | Original file | Final file |
|---|---|---|
| Filename | modeM0/AS1A04_183T02_9000001816_12316cztM0_level2.evt | modeM0/AS1A04_183T02_9000001816_12316cztM0_level2_quad_clean.evt |
| Size (bytes) | 519,546,240 | 66,121,920 |
| Size | 495.5 MB | 63.1 MB |
| Events in quadrant A | 3,589,150 | 391,251 |
| Events in quadrant B | 4,785,277 | 391,067 |
| Events in quadrant C | 3,241,104 | 397,237 |
| Events in quadrant D | 3,684,014 | 374,834 |
| Mode SS | |||
|---|---|---|---|
| Quadrant | BADHDUFLAG | Total packets | Discarded packets |
| A | 0 | 130 | 0 |
| B | 0 | 130 | 0 |
| C | 0 | 130 | 0 |
| D | 0 | 130 | 0 |
| Mode M9 | |||
|---|---|---|---|
| Quadrant | BADHDUFLAG | Total packets | Discarded packets |
| A | 0 | 21 | 0 |
| B | 0 | 21 | 0 |
| C | 0 | 21 | 0 |
| D | 0 | 22 | 0 |
| Mode M0 | |||
|---|---|---|---|
| Quadrant | BADHDUFLAG | Total packets | Discarded packets |
| A | 0 | 14734 | 3 |
| B | 0 | 18327 | 2 |
| C | 0 | 13636 | 2 |
| D | 0 | 15102 | 2 |
| Quadrant | Total seconds | Saturated seconds | Saturation percentage |
|---|---|---|---|
| A | 6416 | 82 | 1.278055% |
| B | 6416 | 405 | 6.312344% |
| C | 6416 | 45 | 0.701372% |
| D | 6416 | 93 | 1.449501% |
Noise dominated data is calculated using 1-second bins in cleaned event files. If a bin has >2000 counts, and if more than 50% of those come from <1% of pixels, then it is considered to be noise-dominated and hence unusable.
| Quadrant | # 1 sec bins | Bins with >0 counts | Bins with >2000 counts | High rate bins dominated by noise | Noise dominated (total time) | Noise dominated (detector-on time) | Marked lightcurve |
|---|---|---|---|---|---|---|---|
| A | 7677 | 6418 | 5 | 5 | 0.07% | 0.08% | 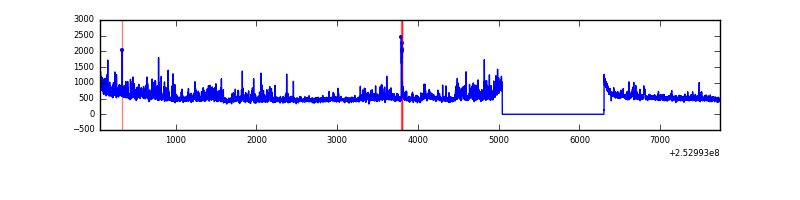 |
| B | 7677 | 6418 | 221 | 221 | 2.88% | 3.44% | 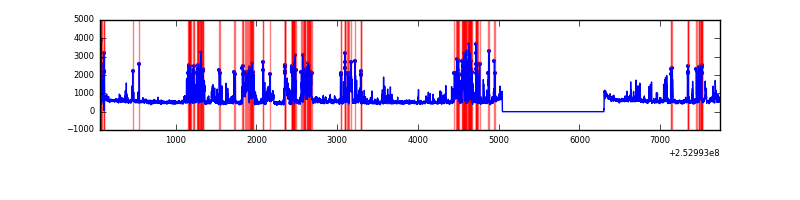 |
| C | 7677 | 6418 | 16 | 16 | 0.21% | 0.25% | 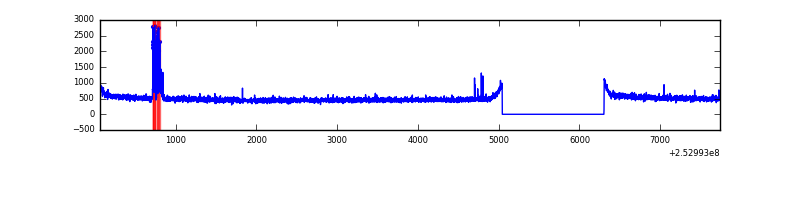 |
| D | 7677 | 6418 | 42 | 42 | 0.55% | 0.65% | 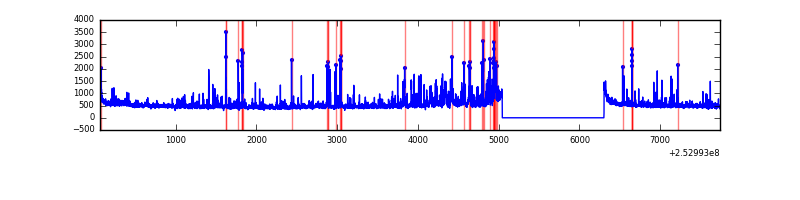 |
Top three noisy pixels from each quadrant. If the there are fewer than three noisy pixels in the level2.evt file, extra rows are filled as -1
| Pixel properties | Quadrant properties | ||||||
|---|---|---|---|---|---|---|---|
| Quadrant | DetID | PixID | Counts | Sigma | Mean | Median | Sigma |
| A | 1 | 162 | 134684 | 808.49 | 825 | 810 | 165.6 |
| A | 1 | 178 | 77157 | 461.07 | 825 | 810 | 165.6 |
| A | 1 | 161 | 66827 | 398.69 | 825 | 810 | 165.6 |
| B | 4 | 239 | 772484 | 5005.68 | 820 | 803 | 154.2 |
| B | 3 | 64 | 718226 | 4653.72 | 820 | 803 | 154.2 |
| B | 0 | 205 | 24166 | 151.55 | 820 | 803 | 154.2 |
| C | 4 | 254 | 96979 | 512.31 | 807 | 813 | 187.7 |
| C | 13 | 61 | 5909 | 27.15 | 807 | 813 | 187.7 |
| C | 3 | 202 | 1936 | 5.98 | 807 | 813 | 187.7 |
| D | 1 | 52 | 445692 | 2322.52 | 794 | 774 | 191.6 |
| D | 5 | 222 | 68775 | 354.97 | 794 | 774 | 191.6 |
| D | 8 | 195 | 52118 | 268.02 | 794 | 774 | 191.6 |
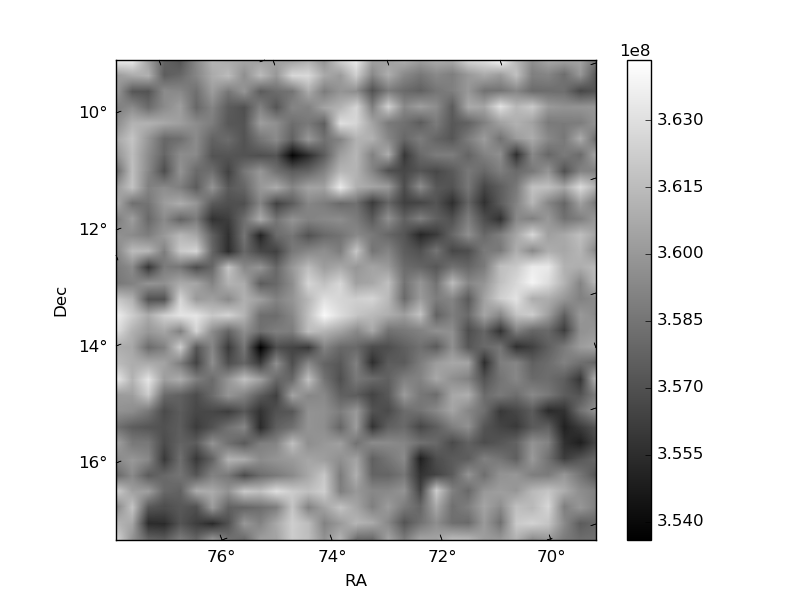
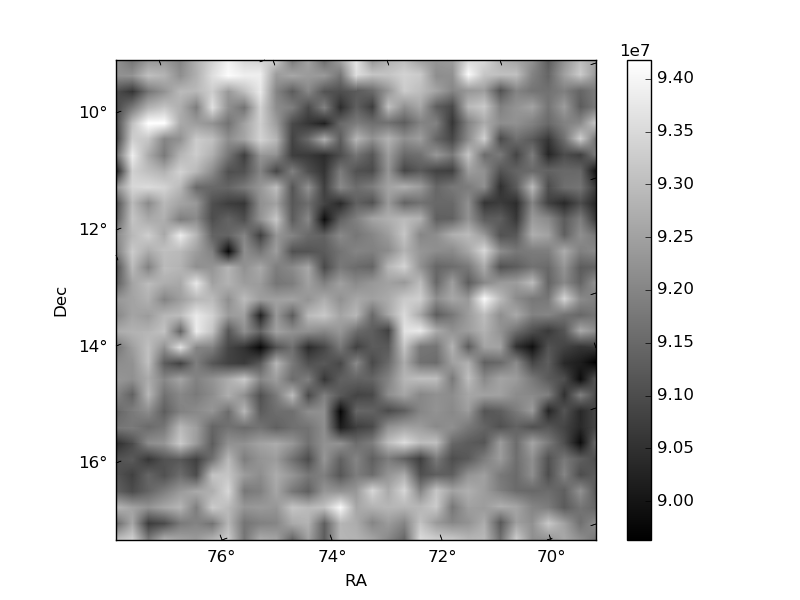
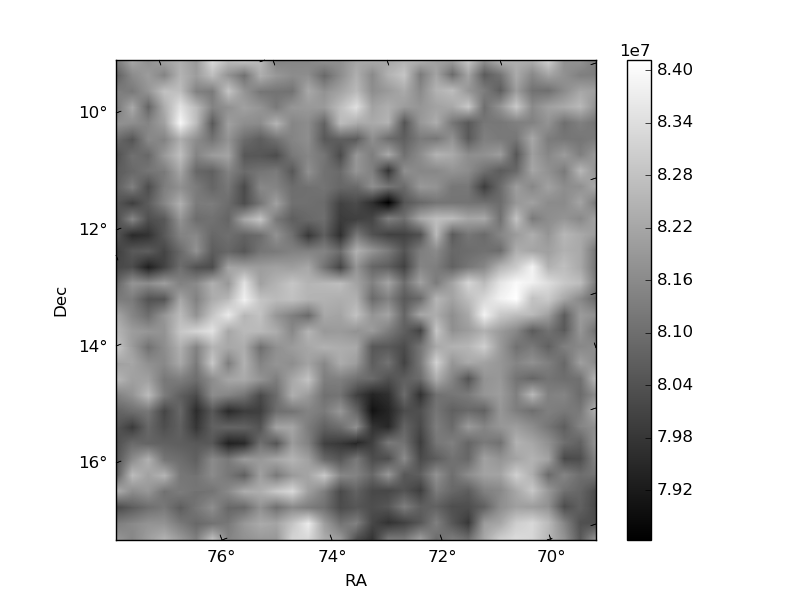
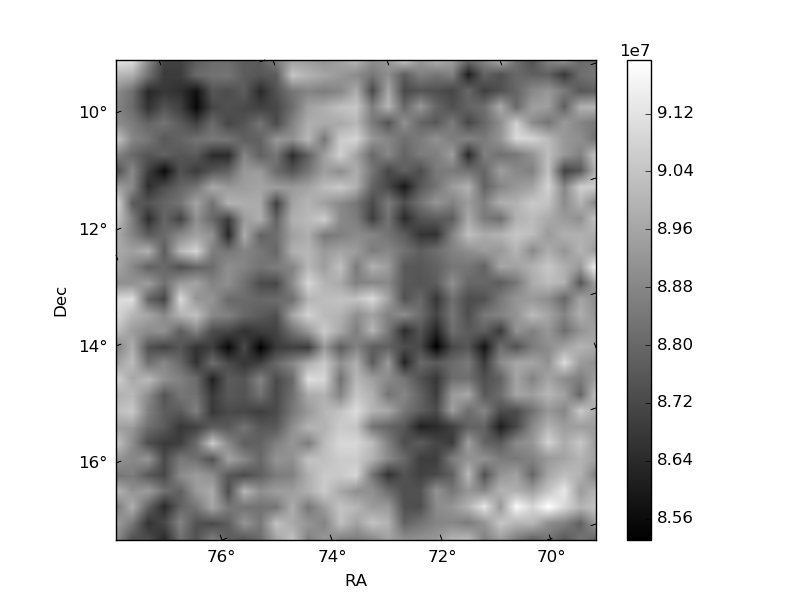
Histogram calculated using DETX and DETY for each event in the final _common_clean file
| Quadrant A | 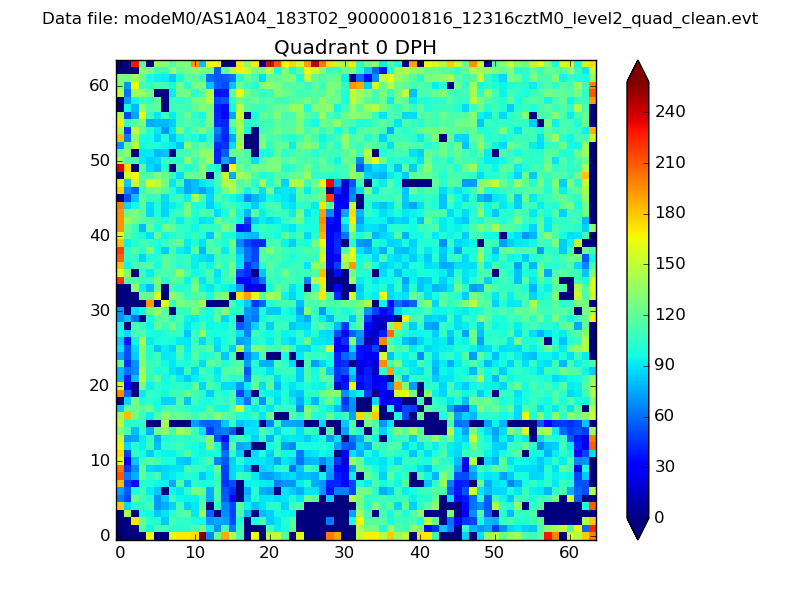 |
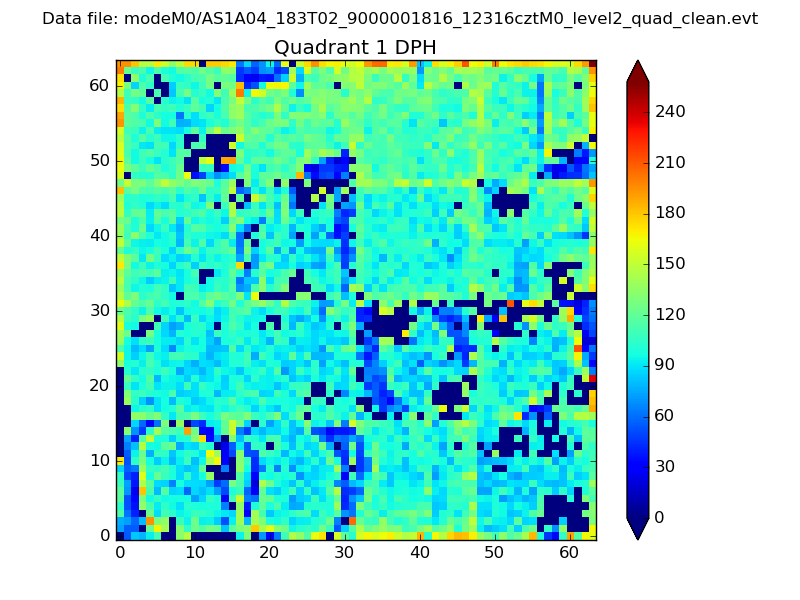 |
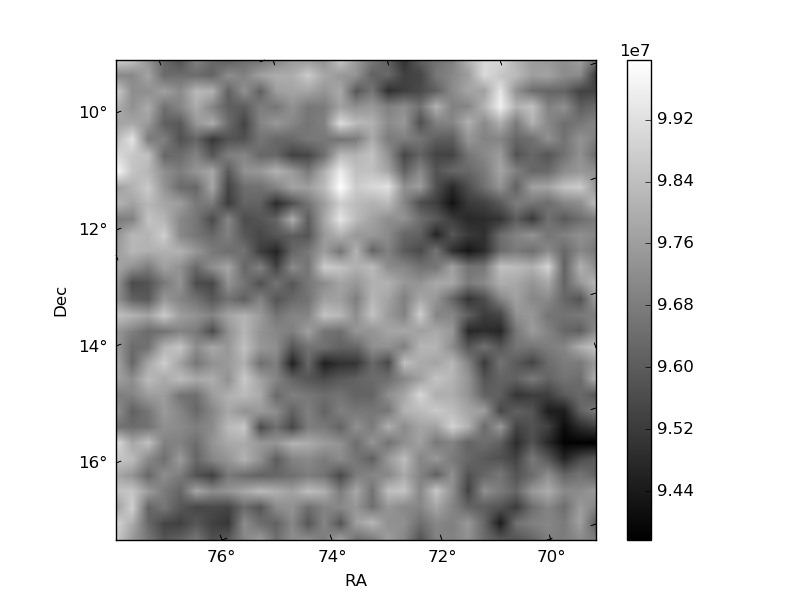
Quadrant B |
|---|---|---|---|
| Quadrant D | 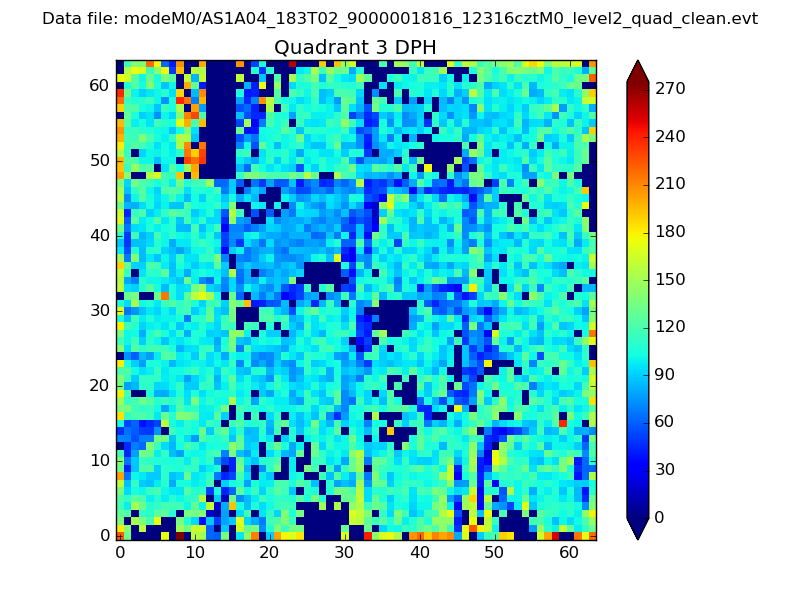 |
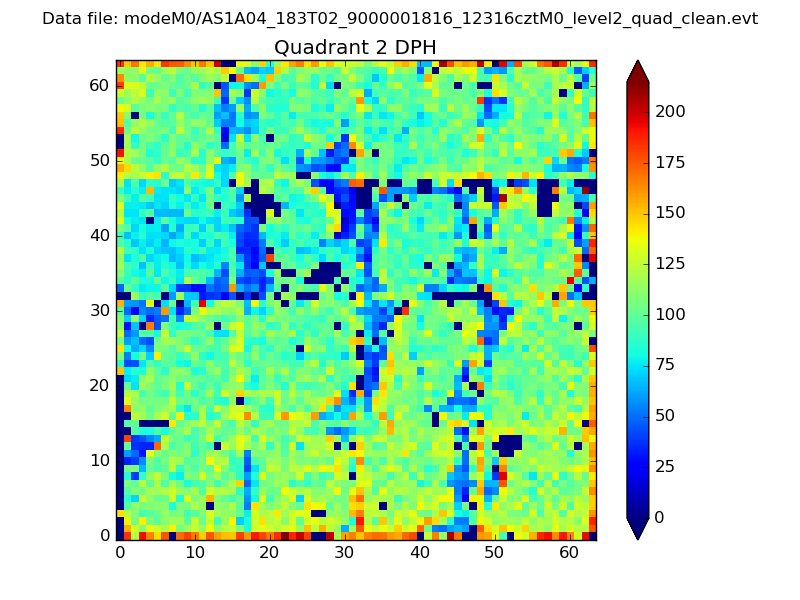 |
Quadrant C |
| Plot type | Count rate plots | Images |
|---|---|---|
| Comparison with Poisson distribution Blue bars denote a histogram of data divided into 1 sec bins. Red curve is a Poisson curve with rate = median count rate of data. |
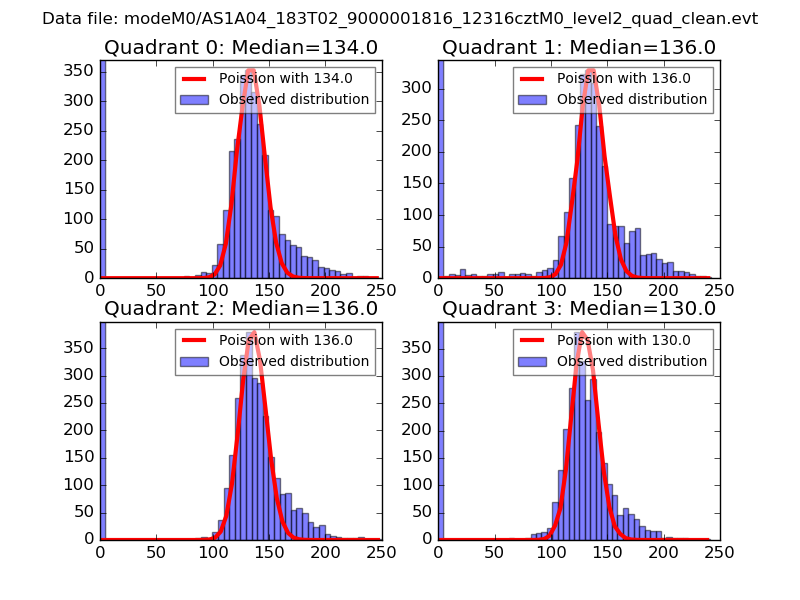 |
 |
| Quadrant-wise count rates Data is divided into 100 sec bins |
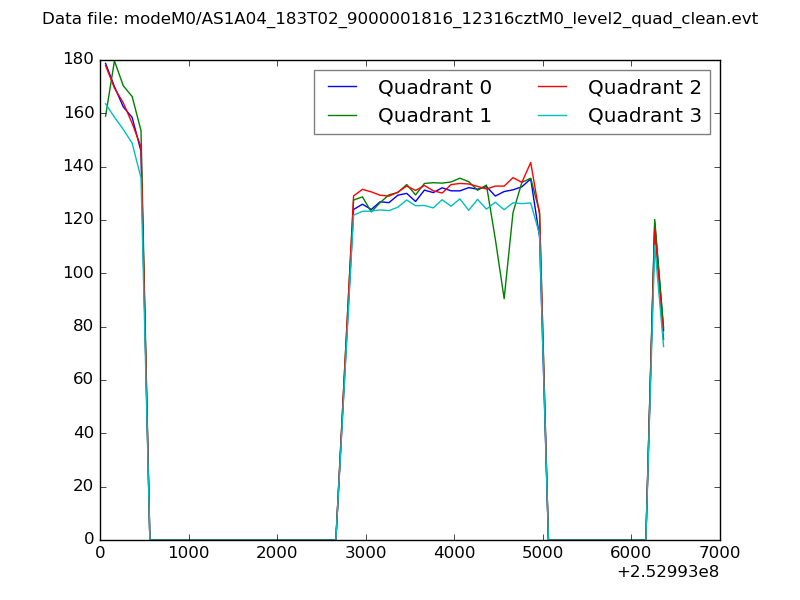 |
|
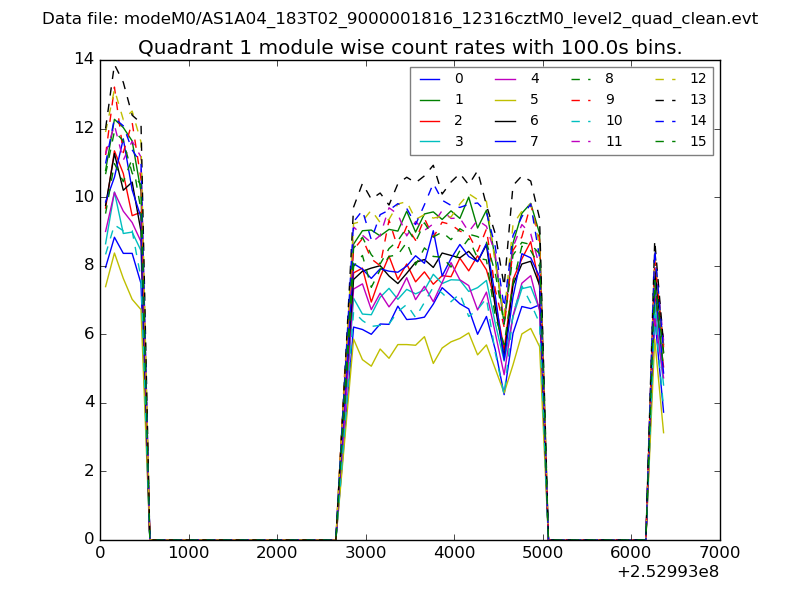
| Module-wise count rates for Quadrant A Data is divided into 100 sec bins |
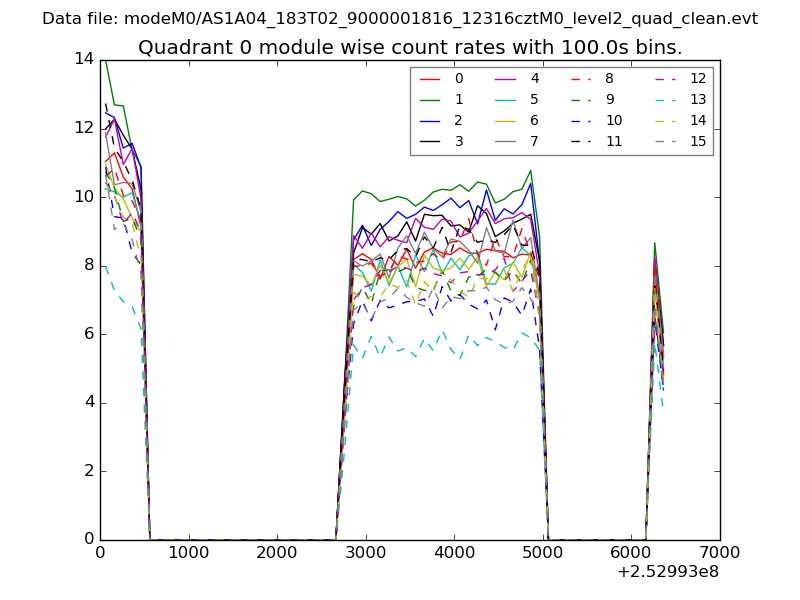 |
 |
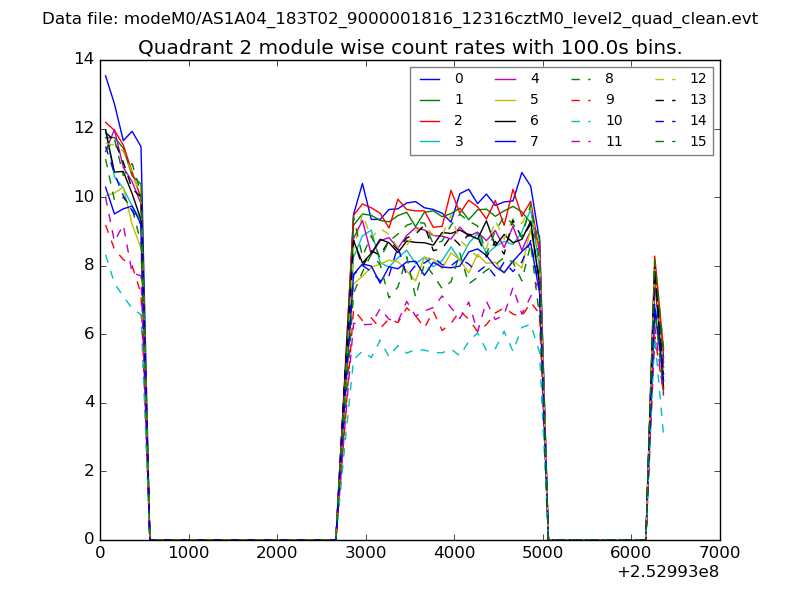
| Module-wise count rates for Quadrant B Data is divided into 100 sec bins |
 |
 |
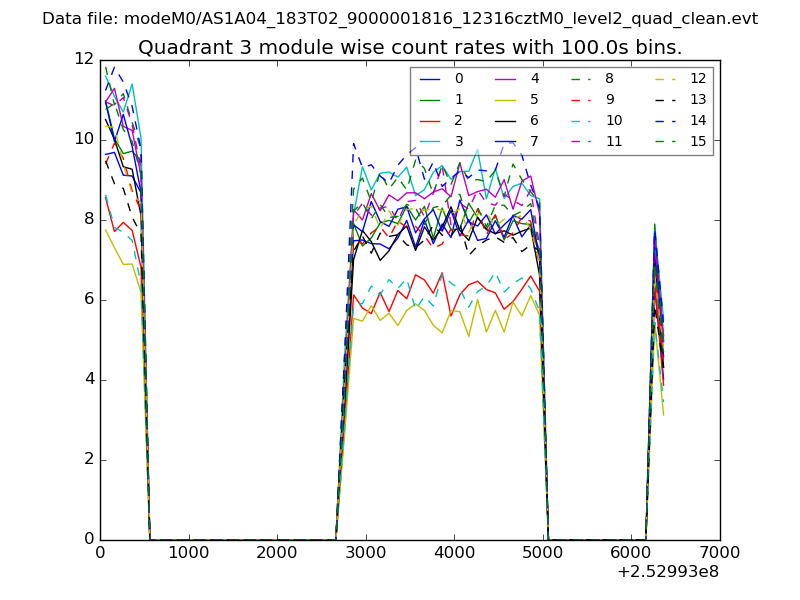
| Module-wise count rates for Quadrant C Data is divided into 100 sec bins |
 |
 |
| Module-wise count rates for Quadrant D Data is divided into 100 sec bins |
 |
 |
| Parameter | Plot |
|---|---|
| CZT HV Monitor | 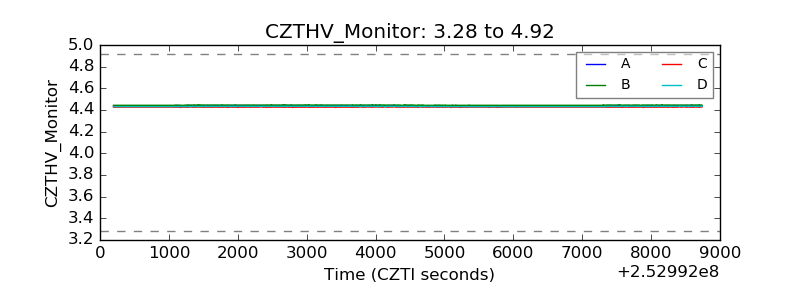 |
| D_VDD | 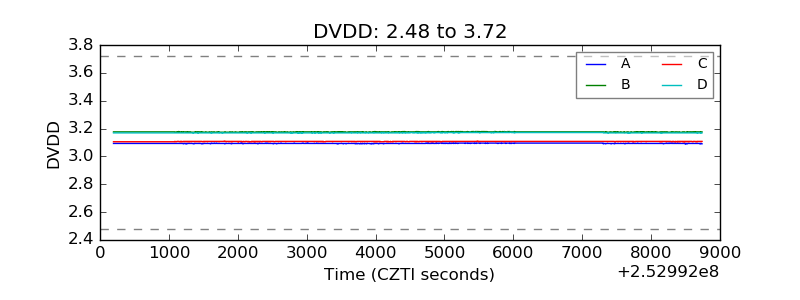 |
| Temperature 1 | 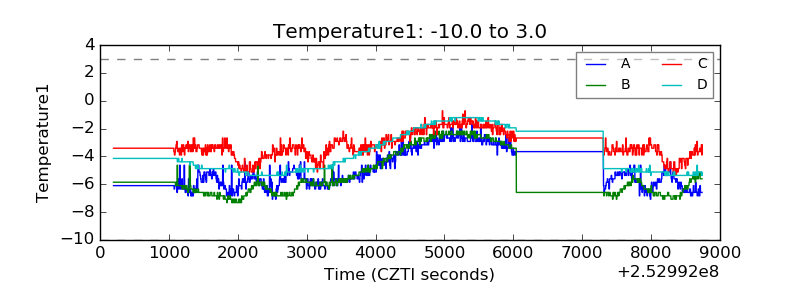 |
| Veto HV Monitor | 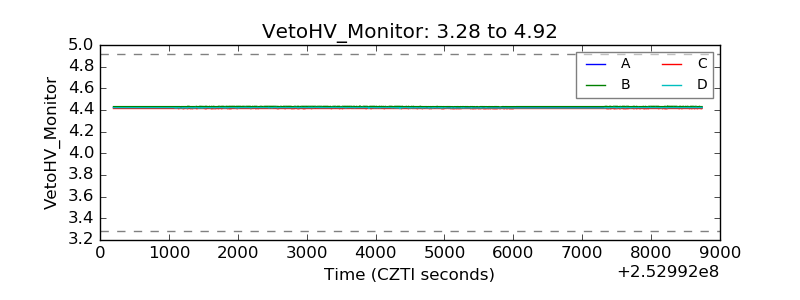 |
| Veto LLD | 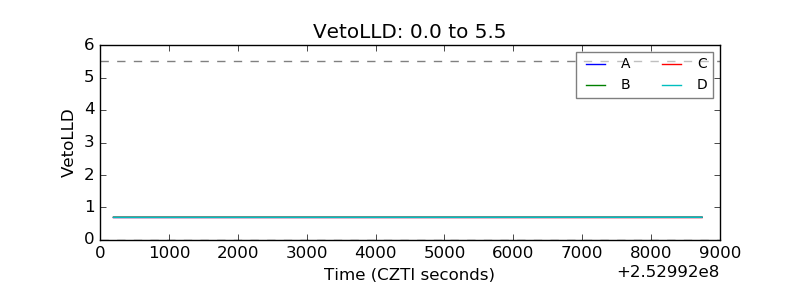 |
| Alpha Counter | 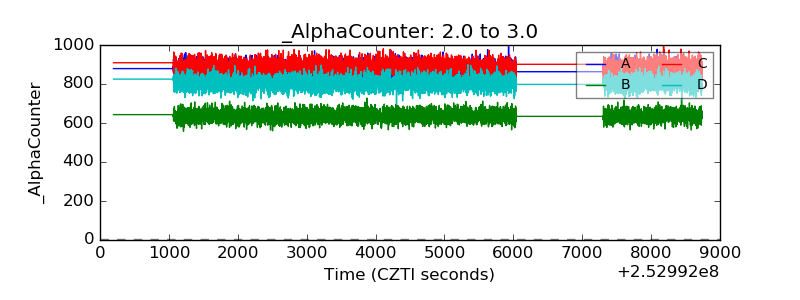 |
| _CPM_Rate | 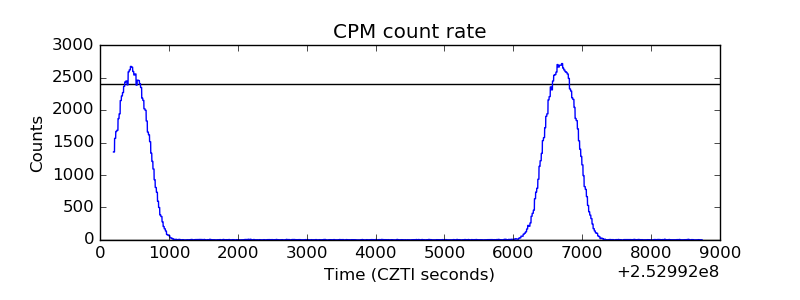 |
| CZT Counter | 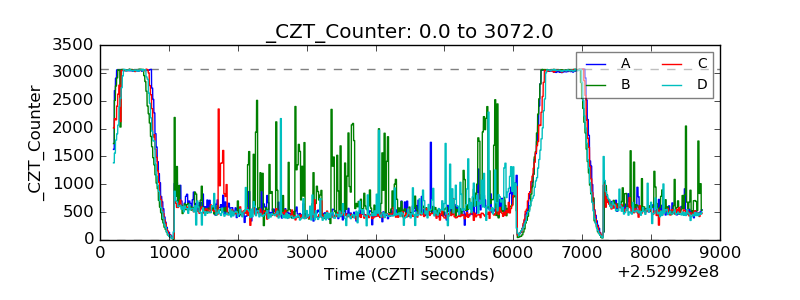 |
| +2.5 Volts monitor |  |
| +5 Volts monitor |  |
| _ROLL_ROT | 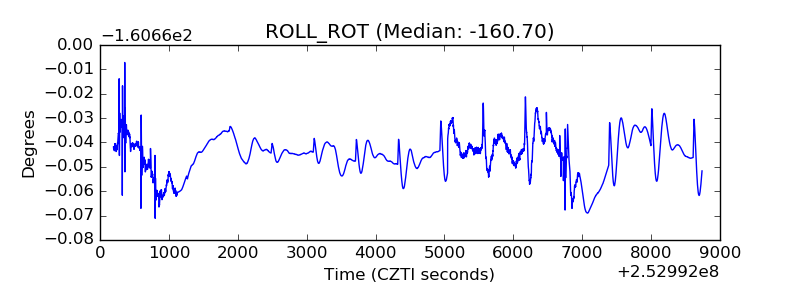 |
| _Roll_DEC | 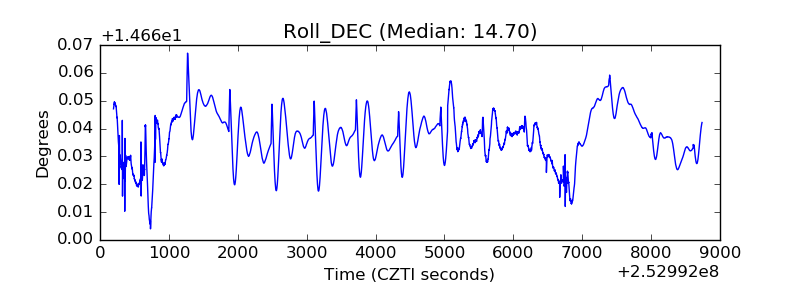 |
| _Roll_RA | 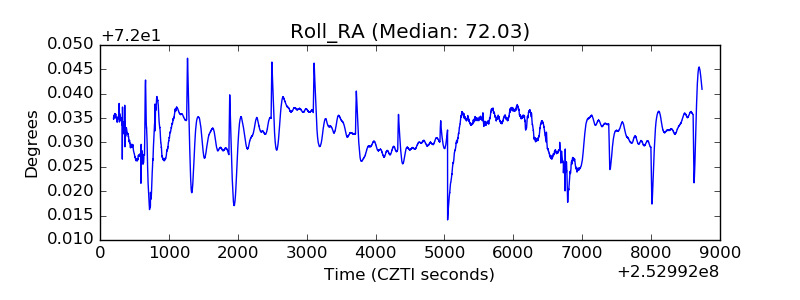 |
| Veto Counter | 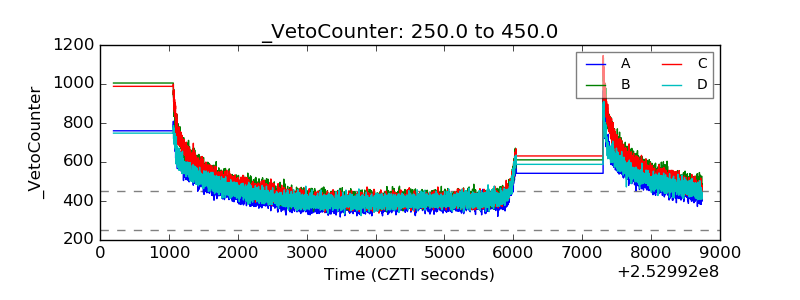 |