| Param | Original file | Final file |
|---|---|---|
| Filename | modeM0/AS1A04_183T02_9000001816_12317cztM0_level2.evt | modeM0/AS1A04_183T02_9000001816_12317cztM0_level2_quad_clean.evt |
| Size (bytes) | 505,995,840 | 63,167,040 |
| Size | 482.6 MB | 60.2 MB |
| Events in quadrant A | 3,754,795 | 365,960 |
| Events in quadrant B | 4,468,372 | 374,352 |
| Events in quadrant C | 3,248,090 | 372,871 |
| Events in quadrant D | 3,421,371 | 355,387 |
| Mode SS | |||
|---|---|---|---|
| Quadrant | BADHDUFLAG | Total packets | Discarded packets |
| A | 0 | 128 | 0 |
| B | 0 | 128 | 0 |
| C | 0 | 128 | 0 |
| D | 0 | 128 | 0 |
| Mode M9 | |||
|---|---|---|---|
| Quadrant | BADHDUFLAG | Total packets | Discarded packets |
| A | 0 | 20 | 0 |
| B | 0 | 20 | 0 |
| C | 0 | 20 | 0 |
| D | 0 | 21 | 0 |
| Mode M0 | |||
|---|---|---|---|
| Quadrant | BADHDUFLAG | Total packets | Discarded packets |
| A | 0 | 15231 | 3 |
| B | 0 | 17277 | 2 |
| C | 0 | 13515 | 2 |
| D | 0 | 14174 | 2 |
| Quadrant | Total seconds | Saturated seconds | Saturation percentage |
|---|---|---|---|
| A | 6364 | 149 | 2.341295% |
| B | 6364 | 394 | 6.191075% |
| C | 6364 | 83 | 1.304211% |
| D | 6364 | 90 | 1.414205% |
Noise dominated data is calculated using 1-second bins in cleaned event files. If a bin has >2000 counts, and if more than 50% of those come from <1% of pixels, then it is considered to be noise-dominated and hence unusable.
| Quadrant | # 1 sec bins | Bins with >0 counts | Bins with >2000 counts | High rate bins dominated by noise | Noise dominated (total time) | Noise dominated (detector-on time) | Marked lightcurve |
|---|---|---|---|---|---|---|---|
| A | 7640 | 6366 | 4 | 4 | 0.05% | 0.06% |  |
| B | 7640 | 6366 | 173 | 173 | 2.26% | 2.72% |  |
| C | 7640 | 6366 | 3 | 3 | 0.04% | 0.05% |  |
| D | 7640 | 6366 | 14 | 14 | 0.18% | 0.22% | 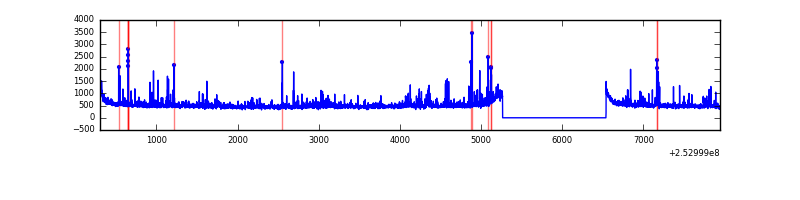 |
Top three noisy pixels from each quadrant. If the there are fewer than three noisy pixels in the level2.evt file, extra rows are filled as -1
| Pixel properties | Quadrant properties | ||||||
|---|---|---|---|---|---|---|---|
| Quadrant | DetID | PixID | Counts | Sigma | Mean | Median | Sigma |
| A | 1 | 162 | 167852 | 976.03 | 846 | 829 | 171.1 |
| A | 1 | 178 | 93920 | 544.0 | 846 | 829 | 171.1 |
| A | 1 | 161 | 82246 | 475.78 | 846 | 829 | 171.1 |
| B | 4 | 239 | 654899 | 4155.88 | 843 | 825 | 157.4 |
| B | 3 | 64 | 420200 | 2664.64 | 843 | 825 | 157.4 |
| B | 10 | 244 | 24160 | 148.27 | 843 | 825 | 157.4 |
| C | 4 | 254 | 18248 | 91.35 | 825 | 832 | 190.6 |
| C | 14 | 234 | 9887 | 47.5 | 825 | 832 | 190.6 |
| C | 13 | 61 | 6173 | 28.02 | 825 | 832 | 190.6 |
| D | 1 | 52 | 155695 | 798.07 | 813 | 793 | 194.1 |
| D | 13 | 104 | 55431 | 281.5 | 813 | 793 | 194.1 |
| D | 8 | 195 | 30707 | 154.12 | 813 | 793 | 194.1 |
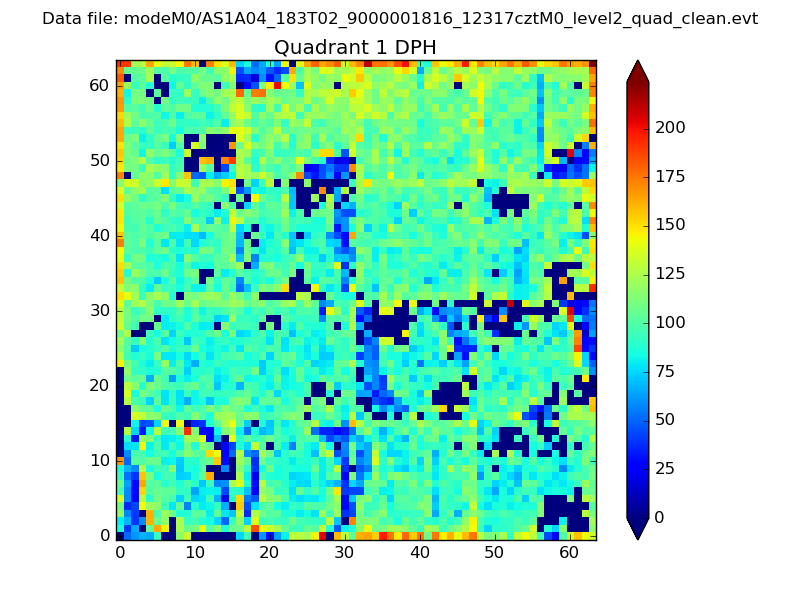
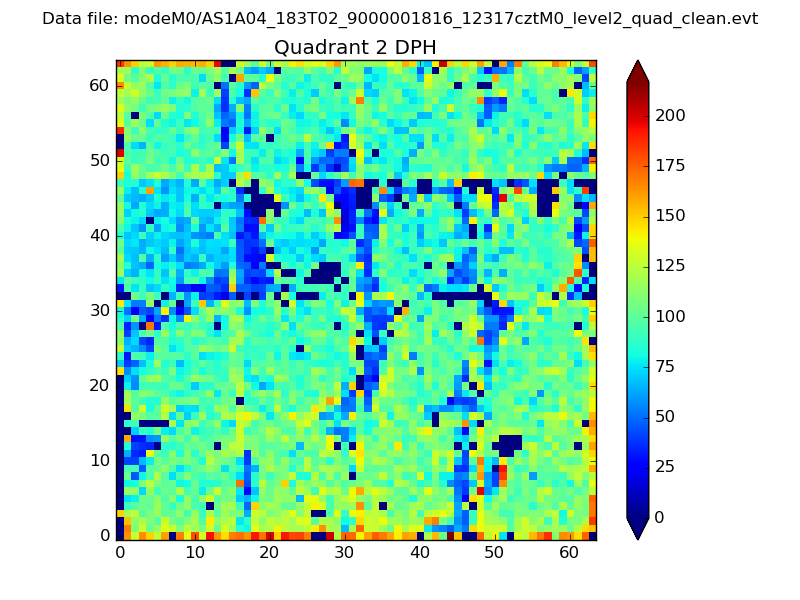
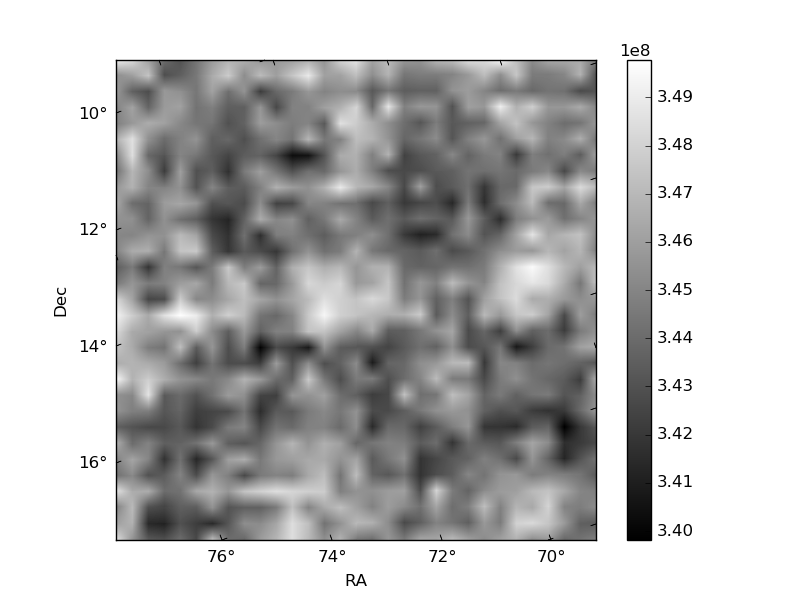
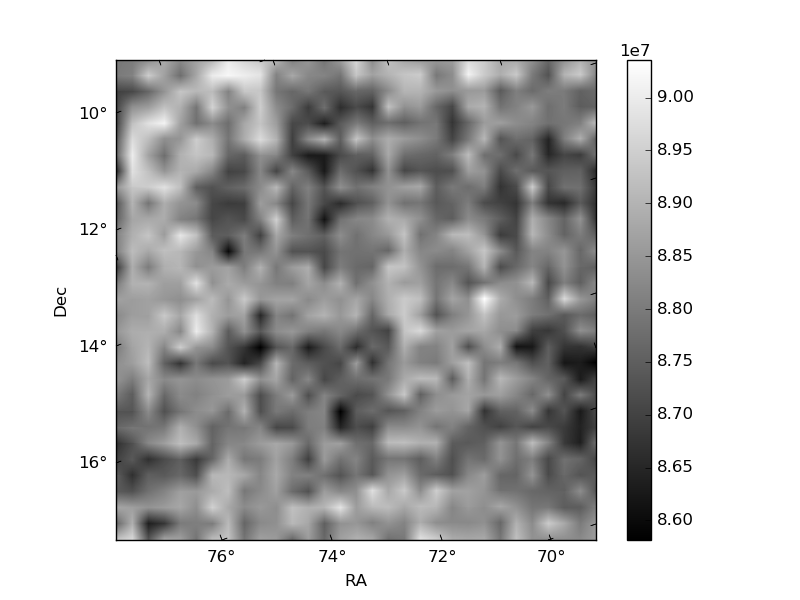
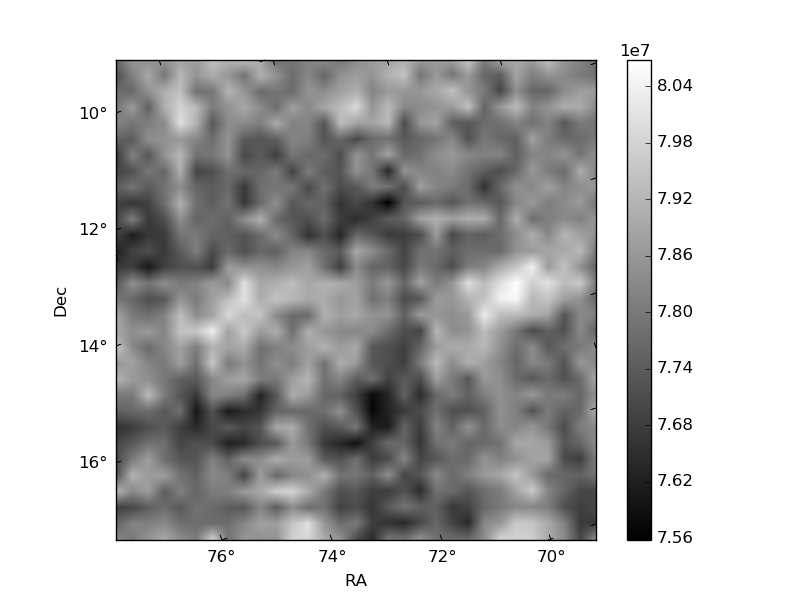
Histogram calculated using DETX and DETY for each event in the final _common_clean file
| Quadrant A |  |
 |
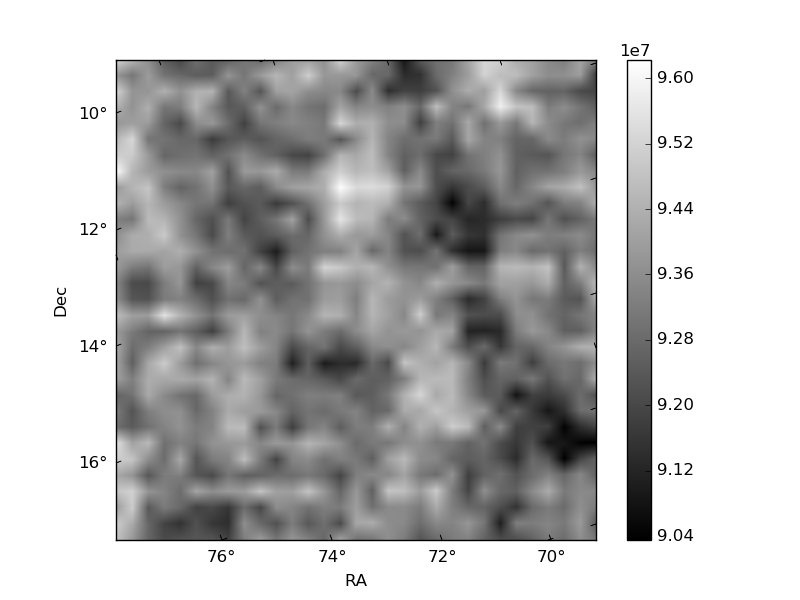
Quadrant B |
|---|---|---|---|
| Quadrant D | 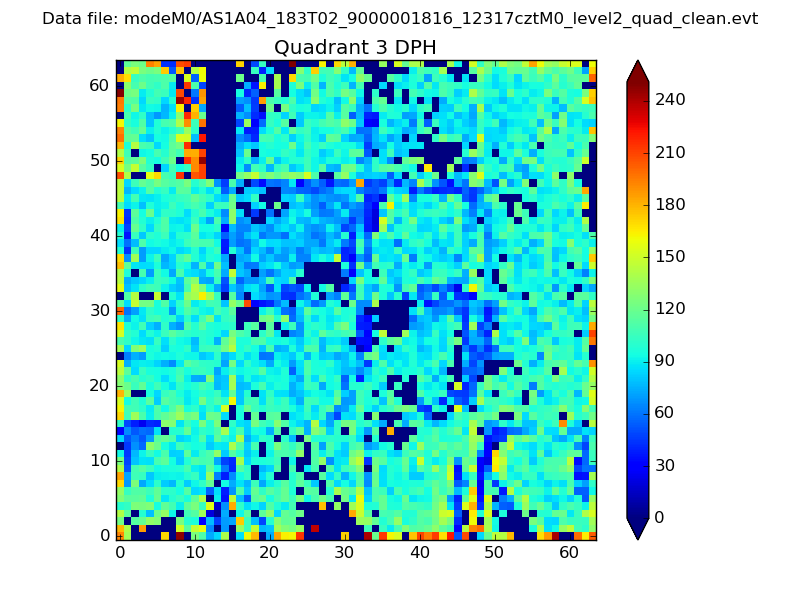 |
 |
Quadrant C |
| Plot type | Count rate plots | Images |
|---|---|---|
| Comparison with Poisson distribution Blue bars denote a histogram of data divided into 1 sec bins. Red curve is a Poisson curve with rate = median count rate of data. |
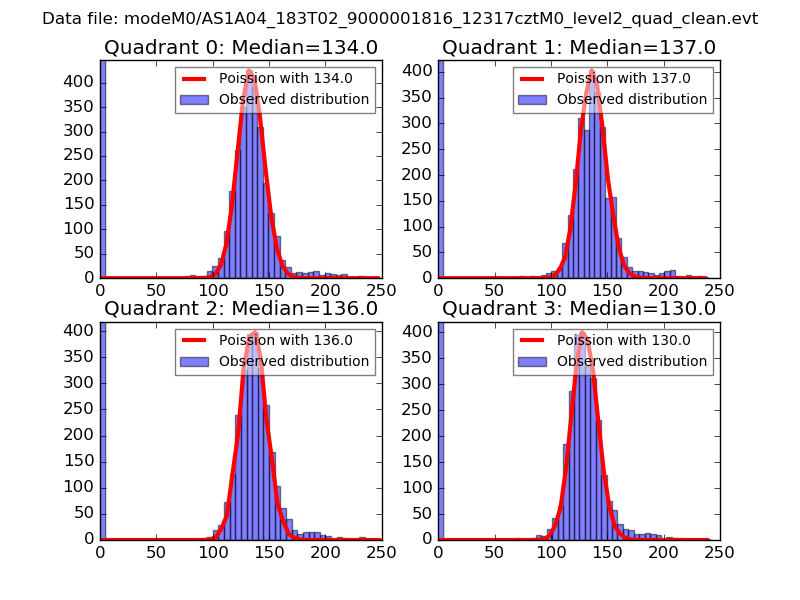 |
 |
| Quadrant-wise count rates Data is divided into 100 sec bins |
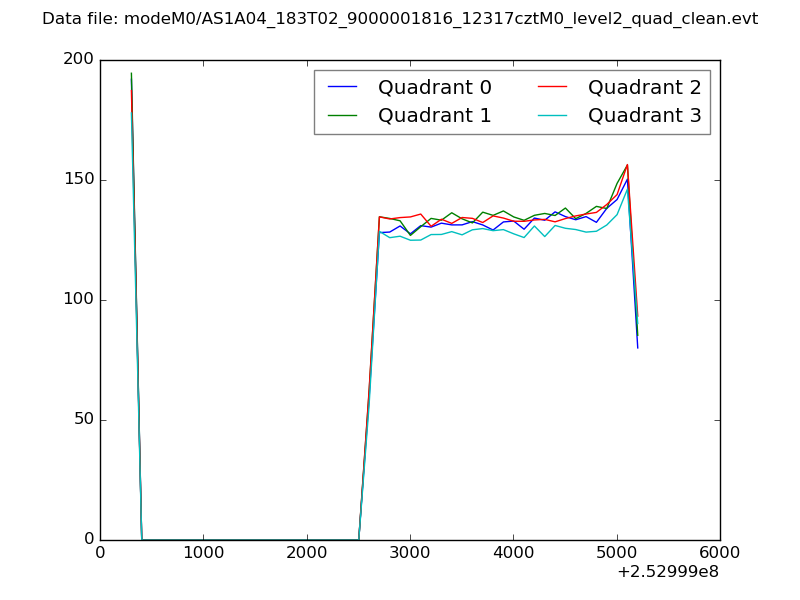 |
|
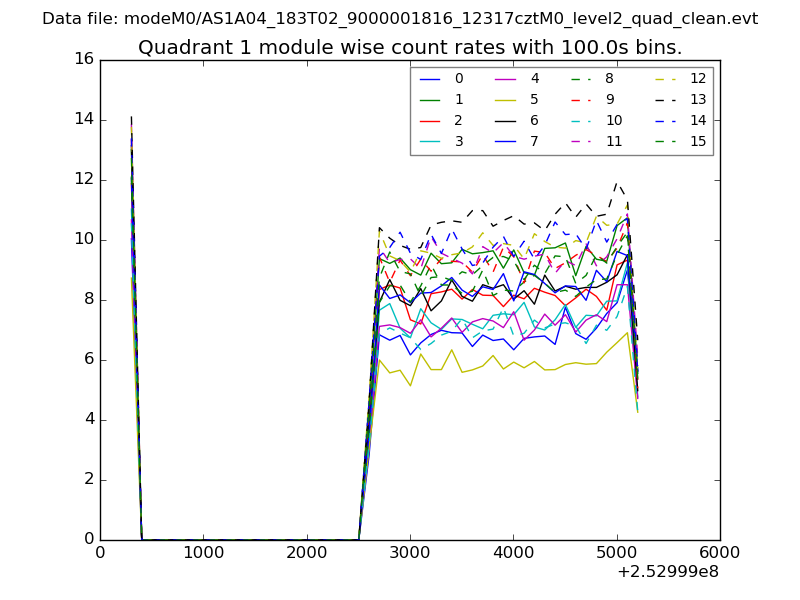
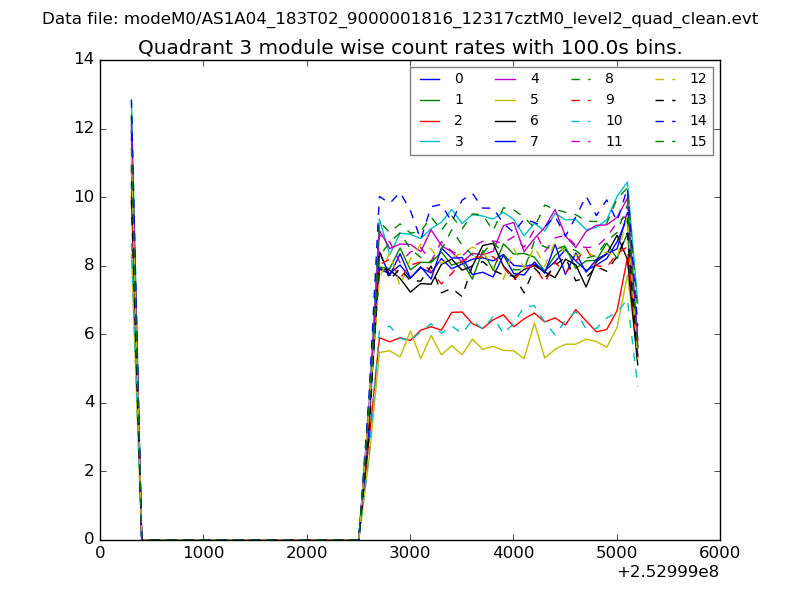
| Module-wise count rates for Quadrant A Data is divided into 100 sec bins |
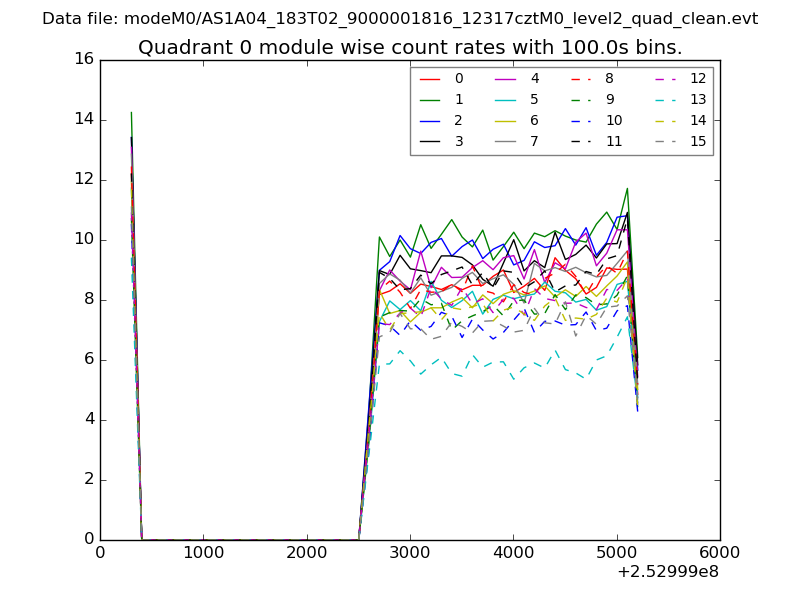 |
 |
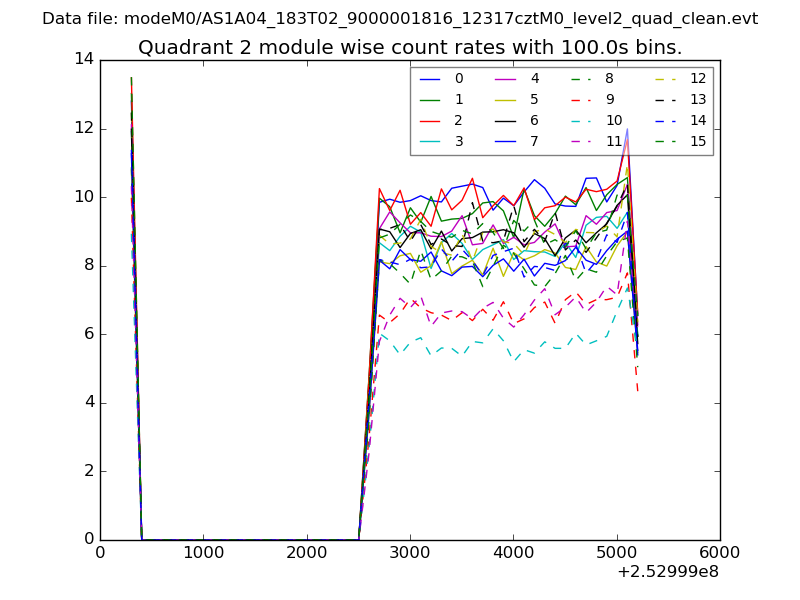
| Module-wise count rates for Quadrant B Data is divided into 100 sec bins |
 |
 |
| Module-wise count rates for Quadrant C Data is divided into 100 sec bins |
 |
 |
| Module-wise count rates for Quadrant D Data is divided into 100 sec bins |
 |
 |
| Parameter | Plot |
|---|---|
| CZT HV Monitor | 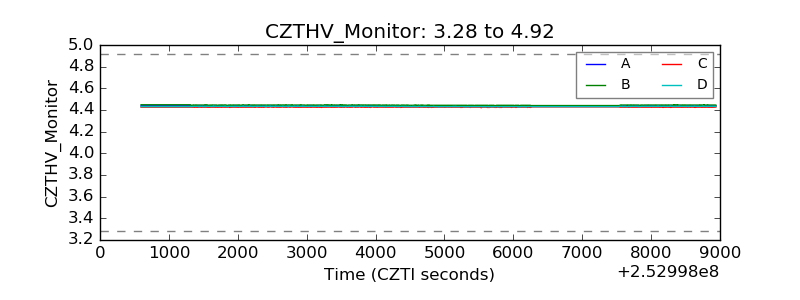 |
| D_VDD | 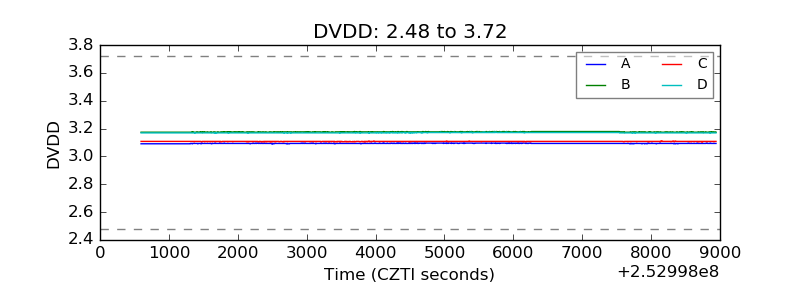 |
| Temperature 1 | 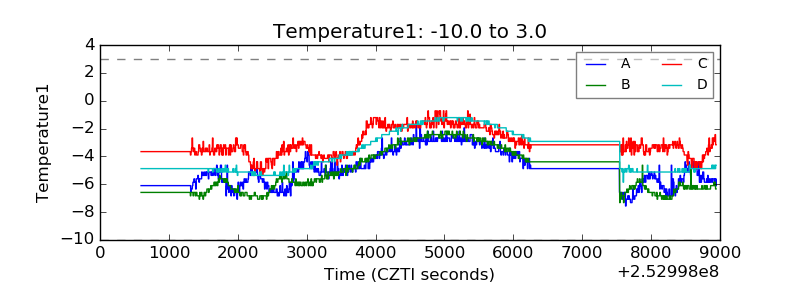 |
| Veto HV Monitor | 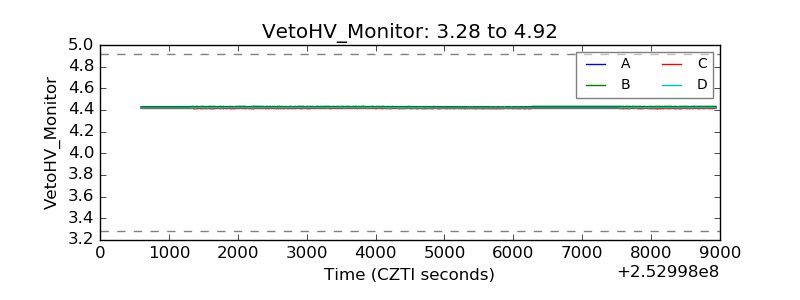 |
| Veto LLD | 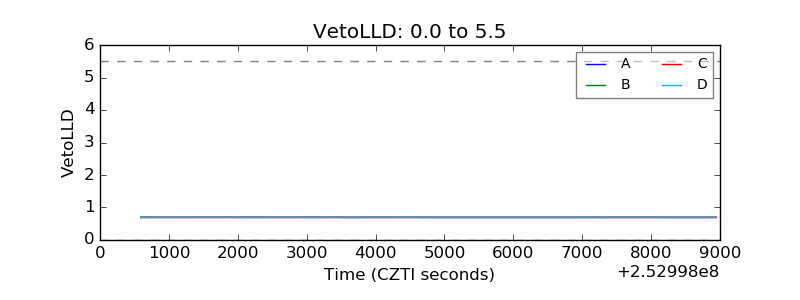 |
| Alpha Counter | 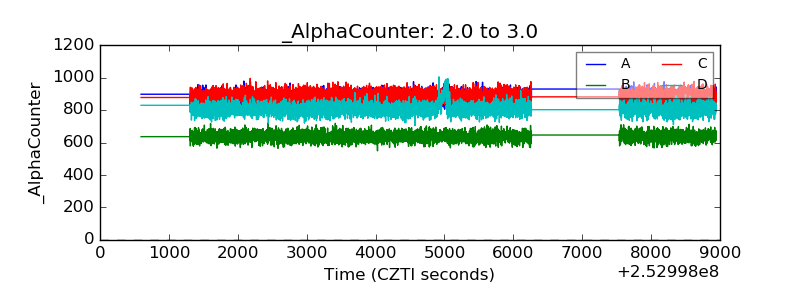 |
| _CPM_Rate | 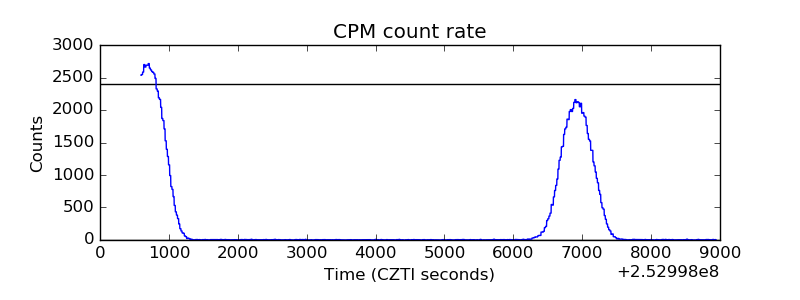 |
| CZT Counter | 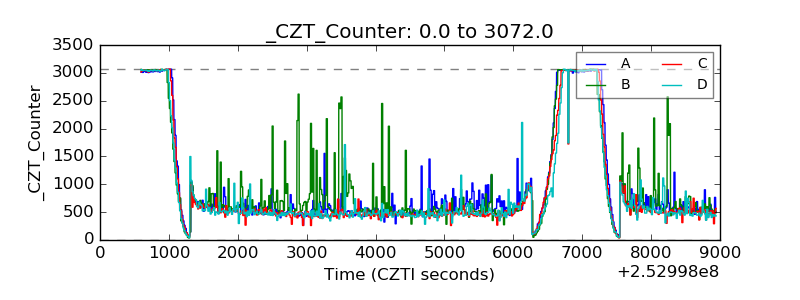 |
| +2.5 Volts monitor |  |
| +5 Volts monitor |  |
| _ROLL_ROT | 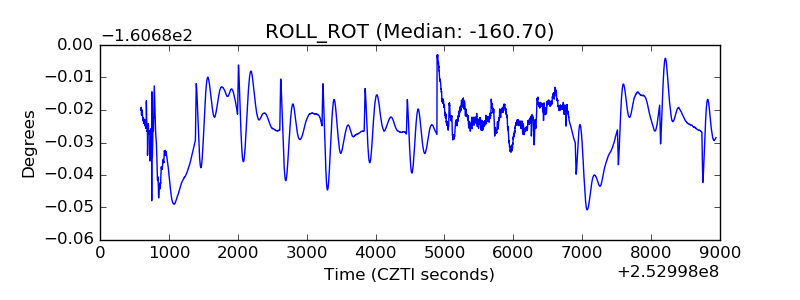 |
| _Roll_DEC | 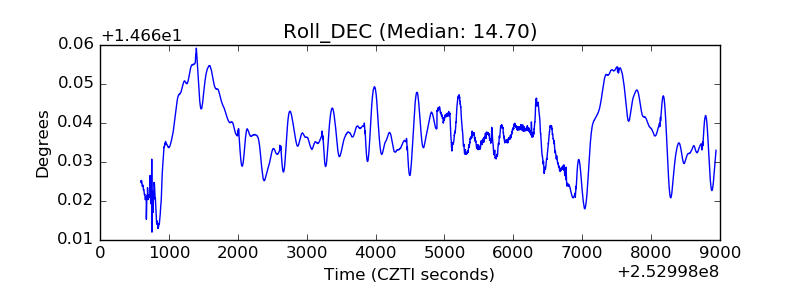 |
| _Roll_RA | 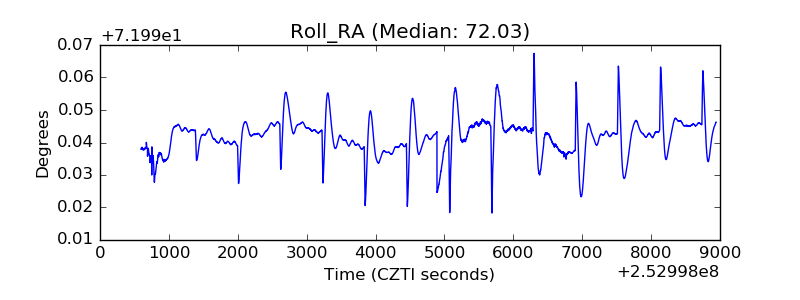 |
| Veto Counter | 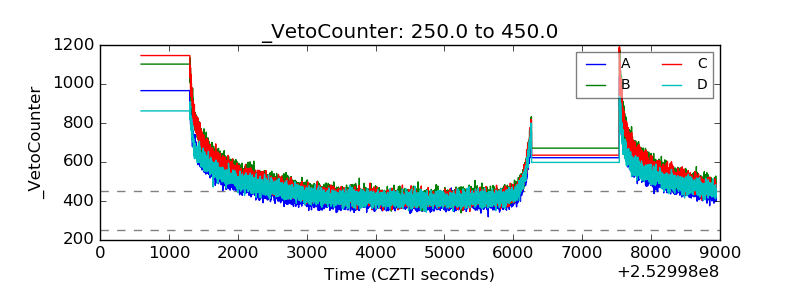 |