| Param | Original file | Final file |
|---|---|---|
| Filename | modeM0/AS1A04_183T02_9000001816_12318cztM0_level2.evt | modeM0/AS1A04_183T02_9000001816_12318cztM0_level2_quad_clean.evt |
| Size (bytes) | 278,127,360 | 39,484,800 |
| Size | 265.2 MB | 37.7 MB |
| Events in quadrant A | 2,182,058 | 231,719 |
| Events in quadrant B | 2,242,657 | 239,538 |
| Events in quadrant C | 1,822,750 | 235,332 |
| Events in quadrant D | 1,920,838 | 224,749 |
| Mode SS | |||
|---|---|---|---|
| Quadrant | BADHDUFLAG | Total packets | Discarded packets |
| A | 0 | 74 | 0 |
| B | 0 | 74 | 0 |
| C | 0 | 74 | 0 |
| D | 0 | 74 | 0 |
| Mode M9 | |||
|---|---|---|---|
| Quadrant | BADHDUFLAG | Total packets | Discarded packets |
| A | 0 | 4 | 0 |
| B | 0 | 4 | 0 |
| C | 0 | 4 | 0 |
| D | 0 | 5 | 0 |
| Mode M0 | |||
|---|---|---|---|
| Quadrant | BADHDUFLAG | Total packets | Discarded packets |
| A | 0 | 8836 | 1 |
| B | 0 | 8906 | 1 |
| C | 0 | 7759 | 1 |
| D | 0 | 8093 | 1 |
| Quadrant | Total seconds | Saturated seconds | Saturation percentage |
|---|---|---|---|
| A | 3732 | 52 | 1.393355% |
| B | 3732 | 129 | 3.456592% |
| C | 3732 | 20 | 0.535906% |
| D | 3732 | 31 | 0.830654% |
Noise dominated data is calculated using 1-second bins in cleaned event files. If a bin has >2000 counts, and if more than 50% of those come from <1% of pixels, then it is considered to be noise-dominated and hence unusable.
| Quadrant | # 1 sec bins | Bins with >0 counts | Bins with >2000 counts | High rate bins dominated by noise | Noise dominated (total time) | Noise dominated (detector-on time) | Marked lightcurve |
|---|---|---|---|---|---|---|---|
| A | 3733 | 3733 | 4 | 4 | 0.11% | 0.11% | 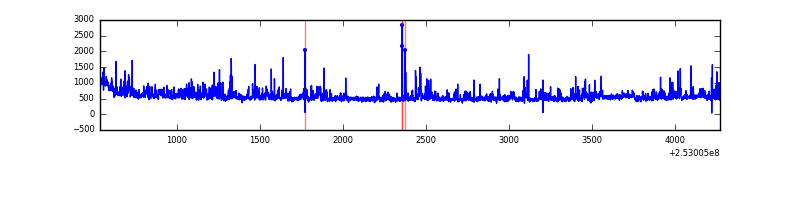 |
| B | 3733 | 3733 | 54 | 54 | 1.45% | 1.45% | 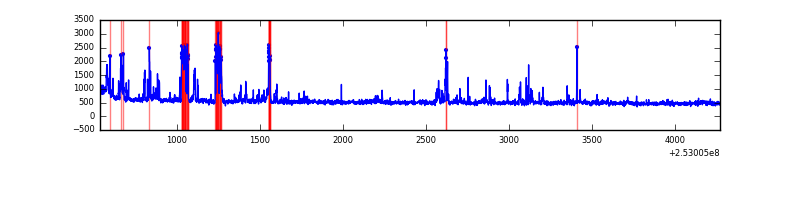 |
| C | 3733 | 3733 | 0 | 0 | 0.00% | 0.00% | 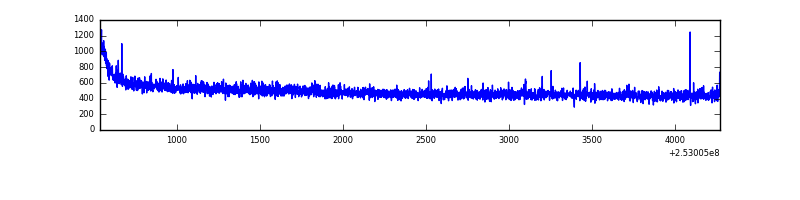 |
| D | 3733 | 3733 | 7 | 7 | 0.19% | 0.19% |  |
Top three noisy pixels from each quadrant. If the there are fewer than three noisy pixels in the level2.evt file, extra rows are filled as -1
| Pixel properties | Quadrant properties | ||||||
|---|---|---|---|---|---|---|---|
| Quadrant | DetID | PixID | Counts | Sigma | Mean | Median | Sigma |
| A | 1 | 162 | 103912 | 1052.65 | 480 | 471 | 98.3 |
| A | 1 | 178 | 58616 | 591.7 | 480 | 471 | 98.3 |
| A | 1 | 161 | 50896 | 513.14 | 480 | 471 | 98.3 |
| B | 4 | 239 | 320886 | 3559.05 | 480 | 470 | 90.0 |
| B | 0 | 187 | 17184 | 185.65 | 480 | 470 | 90.0 |
| B | 12 | 111 | 9873 | 104.44 | 480 | 470 | 90.0 |
| C | 4 | 254 | 7267 | 63.03 | 464 | 469 | 107.9 |
| C | 1 | 16 | 6831 | 58.99 | 464 | 469 | 107.9 |
| C | 13 | 61 | 3370 | 26.9 | 464 | 469 | 107.9 |
| D | 1 | 52 | 84924 | 761.57 | 459 | 448 | 110.9 |
| D | 13 | 104 | 55227 | 493.84 | 459 | 448 | 110.9 |
| D | 8 | 195 | 14848 | 129.82 | 459 | 448 | 110.9 |
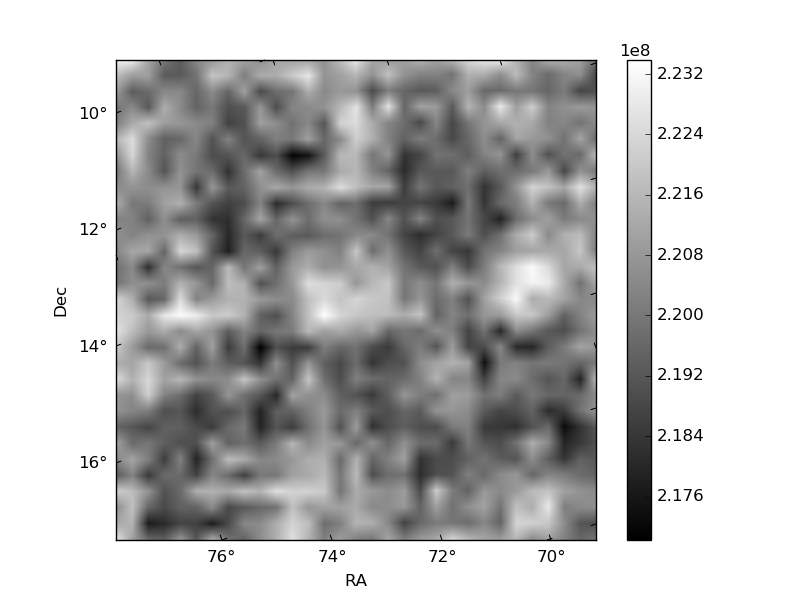
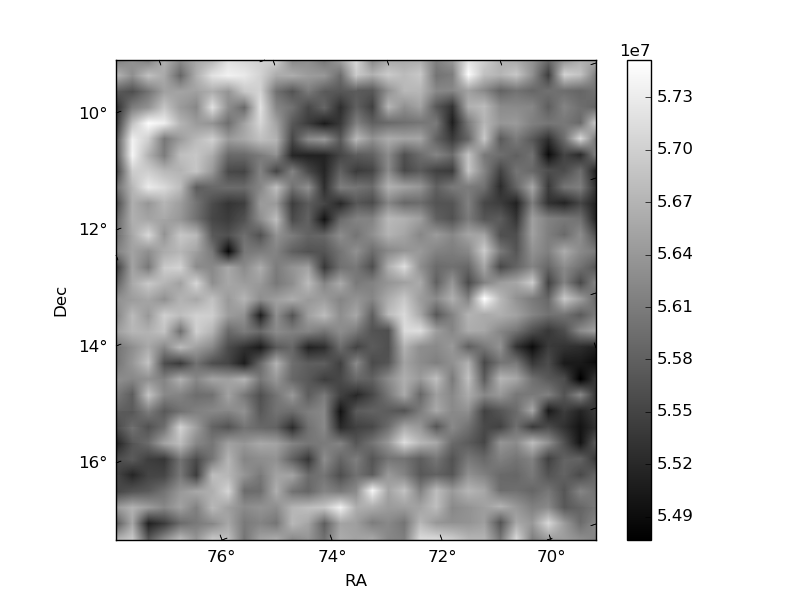
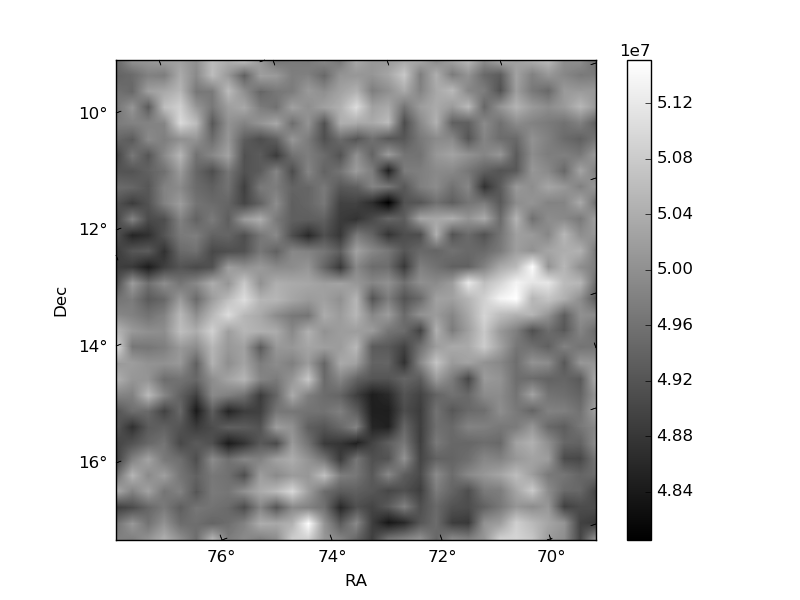
Histogram calculated using DETX and DETY for each event in the final _common_clean file
| Quadrant A |  |
 |
Quadrant B |
|---|---|---|---|
| Quadrant D | 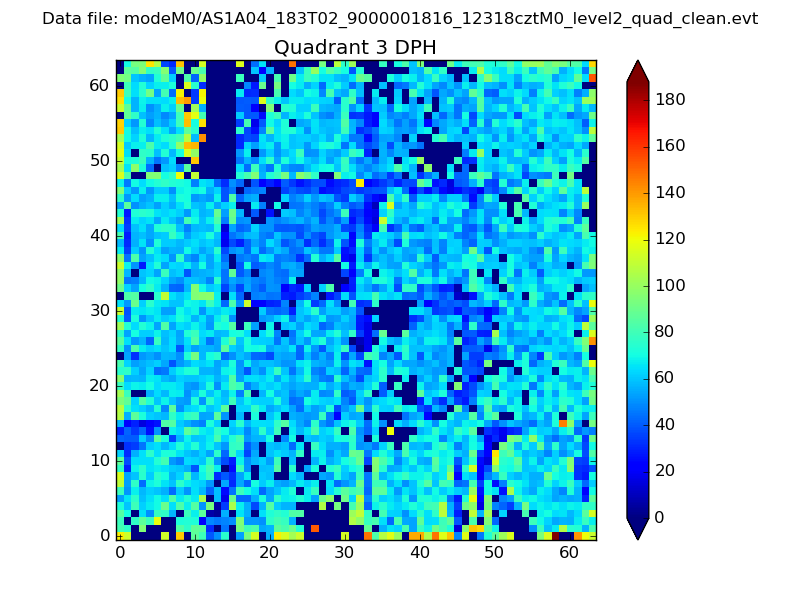 |
 |
Quadrant C |
| Plot type | Count rate plots | Images |
|---|---|---|
| Comparison with Poisson distribution Blue bars denote a histogram of data divided into 1 sec bins. Red curve is a Poisson curve with rate = median count rate of data. |
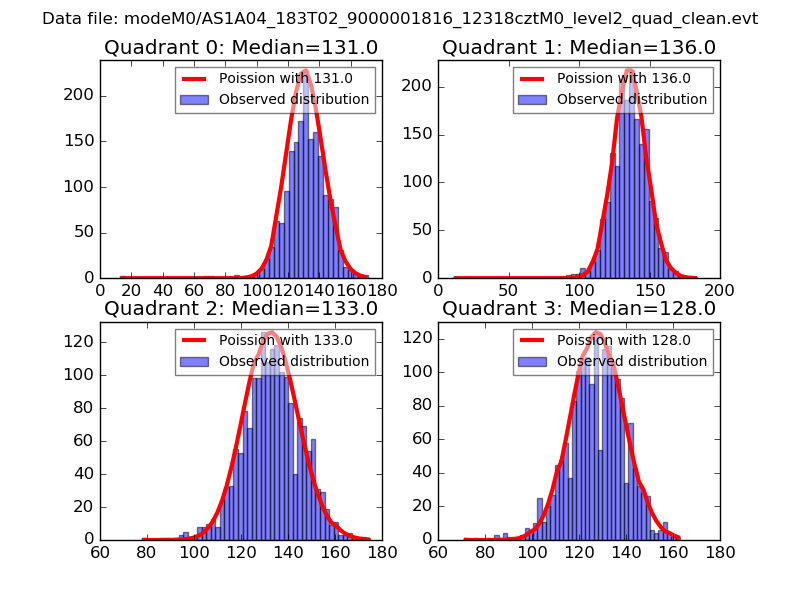 |
 |
| Quadrant-wise count rates Data is divided into 100 sec bins |
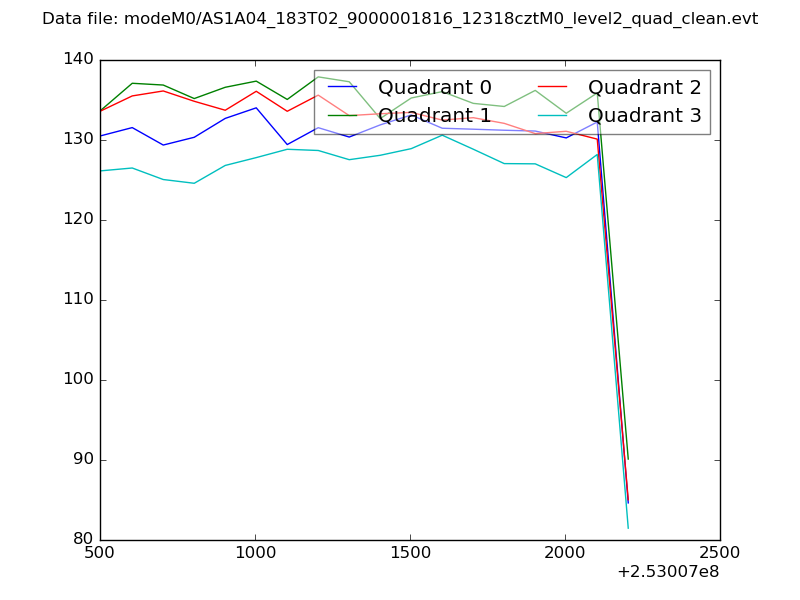 |
|
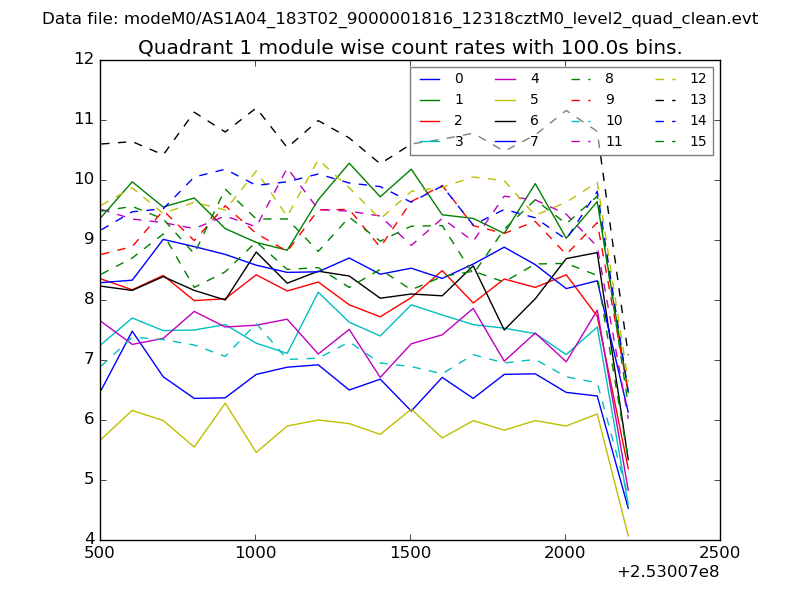
| Module-wise count rates for Quadrant A Data is divided into 100 sec bins |
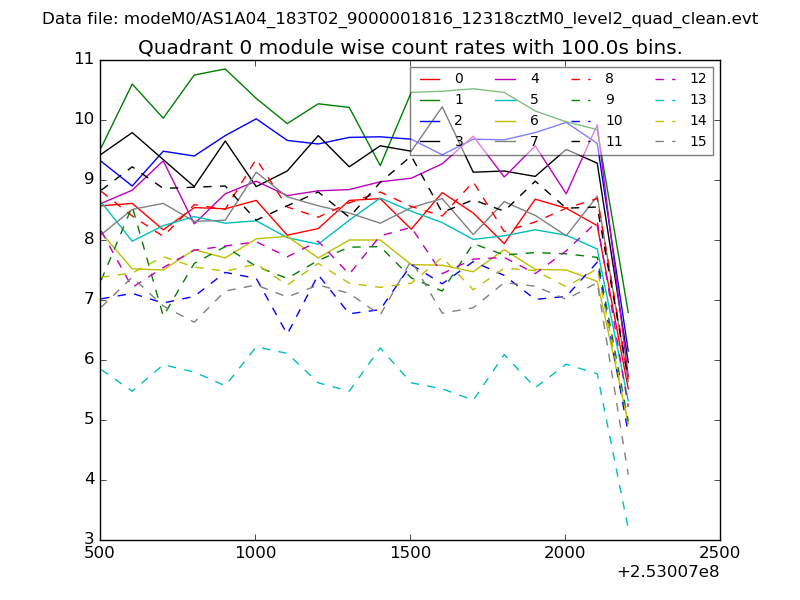 |
 |
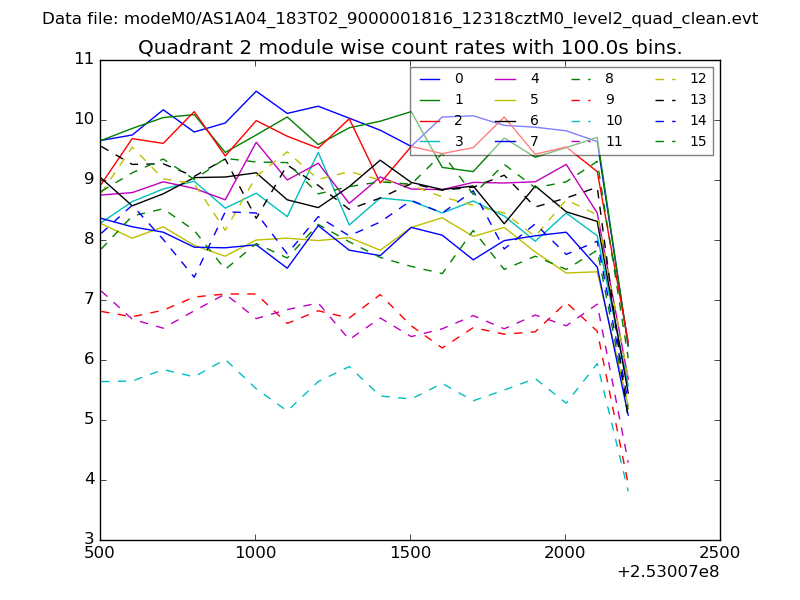
| Module-wise count rates for Quadrant B Data is divided into 100 sec bins |
 |
 |
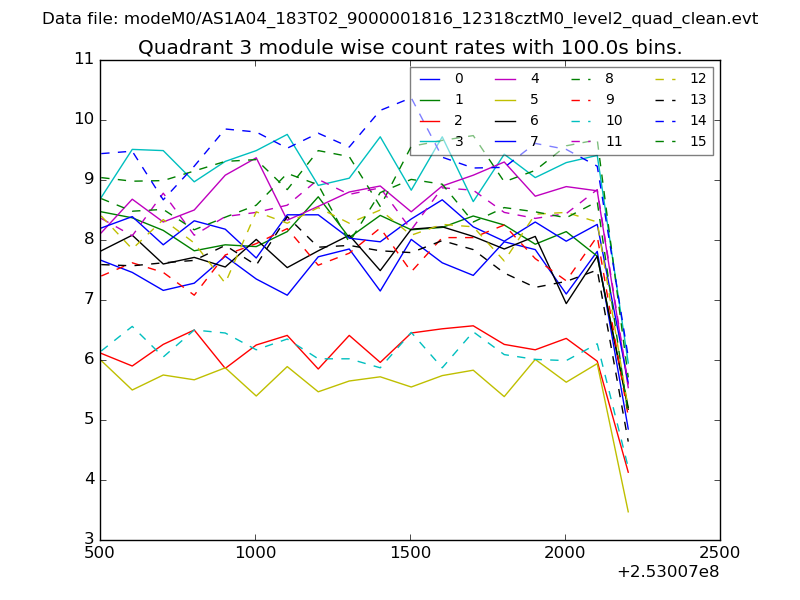
| Module-wise count rates for Quadrant C Data is divided into 100 sec bins |
 |
 |
| Module-wise count rates for Quadrant D Data is divided into 100 sec bins |
 |
 |
| Parameter | Plot |
|---|---|
| CZT HV Monitor | 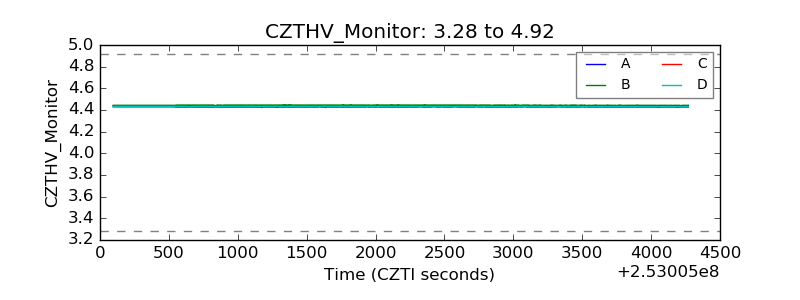 |
| D_VDD | 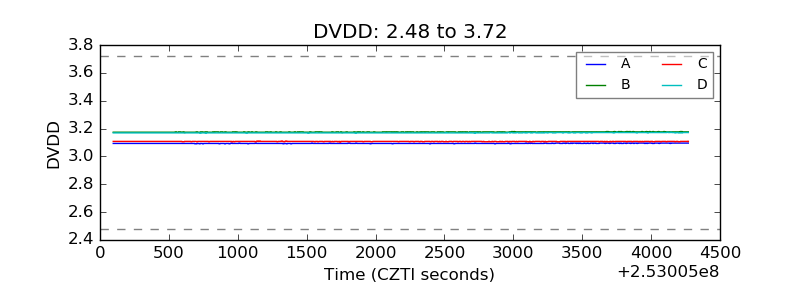 |
| Temperature 1 | 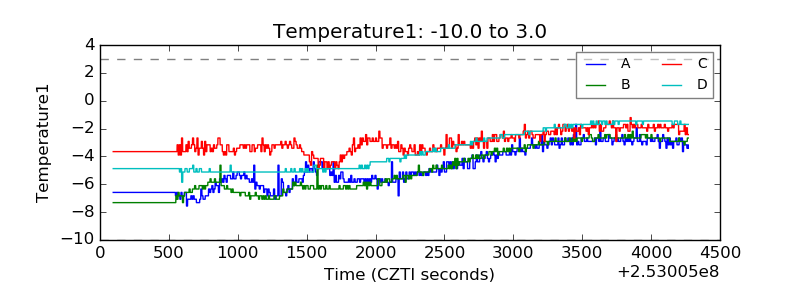 |
| Veto HV Monitor | 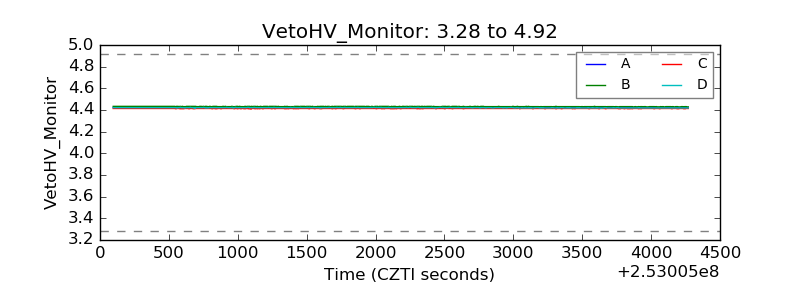 |
| Veto LLD | 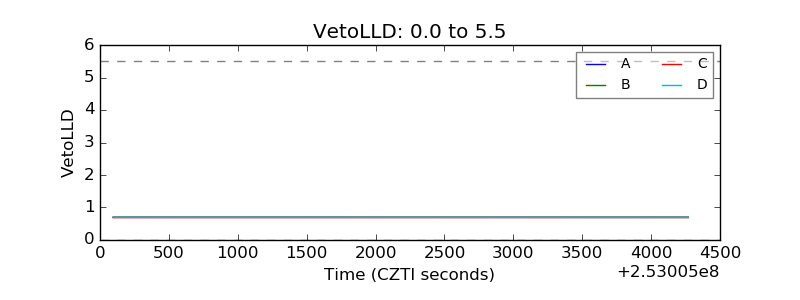 |
| Alpha Counter | 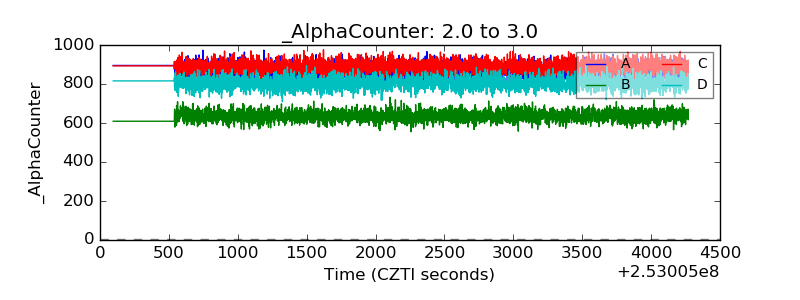 |
| _CPM_Rate | 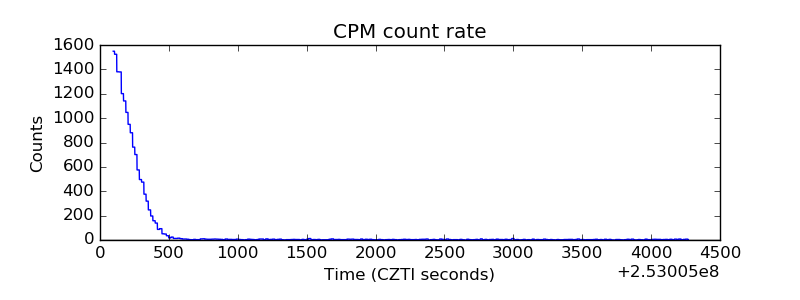 |
| CZT Counter |  |
| +2.5 Volts monitor |  |
| +5 Volts monitor | 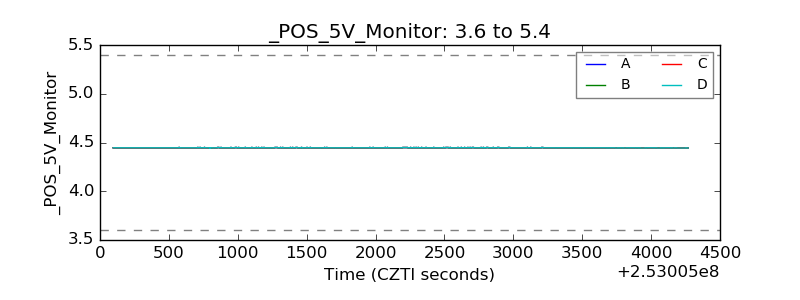 |
| _ROLL_ROT | 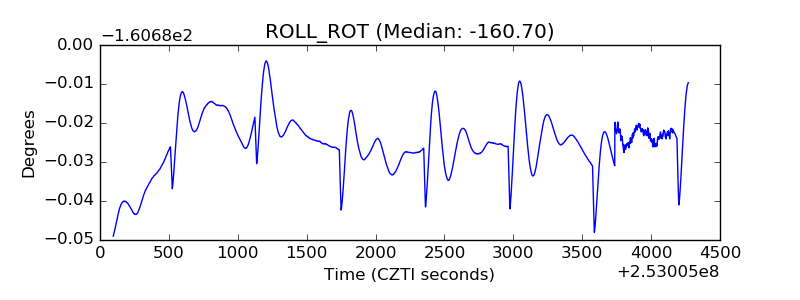 |
| _Roll_DEC | 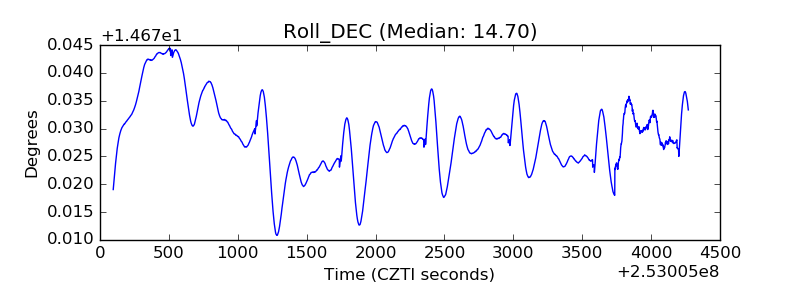 |
| _Roll_RA | 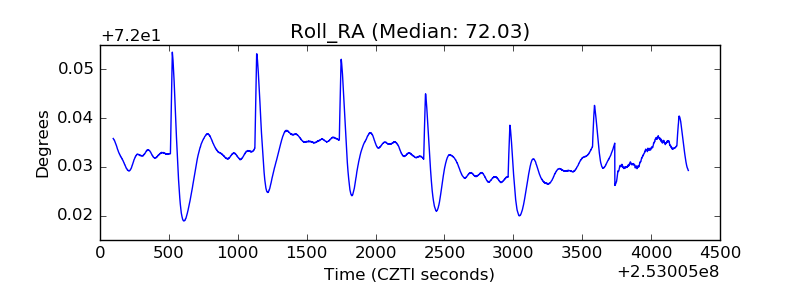 |
| Veto Counter | 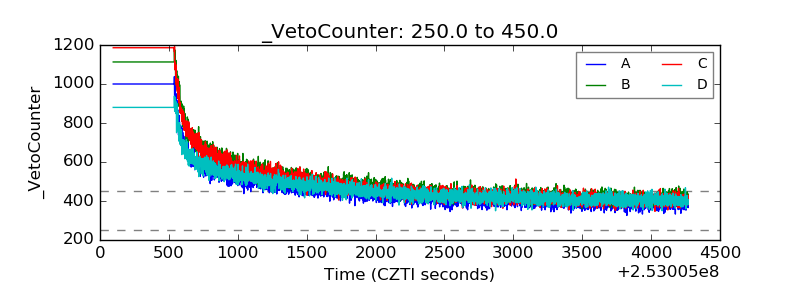 |