| Param | Original file | Final file |
|---|---|---|
| Filename | modeM0/AS1A04_048T01_9000001820_12319cztM0_level2.evt | modeM0/AS1A04_048T01_9000001820_12319cztM0_level2_quad_clean.evt |
| Size (bytes) | 94,311,360 | 21,608,640 |
| Size | 89.9 MB | 20.6 MB |
| Events in quadrant A | 751,967 | 139,456 |
| Events in quadrant B | 734,974 | 143,603 |
| Events in quadrant C | 643,459 | 140,045 |
| Events in quadrant D | 634,379 | 133,113 |
| Mode SS | |||
|---|---|---|---|
| Quadrant | BADHDUFLAG | Total packets | Discarded packets |
| A | 0 | 26 | 0 |
| B | 0 | 26 | 0 |
| C | 0 | 26 | 0 |
| D | 0 | 26 | 0 |
| Mode M0 | |||
|---|---|---|---|
| Quadrant | BADHDUFLAG | Total packets | Discarded packets |
| A | 0 | 3052 | 2 |
| B | 0 | 2951 | 1 |
| C | 0 | 2703 | 1 |
| D | 0 | 2715 | 1 |
| Mode M9 | |||
|---|---|---|---|
| Quadrant | BADHDUFLAG | Total packets | Discarded packets |
| A | 0 | 8 | 0 |
| B | 0 | 8 | 0 |
| C | 0 | 8 | 0 |
| D | 0 | 8 | 0 |
| Quadrant | Total seconds | Saturated seconds | Saturation percentage |
|---|---|---|---|
| A | 1302 | 25 | 1.920123% |
| B | 1302 | 21 | 1.612903% |
| C | 1302 | 8 | 0.614439% |
| D | 1302 | 5 | 0.384025% |
Noise dominated data is calculated using 1-second bins in cleaned event files. If a bin has >2000 counts, and if more than 50% of those come from <1% of pixels, then it is considered to be noise-dominated and hence unusable.
| Quadrant | # 1 sec bins | Bins with >0 counts | Bins with >2000 counts | High rate bins dominated by noise | Noise dominated (total time) | Noise dominated (detector-on time) | Marked lightcurve |
|---|---|---|---|---|---|---|---|
| A | 1303 | 1303 | 0 | 0 | 0.00% | 0.00% | 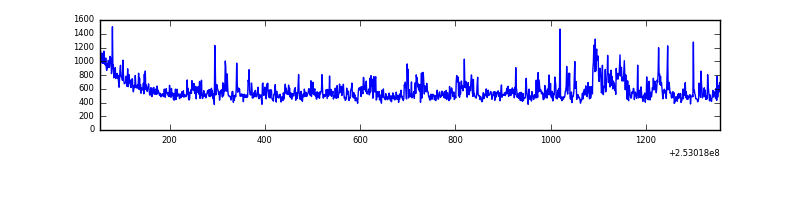 |
| B | 1303 | 1303 | 0 | 0 | 0.00% | 0.00% | 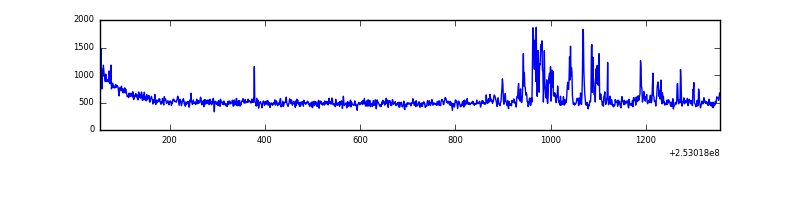 |
| C | 1303 | 1303 | 0 | 0 | 0.00% | 0.00% | 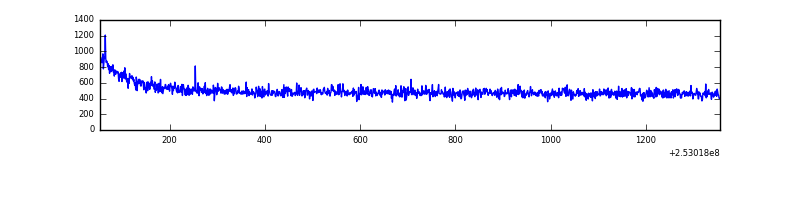 |
| D | 1303 | 1303 | 0 | 0 | 0.00% | 0.00% | 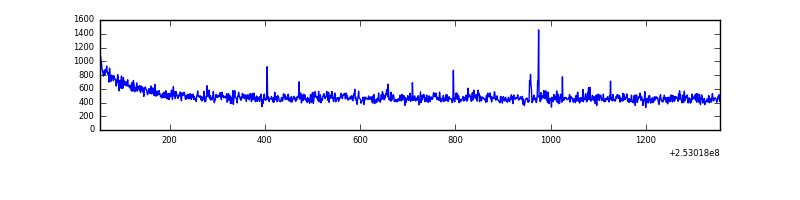 |
Top three noisy pixels from each quadrant. If the there are fewer than three noisy pixels in the level2.evt file, extra rows are filled as -1
| Pixel properties | Quadrant properties | ||||||
|---|---|---|---|---|---|---|---|
| Quadrant | DetID | PixID | Counts | Sigma | Mean | Median | Sigma |
| A | 1 | 162 | 32562 | 906.77 | 166 | 162 | 35.7 |
| A | 15 | 174 | 24092 | 669.72 | 166 | 162 | 35.7 |
| A | 1 | 178 | 18269 | 506.76 | 166 | 162 | 35.7 |
| B | 4 | 239 | 72080 | 2135.03 | 165 | 161 | 33.7 |
| B | 3 | 64 | 10031 | 293.01 | 165 | 161 | 33.7 |
| B | 0 | 214 | 4072 | 116.1 | 165 | 161 | 33.7 |
| C | 13 | 61 | 1112 | 23.92 | 164 | 165 | 39.6 |
| C | 14 | 234 | 728 | 14.22 | 164 | 165 | 39.6 |
| C | 8 | 222 | 697 | 13.44 | 164 | 165 | 39.6 |
| D | 1 | 52 | 6319 | 153.89 | 163 | 158 | 40.0 |
| D | 2 | 234 | 4327 | 104.13 | 163 | 158 | 40.0 |
| D | 14 | 34 | 3080 | 72.99 | 163 | 158 | 40.0 |
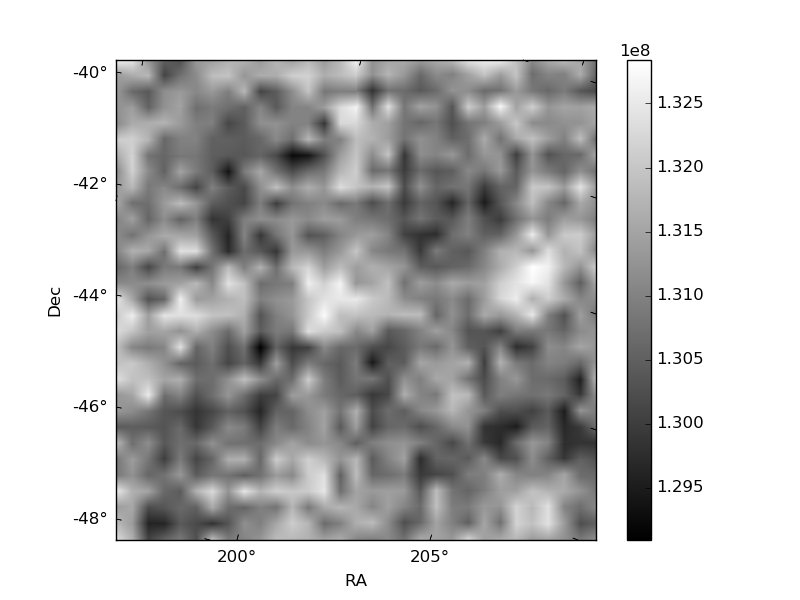
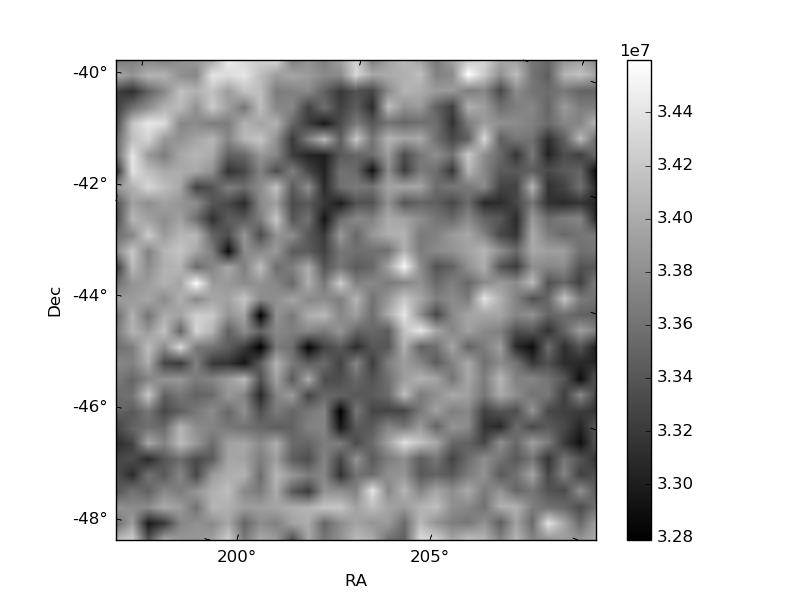
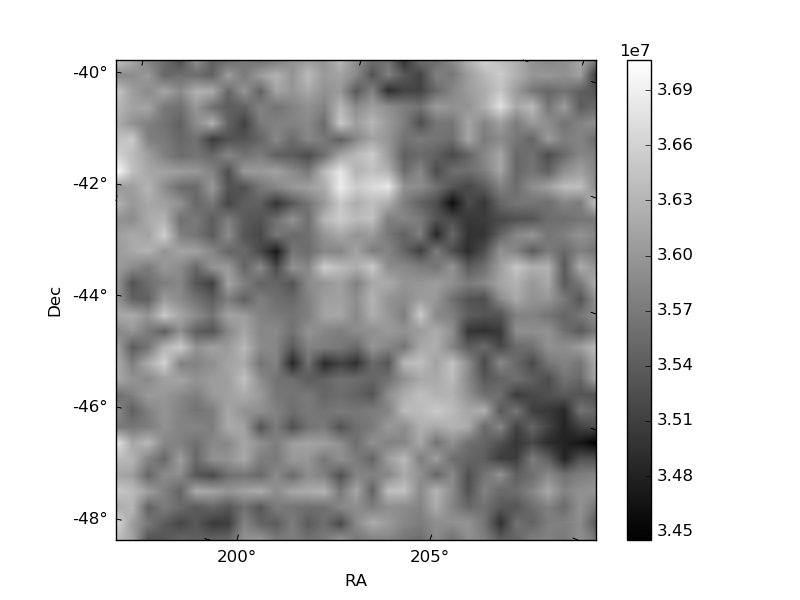
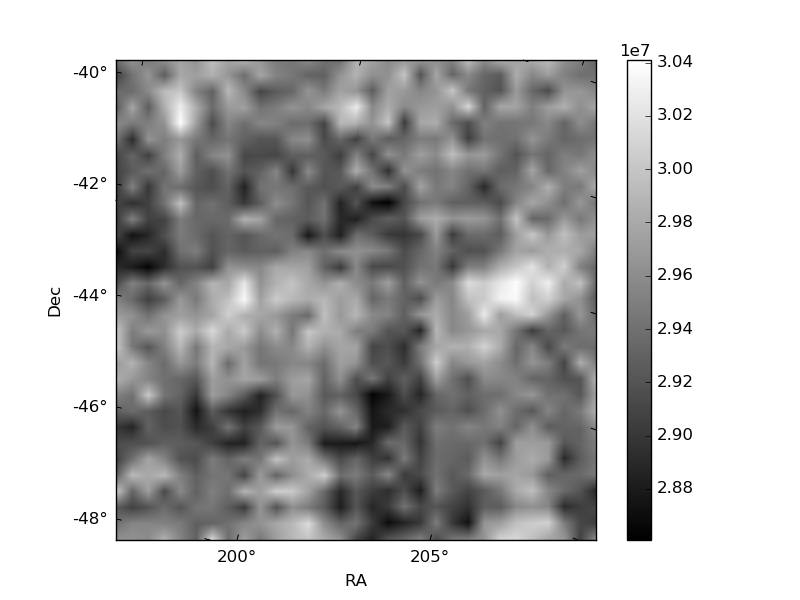
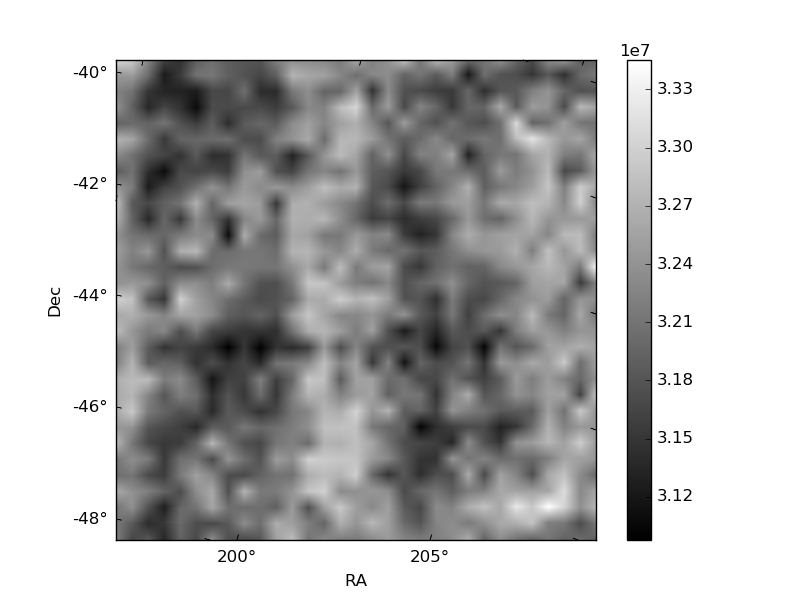
Histogram calculated using DETX and DETY for each event in the final _common_clean file
| Quadrant A | 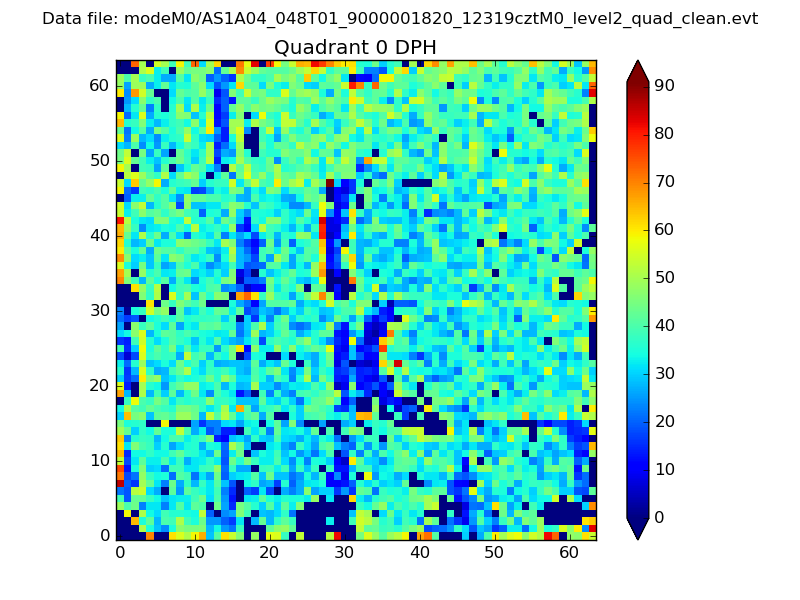 |
 |
Quadrant B |
|---|---|---|---|
| Quadrant D | 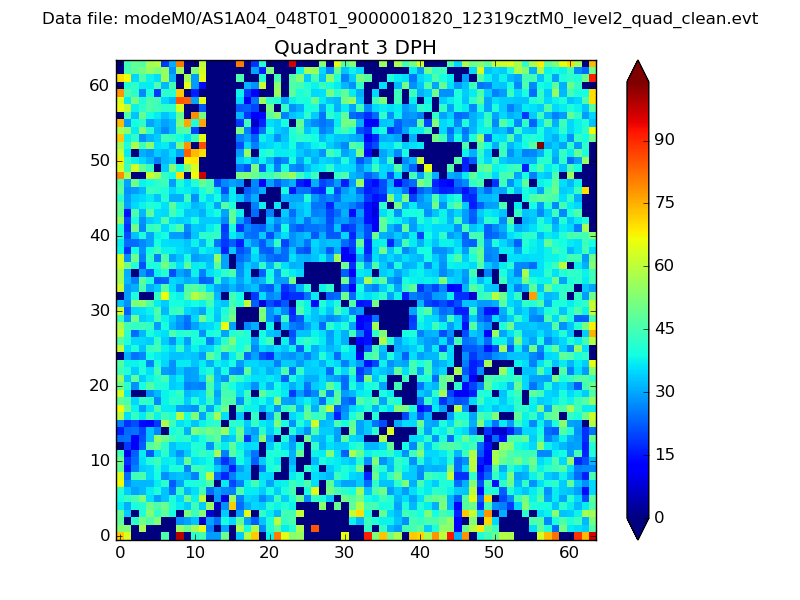 |
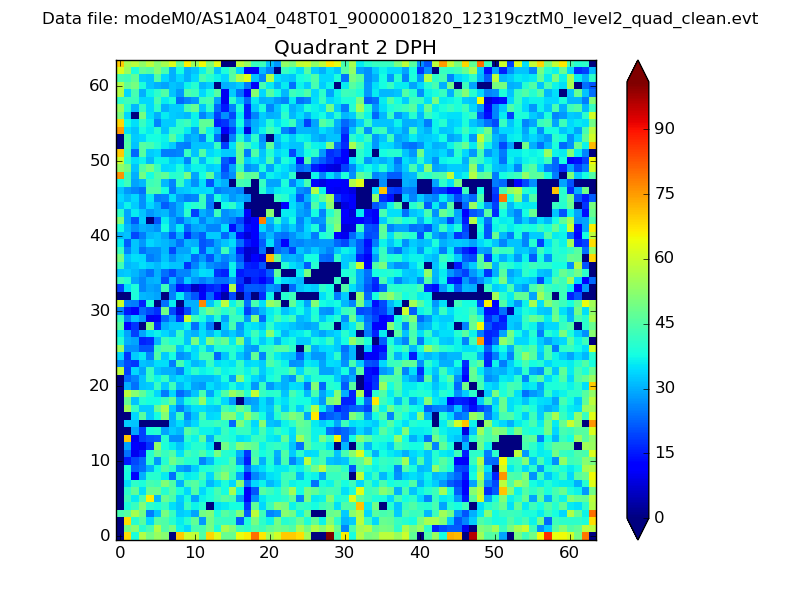 |
Quadrant C |
| Plot type | Count rate plots | Images |
|---|---|---|
| Comparison with Poisson distribution Blue bars denote a histogram of data divided into 1 sec bins. Red curve is a Poisson curve with rate = median count rate of data. |
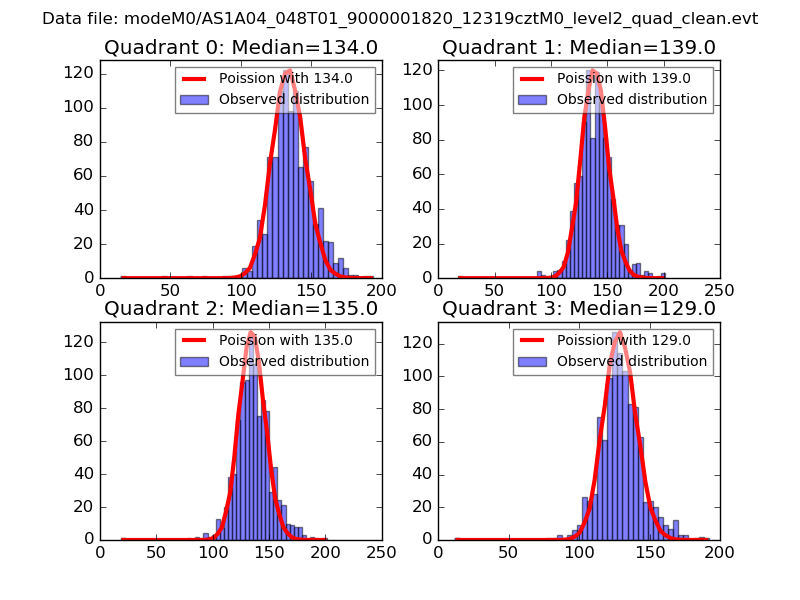 |
 |
| Quadrant-wise count rates Data is divided into 100 sec bins |
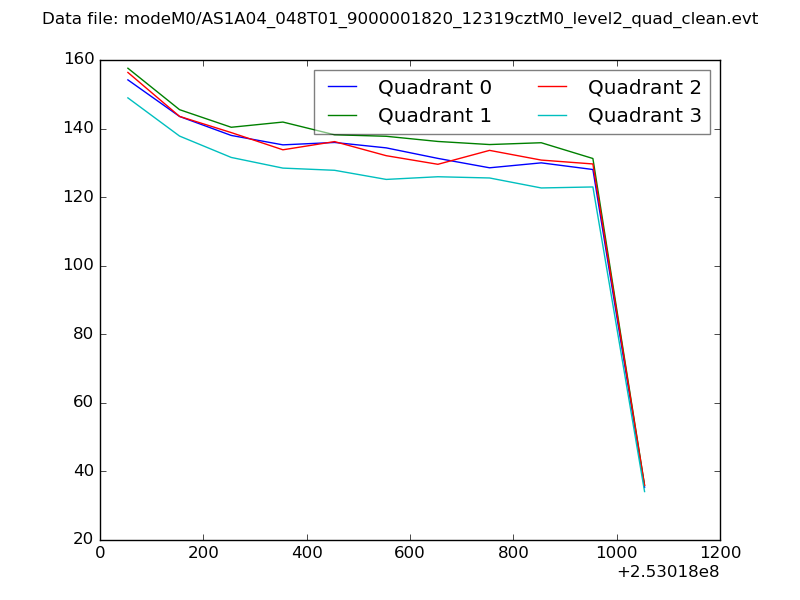 |
|
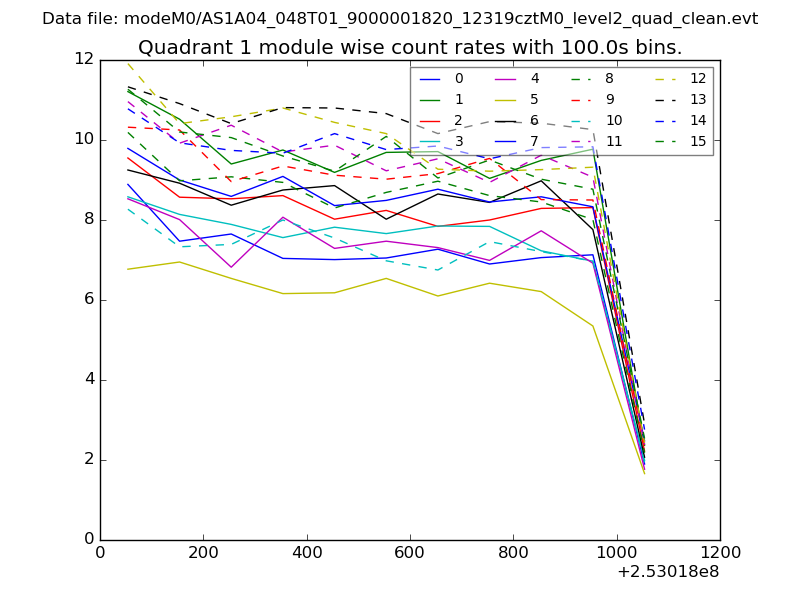
| Module-wise count rates for Quadrant A Data is divided into 100 sec bins |
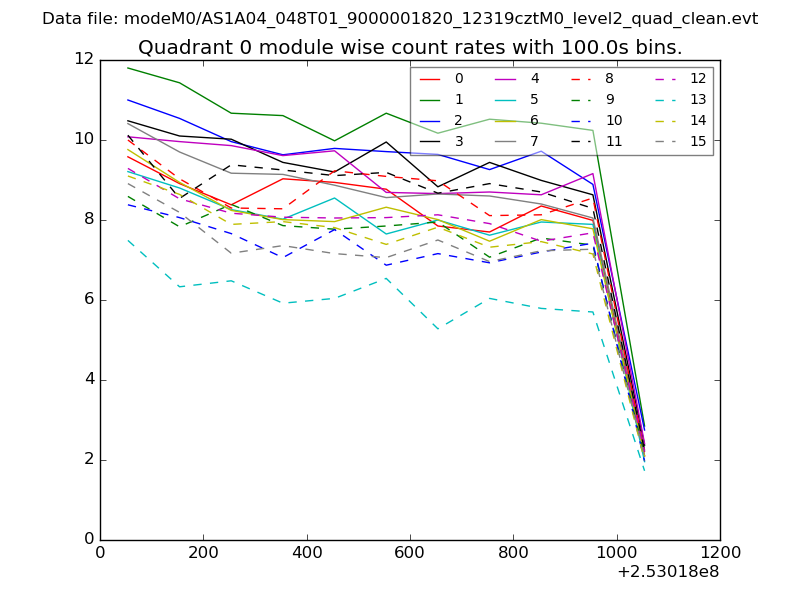 |
 |
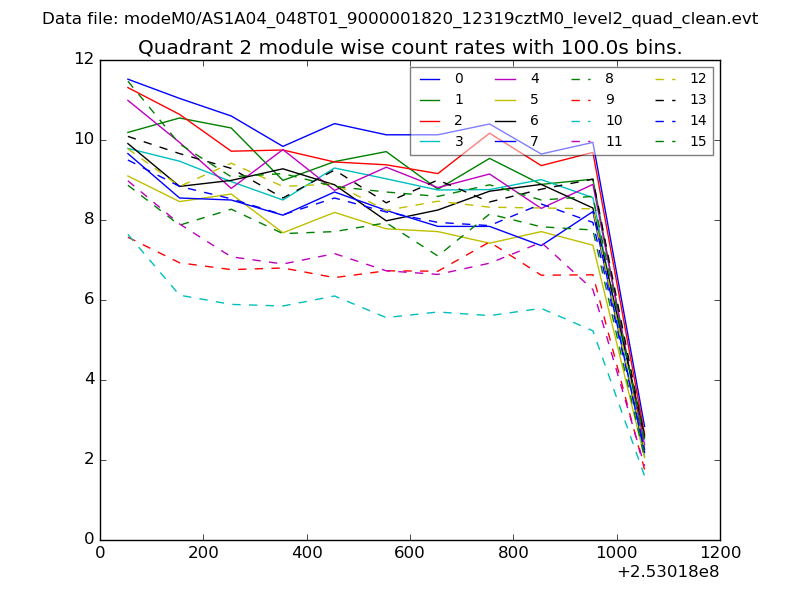
| Module-wise count rates for Quadrant B Data is divided into 100 sec bins |
 |
 |
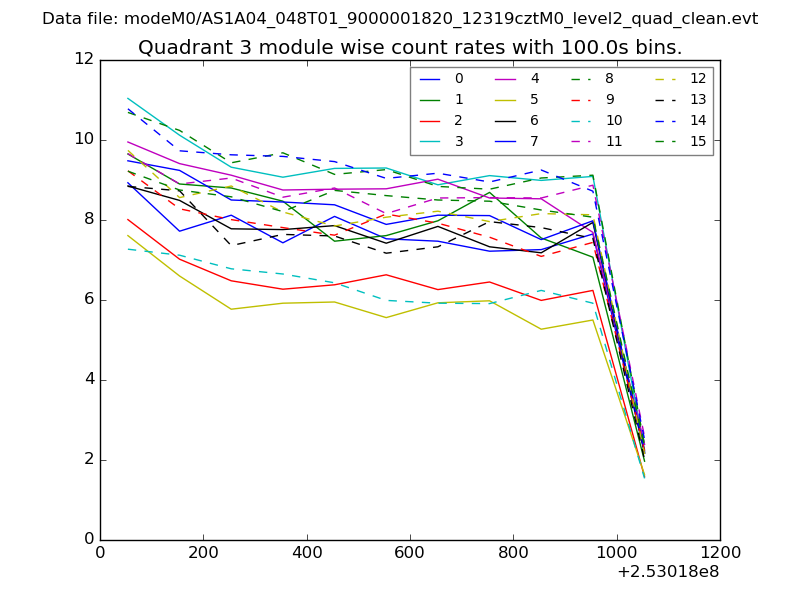
| Module-wise count rates for Quadrant C Data is divided into 100 sec bins |
 |
 |
| Module-wise count rates for Quadrant D Data is divided into 100 sec bins |
 |
 |
| Parameter | Plot |
|---|---|
| CZT HV Monitor | 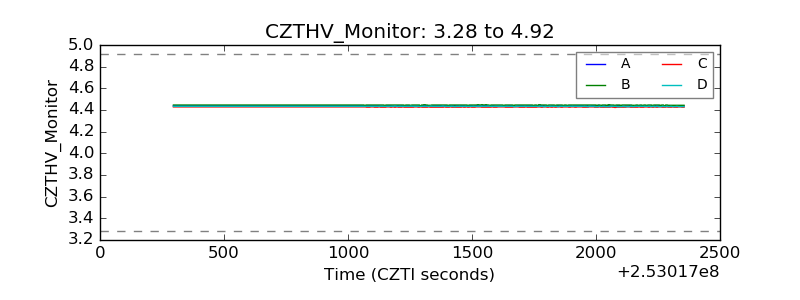 |
| D_VDD | 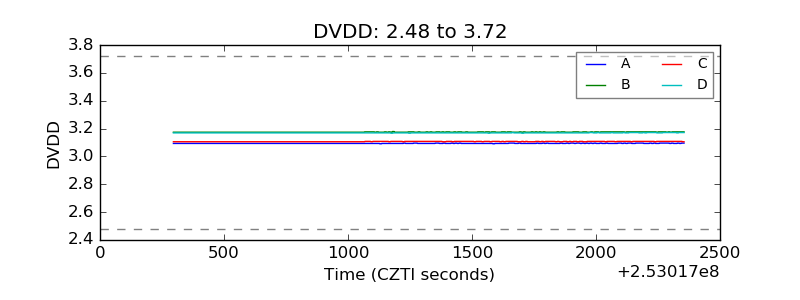 |
| Temperature 1 | 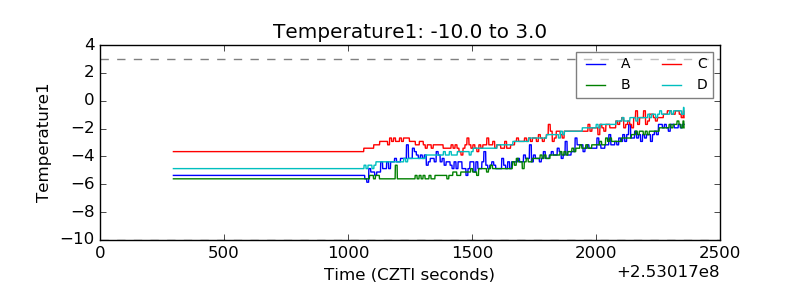 |
| Veto HV Monitor | 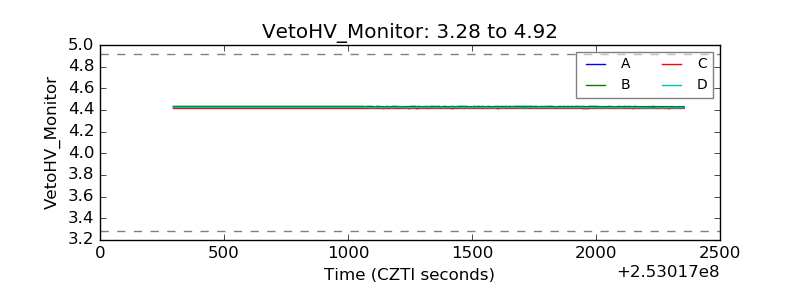 |
| Veto LLD | 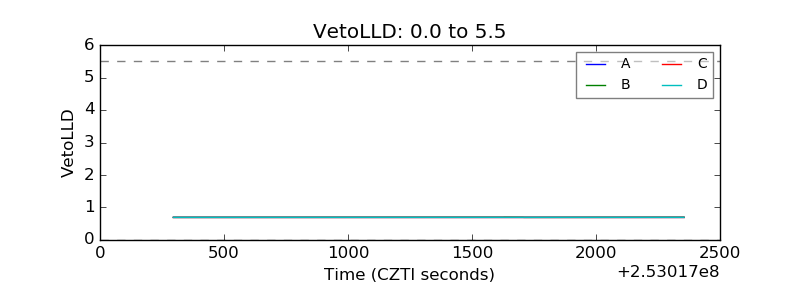 |
| Alpha Counter | 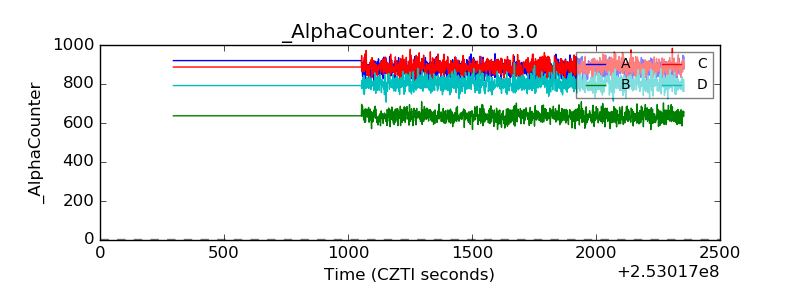 |
| _CPM_Rate | 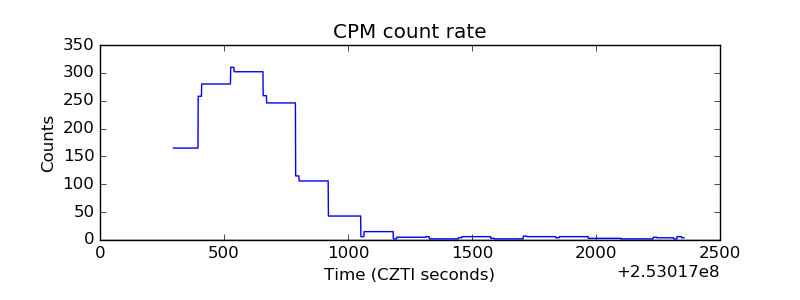 |
| CZT Counter | 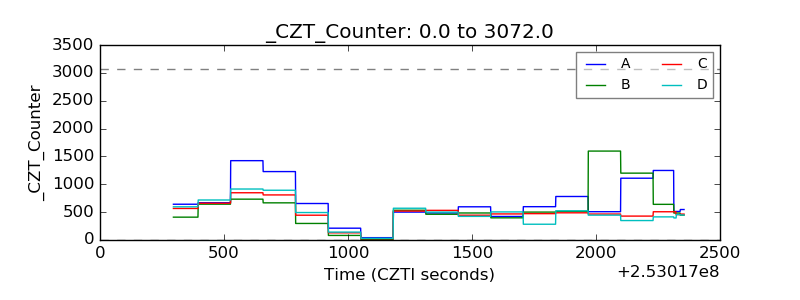 |
| +2.5 Volts monitor |  |
| +5 Volts monitor |  |
| _ROLL_ROT |  |
| _Roll_DEC | 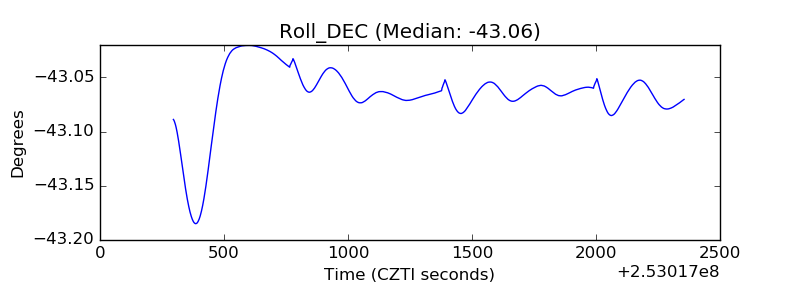 |
| _Roll_RA | 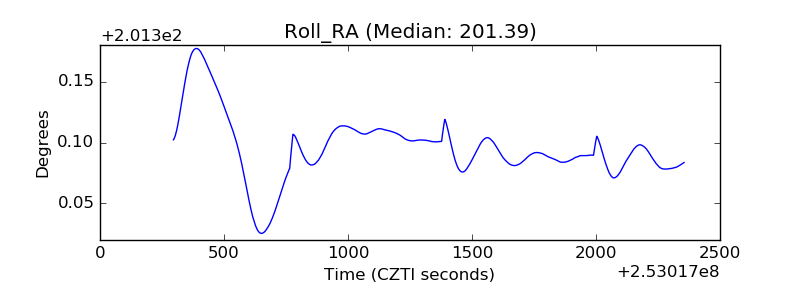 |
| Veto Counter | 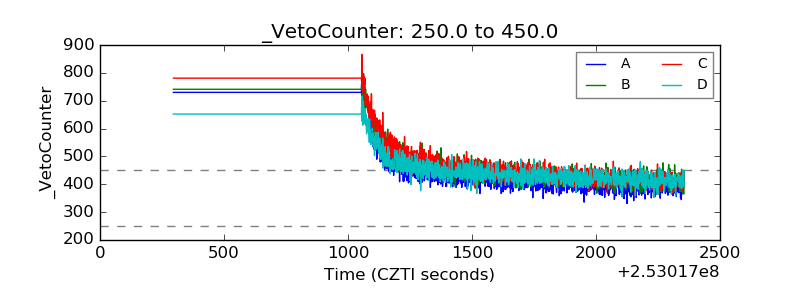 |