| Param | Original file | Final file |
|---|---|---|
| Filename | modeM0/AS1A04_048T01_9000001820_12320cztM0_level2.evt | modeM0/AS1A04_048T01_9000001820_12320cztM0_level2_quad_clean.evt |
| Size (bytes) | 544,953,600 | 75,847,680 |
| Size | 519.7 MB | 72.3 MB |
| Events in quadrant A | 4,578,698 | 456,183 |
| Events in quadrant B | 4,250,264 | 463,587 |
| Events in quadrant C | 3,153,150 | 462,439 |
| Events in quadrant D | 4,061,953 | 441,609 |
| Mode SS | |||
|---|---|---|---|
| Quadrant | BADHDUFLAG | Total packets | Discarded packets |
| A | 0 | 138 | 0 |
| B | 0 | 138 | 0 |
| C | 0 | 138 | 0 |
| D | 0 | 138 | 0 |
| Mode M0 | |||
|---|---|---|---|
| Quadrant | BADHDUFLAG | Total packets | Discarded packets |
| A | 0 | 18100 | 2 |
| B | 0 | 16871 | 1 |
| C | 0 | 13990 | 1 |
| D | 0 | 16630 | 1 |
| Mode M9 | |||
|---|---|---|---|
| Quadrant | BADHDUFLAG | Total packets | Discarded packets |
| A | 0 | 8 | 0 |
| B | 0 | 8 | 0 |
| C | 0 | 8 | 0 |
| D | 0 | 8 | 0 |
| Quadrant | Total seconds | Saturated seconds | Saturation percentage |
|---|---|---|---|
| A | 6780 | 261 | 3.849558% |
| B | 6780 | 439 | 6.474926% |
| C | 6780 | 85 | 1.253687% |
| D | 6780 | 228 | 3.362832% |
Noise dominated data is calculated using 1-second bins in cleaned event files. If a bin has >2000 counts, and if more than 50% of those come from <1% of pixels, then it is considered to be noise-dominated and hence unusable.
| Quadrant | # 1 sec bins | Bins with >0 counts | Bins with >2000 counts | High rate bins dominated by noise | Noise dominated (total time) | Noise dominated (detector-on time) | Marked lightcurve |
|---|---|---|---|---|---|---|---|
| A | 7586 | 6781 | 50 | 50 | 0.66% | 0.74% | 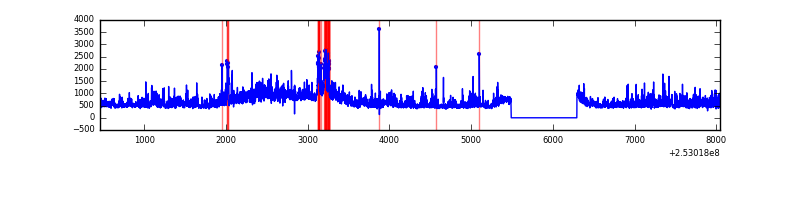 |
| B | 7586 | 6781 | 196 | 196 | 2.58% | 2.89% | 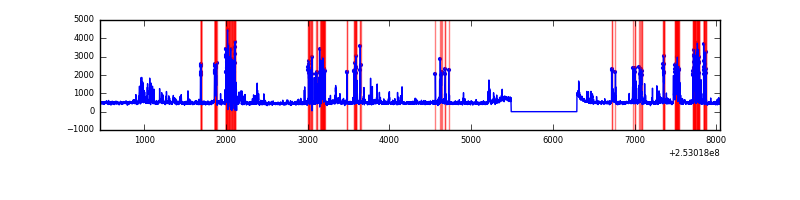 |
| C | 7586 | 6781 | 12 | 12 | 0.16% | 0.18% | 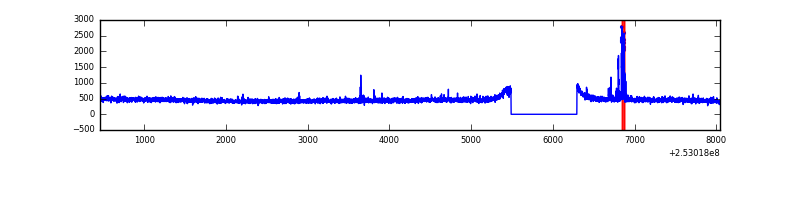 |
| D | 7586 | 6781 | 136 | 136 | 1.79% | 2.01% | 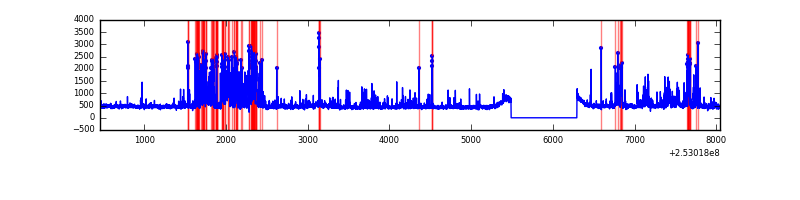 |
Top three noisy pixels from each quadrant. If the there are fewer than three noisy pixels in the level2.evt file, extra rows are filled as -1
| Pixel properties | Quadrant properties | ||||||
|---|---|---|---|---|---|---|---|
| Quadrant | DetID | PixID | Counts | Sigma | Mean | Median | Sigma |
| A | 0 | 23 | 291848 | 1754.83 | 804 | 787 | 165.9 |
| A | 1 | 162 | 280049 | 1683.7 | 804 | 787 | 165.9 |
| A | 15 | 174 | 231538 | 1391.22 | 804 | 787 | 165.9 |
| B | 4 | 239 | 752044 | 5058.86 | 791 | 772 | 148.5 |
| B | 0 | 85 | 117719 | 787.49 | 791 | 772 | 148.5 |
| B | 3 | 64 | 99333 | 663.68 | 791 | 772 | 148.5 |
| C | 4 | 254 | 68918 | 375.23 | 789 | 792 | 181.6 |
| C | 15 | 208 | 6153 | 29.53 | 789 | 792 | 181.6 |
| C | 13 | 61 | 5696 | 27.01 | 789 | 792 | 181.6 |
| D | 5 | 222 | 688860 | 3638.25 | 786 | 762 | 189.1 |
| D | 1 | 52 | 79753 | 417.66 | 786 | 762 | 189.1 |
| D | 10 | 199 | 79207 | 414.77 | 786 | 762 | 189.1 |
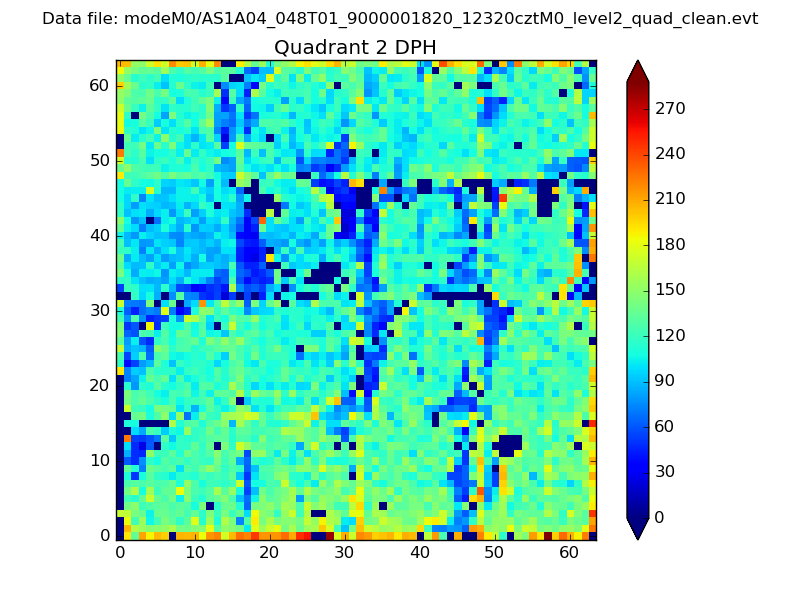
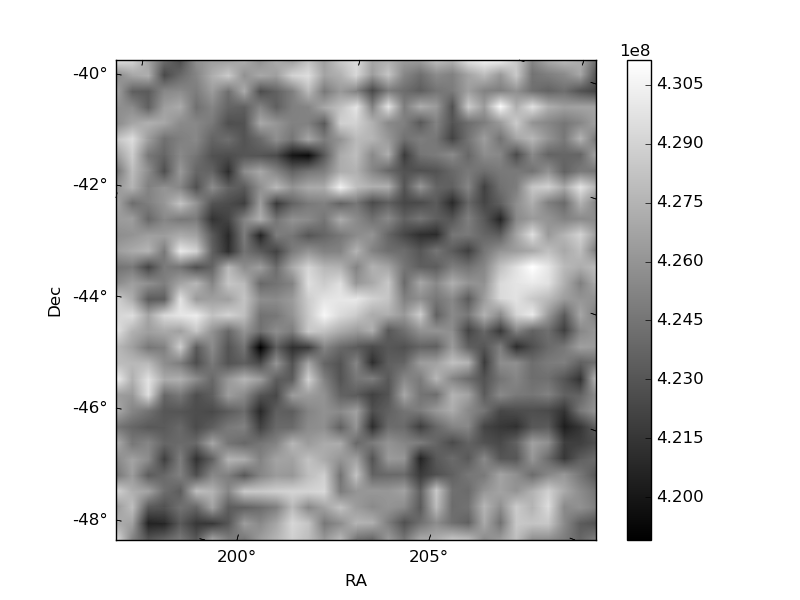
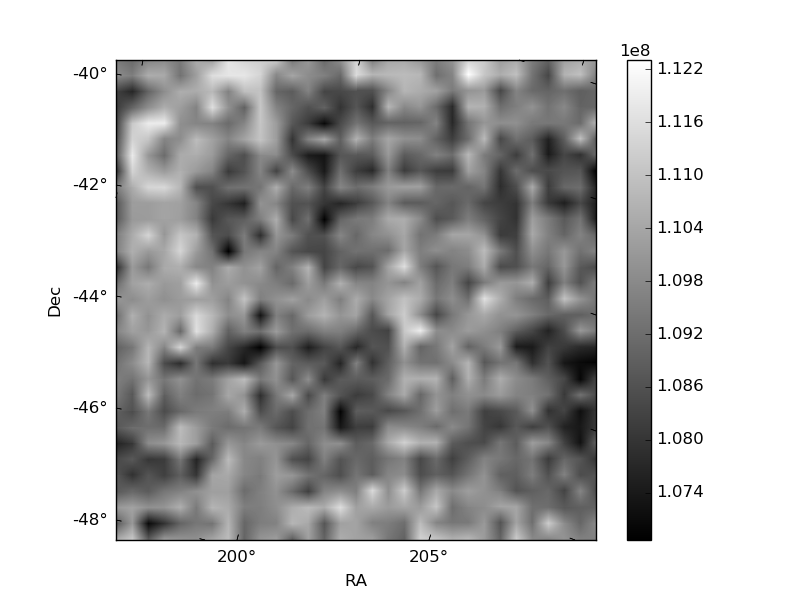
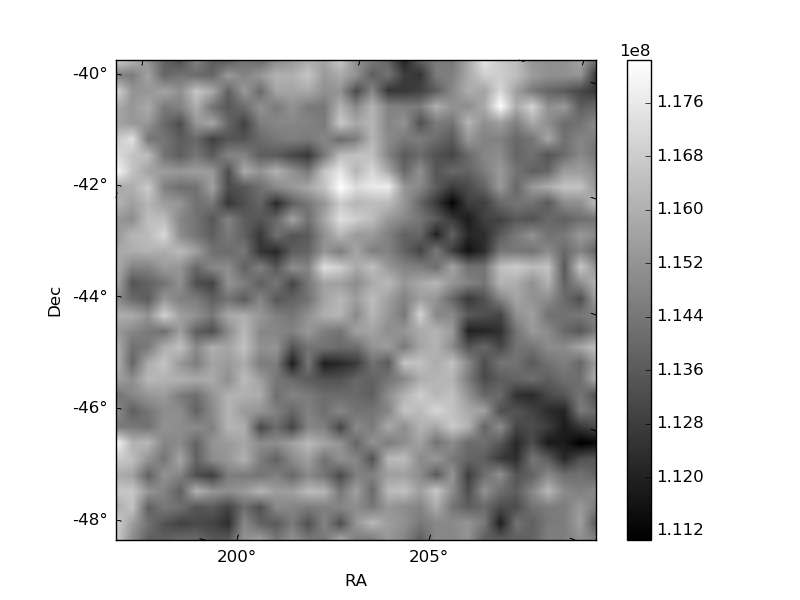
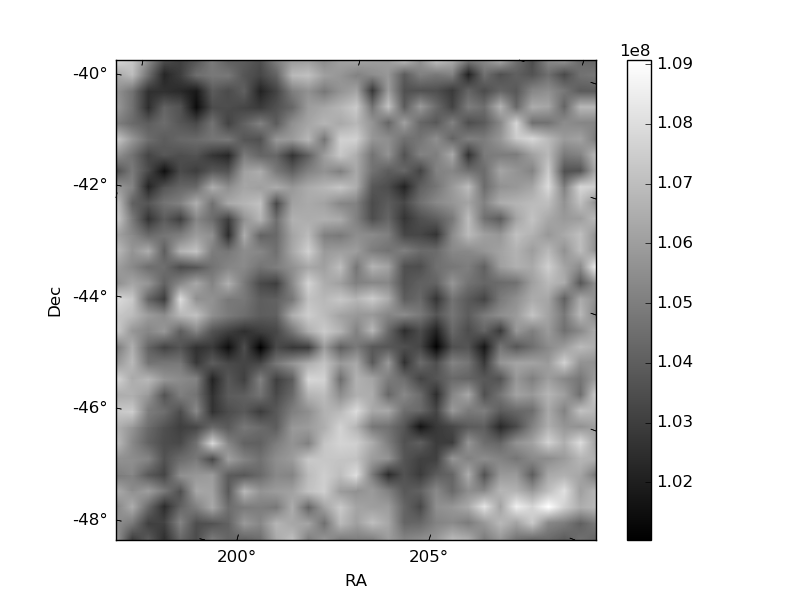
Histogram calculated using DETX and DETY for each event in the final _common_clean file
| Quadrant A | 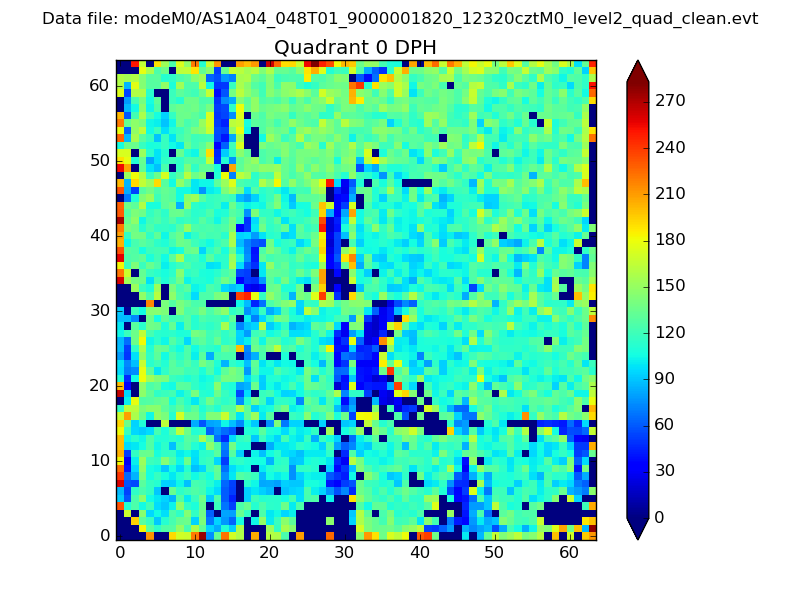 |
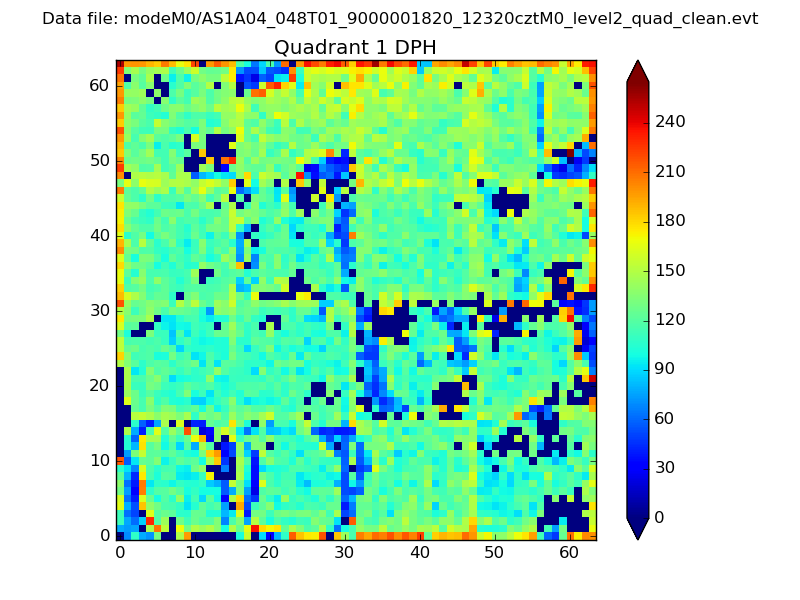 |
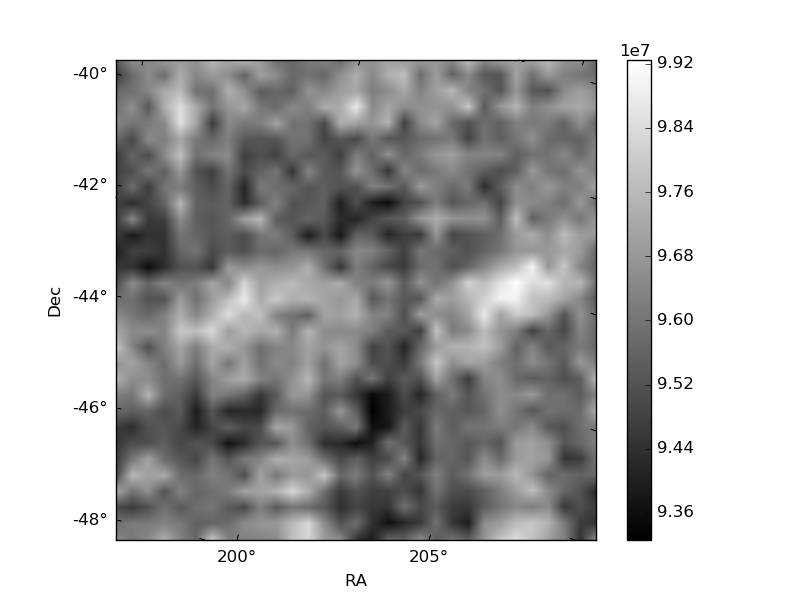
Quadrant B |
|---|---|---|---|
| Quadrant D | 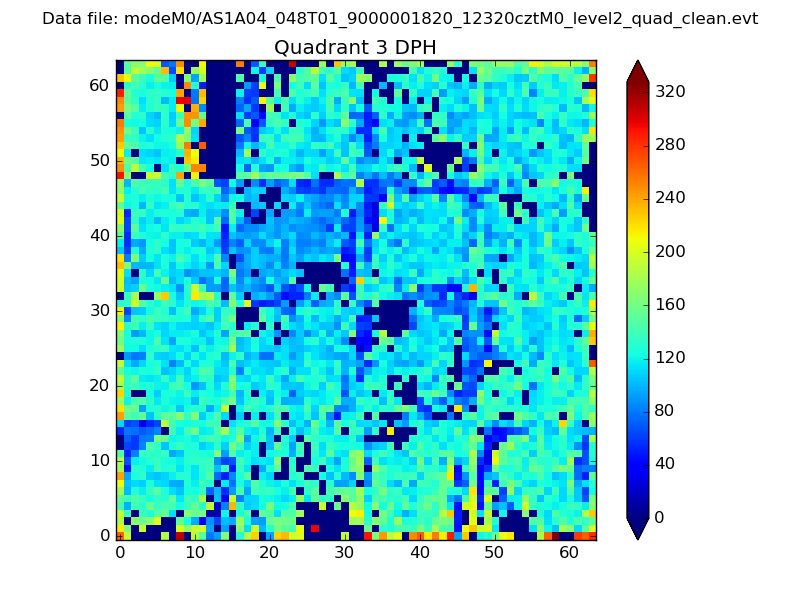 |
 |
Quadrant C |
| Plot type | Count rate plots | Images |
|---|---|---|
| Comparison with Poisson distribution Blue bars denote a histogram of data divided into 1 sec bins. Red curve is a Poisson curve with rate = median count rate of data. |
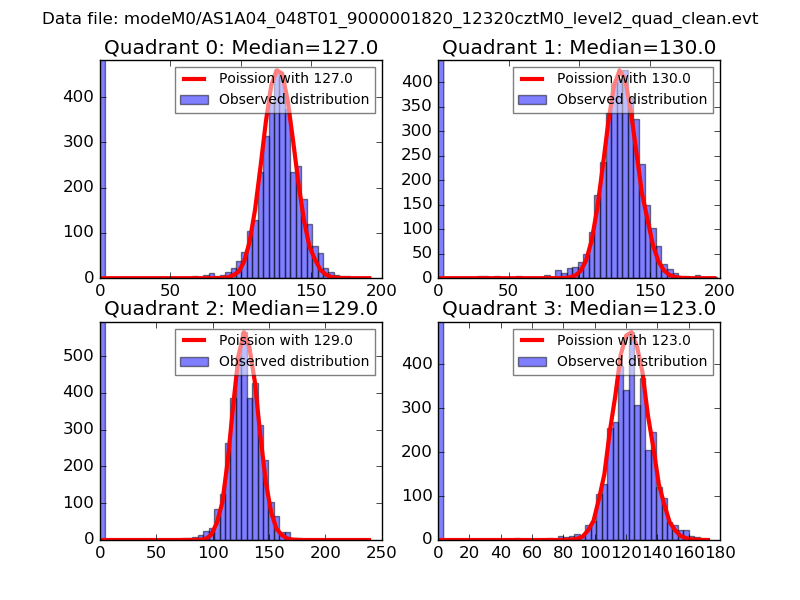 |
 |
| Quadrant-wise count rates Data is divided into 100 sec bins |
 |
|
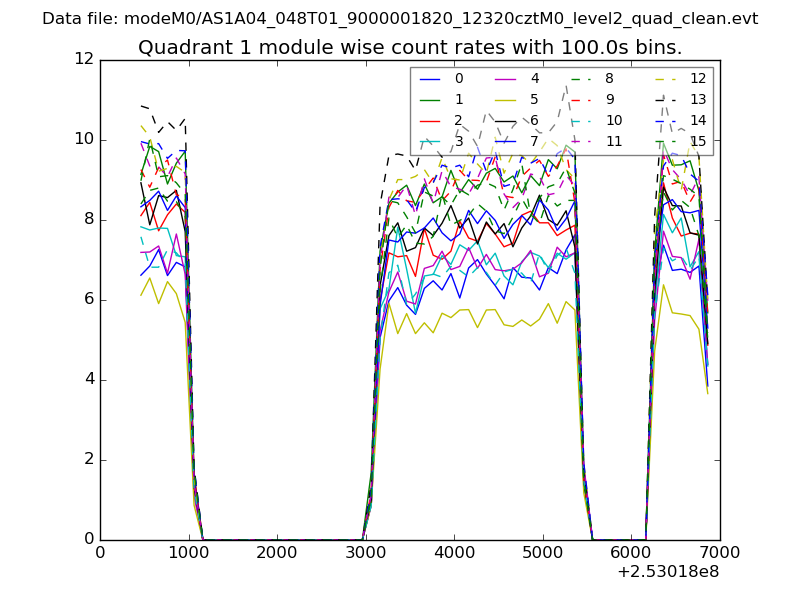
| Module-wise count rates for Quadrant A Data is divided into 100 sec bins |
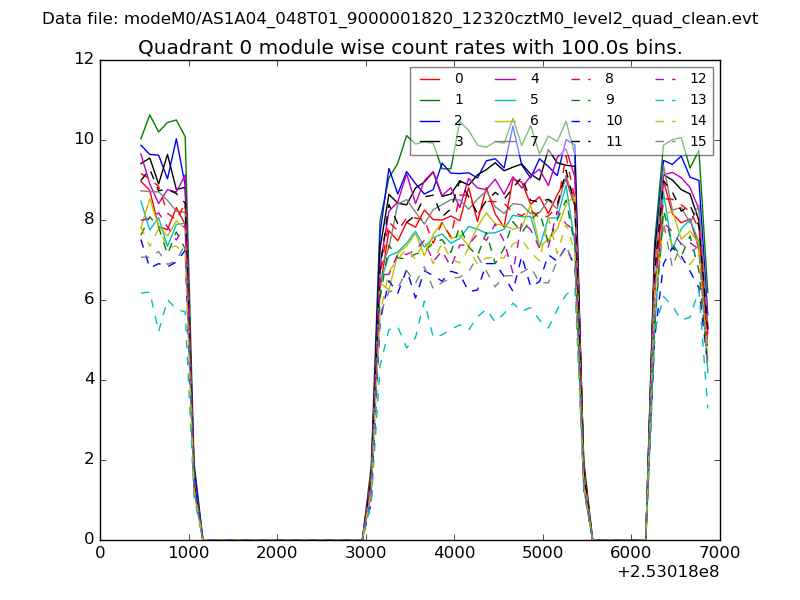 |
 |
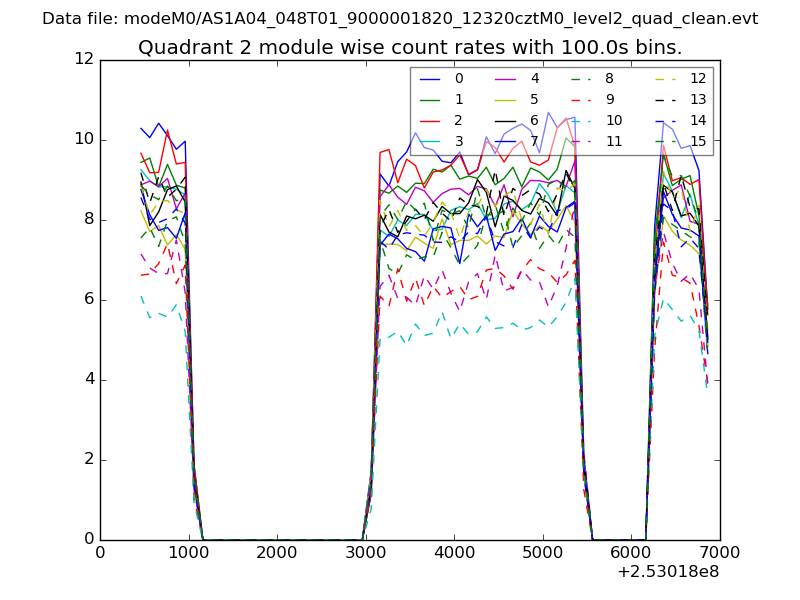
| Module-wise count rates for Quadrant B Data is divided into 100 sec bins |
 |
 |
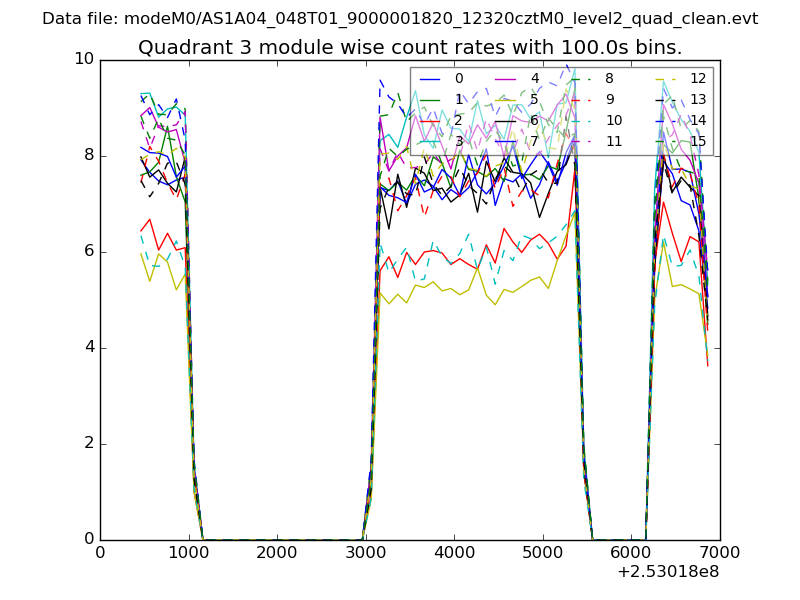
| Module-wise count rates for Quadrant C Data is divided into 100 sec bins |
 |
 |
| Module-wise count rates for Quadrant D Data is divided into 100 sec bins |
 |
 |
| Parameter | Plot |
|---|---|
| CZT HV Monitor | 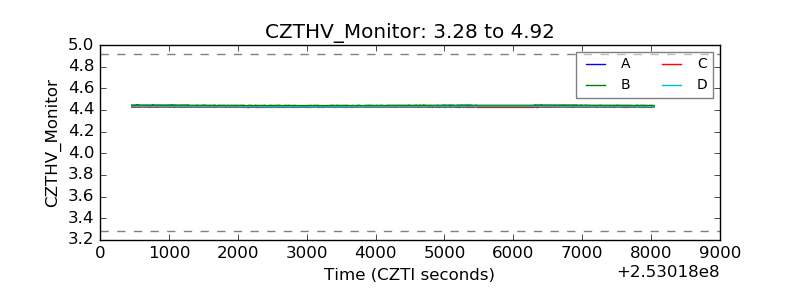 |
| D_VDD | 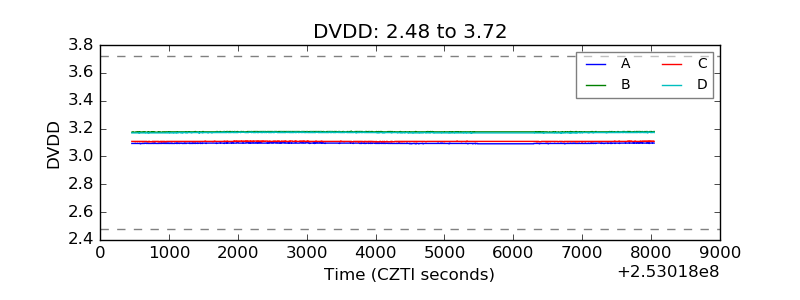 |
| Temperature 1 | 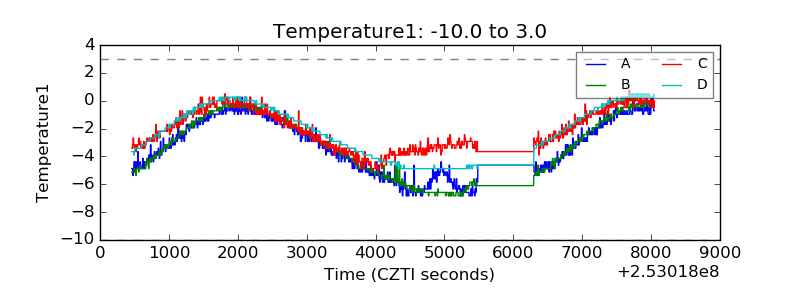 |
| Veto HV Monitor | 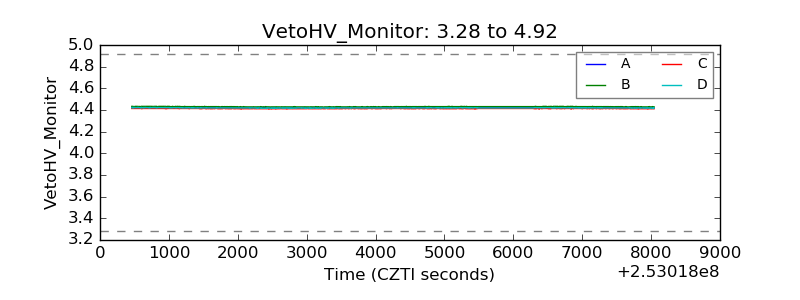 |
| Veto LLD | 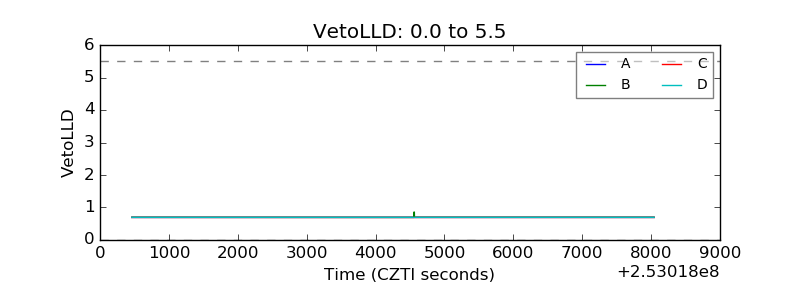 |
| Alpha Counter | 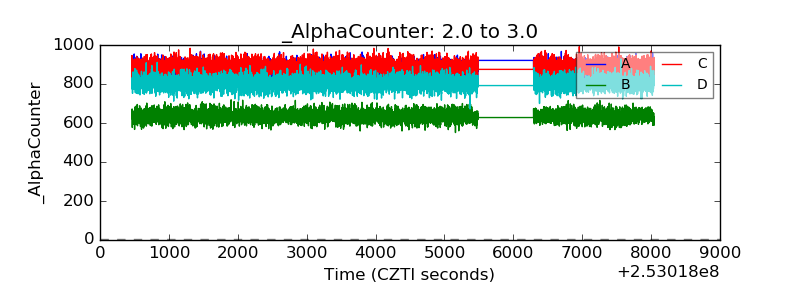 |
| _CPM_Rate | 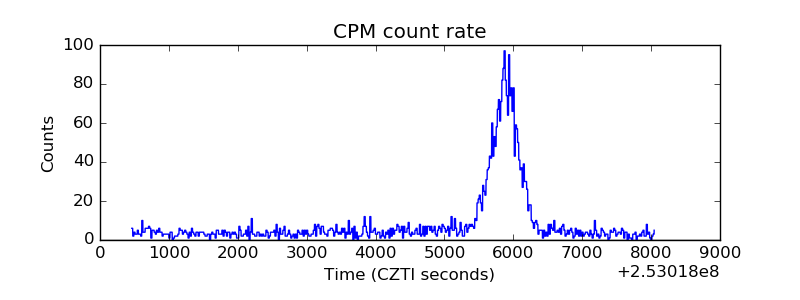 |
| CZT Counter |  |
| +2.5 Volts monitor |  |
| +5 Volts monitor |  |
| _ROLL_ROT | 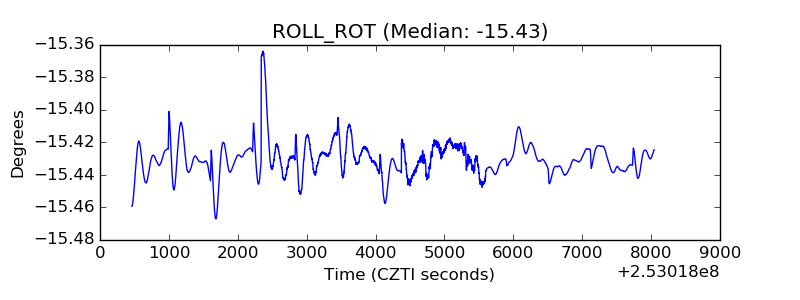 |
| _Roll_DEC |  |
| _Roll_RA | 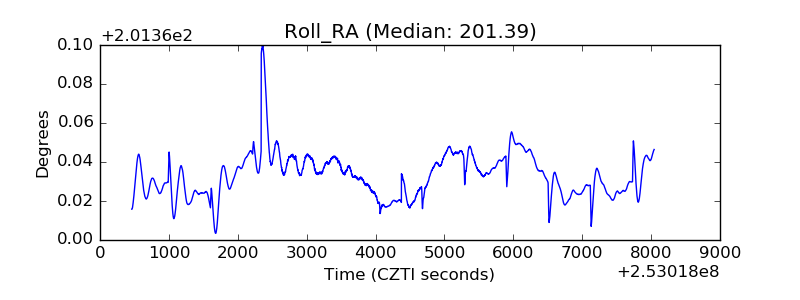 |
| Veto Counter | 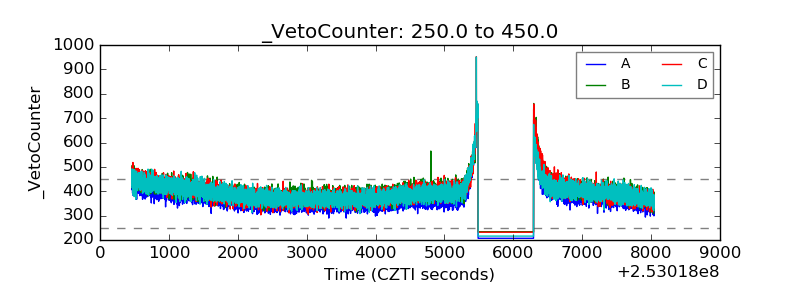 |