| Param | Original file | Final file |
|---|---|---|
| Filename | modeM0/AS1A04_048T01_9000001820_12321cztM0_level2.evt | modeM0/AS1A04_048T01_9000001820_12321cztM0_level2_quad_clean.evt |
| Size (bytes) | 553,066,560 | 73,998,720 |
| Size | 527.4 MB | 70.6 MB |
| Events in quadrant A | 4,839,723 | 436,233 |
| Events in quadrant B | 4,337,541 | 439,248 |
| Events in quadrant C | 3,345,205 | 443,384 |
| Events in quadrant D | 3,744,858 | 426,293 |
| Mode SS | |||
|---|---|---|---|
| Quadrant | BADHDUFLAG | Total packets | Discarded packets |
| A | 0 | 144 | 0 |
| B | 0 | 144 | 0 |
| C | 0 | 144 | 0 |
| D | 0 | 144 | 0 |
| Mode M0 | |||
|---|---|---|---|
| Quadrant | BADHDUFLAG | Total packets | Discarded packets |
| A | 0 | 19156 | 2 |
| B | 0 | 17424 | 1 |
| C | 0 | 14948 | 1 |
| D | 0 | 16021 | 1 |
| Mode M9 | |||
|---|---|---|---|
| Quadrant | BADHDUFLAG | Total packets | Discarded packets |
| A | 0 | 4 | 0 |
| B | 0 | 4 | 0 |
| C | 0 | 4 | 0 |
| D | 0 | 4 | 0 |
| Quadrant | Total seconds | Saturated seconds | Saturation percentage |
|---|---|---|---|
| A | 7112 | 281 | 3.951069% |
| B | 7112 | 450 | 6.327334% |
| C | 7112 | 120 | 1.687289% |
| D | 7112 | 169 | 2.376265% |
Noise dominated data is calculated using 1-second bins in cleaned event files. If a bin has >2000 counts, and if more than 50% of those come from <1% of pixels, then it is considered to be noise-dominated and hence unusable.
| Quadrant | # 1 sec bins | Bins with >0 counts | Bins with >2000 counts | High rate bins dominated by noise | Noise dominated (total time) | Noise dominated (detector-on time) | Marked lightcurve |
|---|---|---|---|---|---|---|---|
| A | 7498 | 7114 | 5 | 5 | 0.07% | 0.07% | 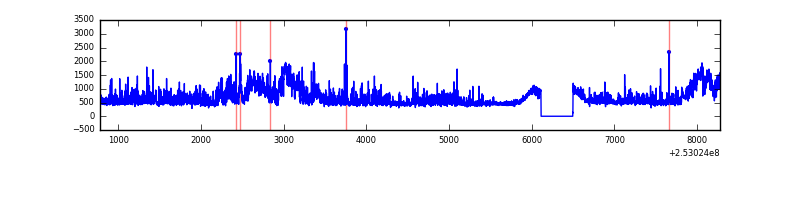 |
| B | 7498 | 7114 | 173 | 173 | 2.31% | 2.43% | 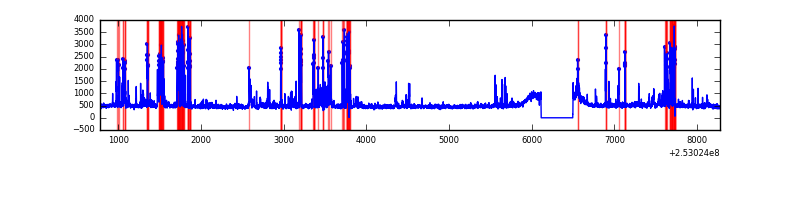 |
| C | 7498 | 7114 | 14 | 14 | 0.19% | 0.20% | 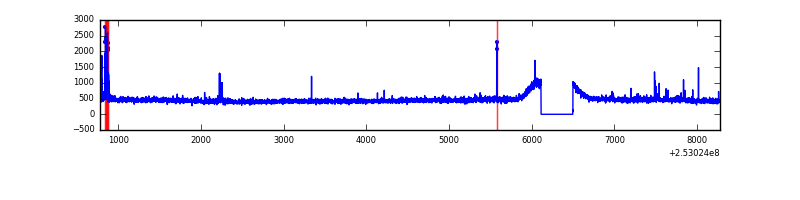 |
| D | 7498 | 7114 | 42 | 42 | 0.56% | 0.59% | 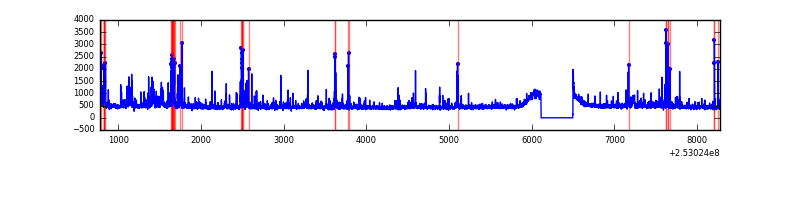 |
Top three noisy pixels from each quadrant. If the there are fewer than three noisy pixels in the level2.evt file, extra rows are filled as -1
| Pixel properties | Quadrant properties | ||||||
|---|---|---|---|---|---|---|---|
| Quadrant | DetID | PixID | Counts | Sigma | Mean | Median | Sigma |
| A | 15 | 174 | 563067 | 3230.57 | 851 | 830 | 174.0 |
| A | 1 | 162 | 267032 | 1529.57 | 851 | 830 | 174.0 |
| A | 1 | 178 | 155395 | 888.12 | 851 | 830 | 174.0 |
| B | 4 | 239 | 700692 | 4385.39 | 835 | 816 | 159.6 |
| B | 0 | 85 | 135955 | 846.77 | 835 | 816 | 159.6 |
| B | 0 | 197 | 58435 | 361.04 | 835 | 816 | 159.6 |
| C | 4 | 254 | 71613 | 367.89 | 830 | 834 | 192.4 |
| C | 15 | 208 | 13469 | 65.67 | 830 | 834 | 192.4 |
| C | 0 | 207 | 11379 | 54.81 | 830 | 834 | 192.4 |
| D | 5 | 222 | 191749 | 942.29 | 832 | 807 | 202.6 |
| D | 1 | 52 | 86896 | 424.84 | 832 | 807 | 202.6 |
| D | 7 | 71 | 72121 | 351.93 | 832 | 807 | 202.6 |
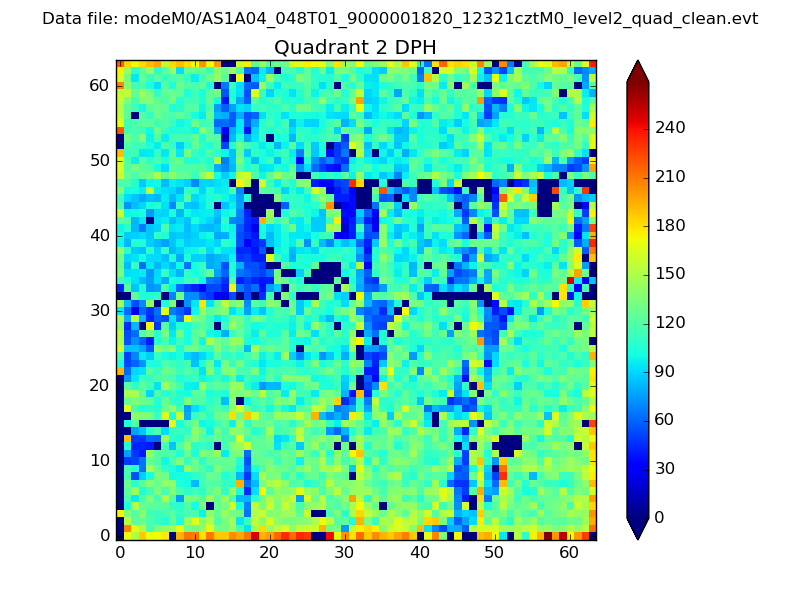
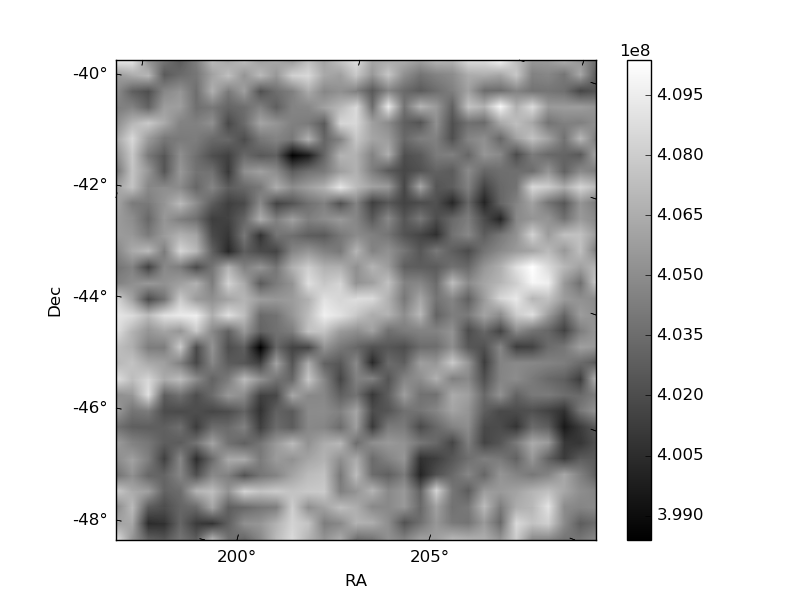
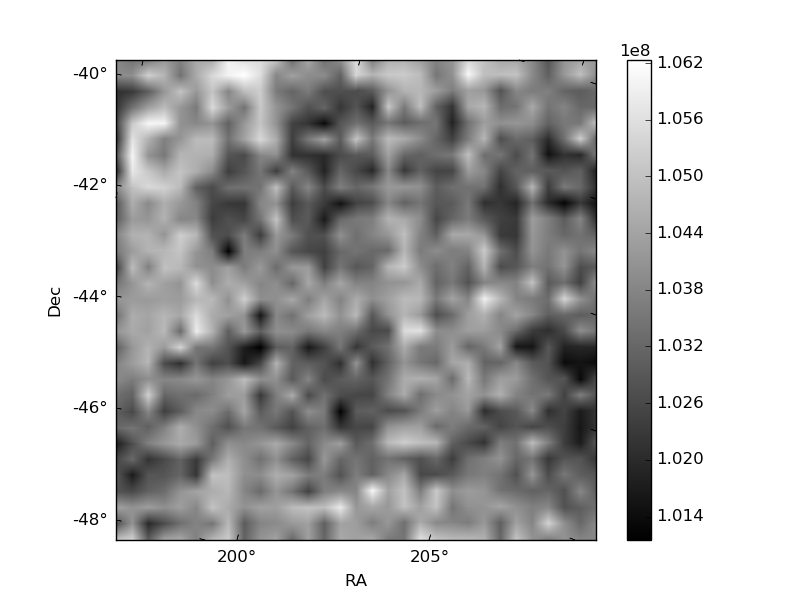
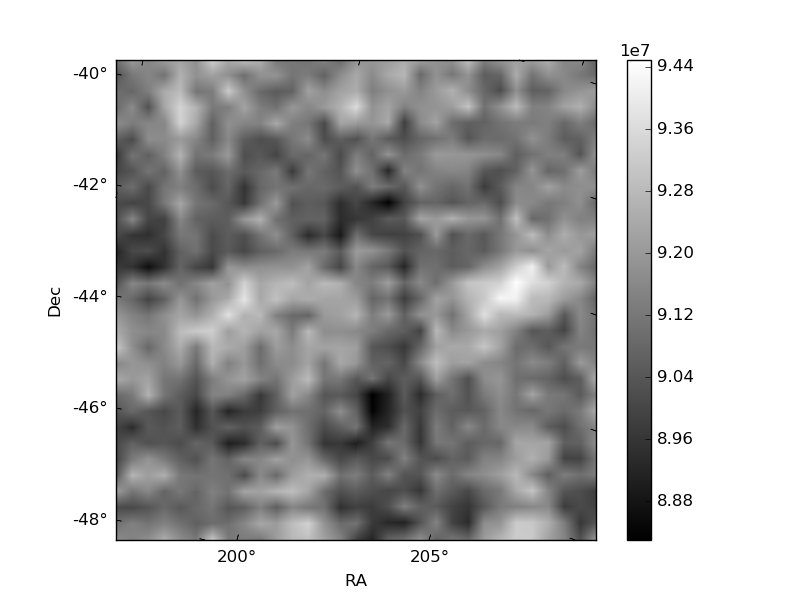
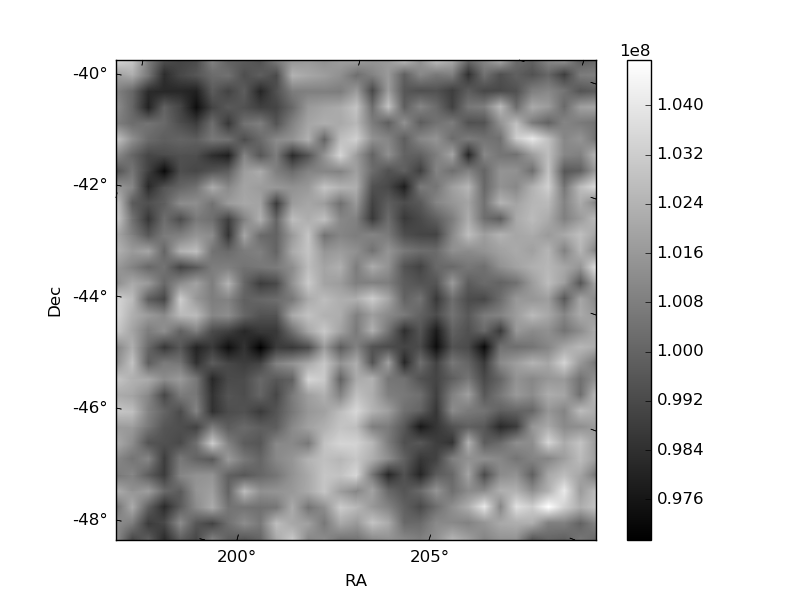
Histogram calculated using DETX and DETY for each event in the final _common_clean file
| Quadrant A | 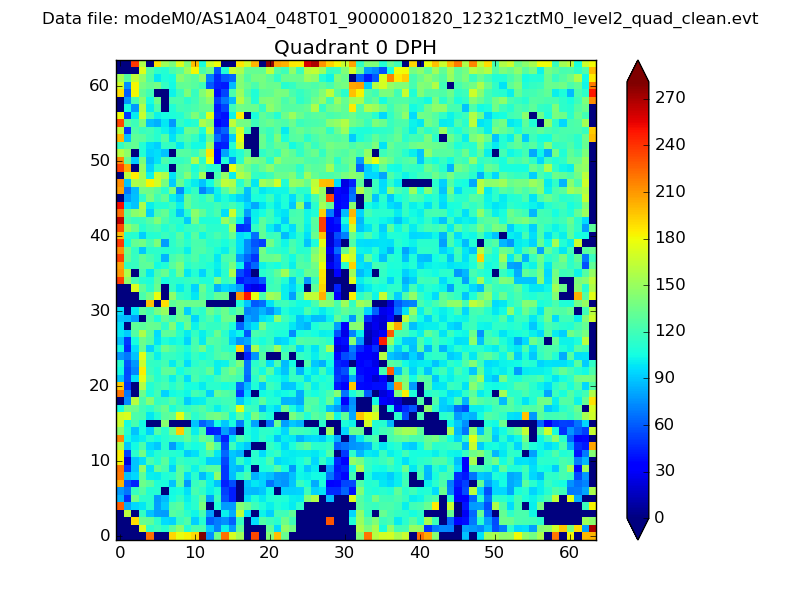 |
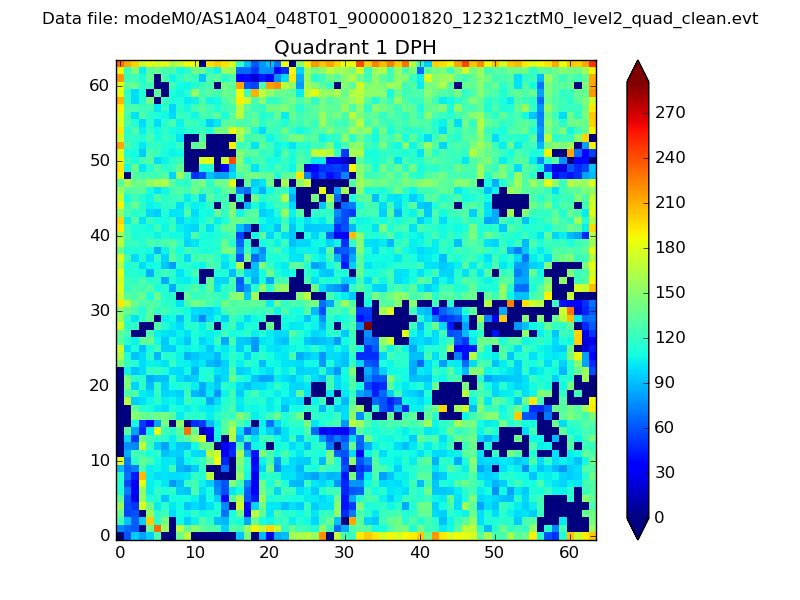 |
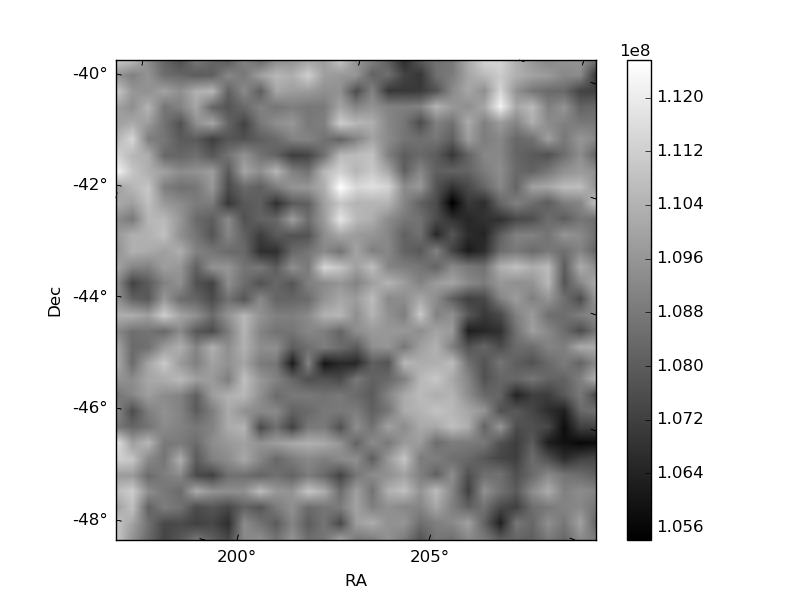
Quadrant B |
|---|---|---|---|
| Quadrant D | 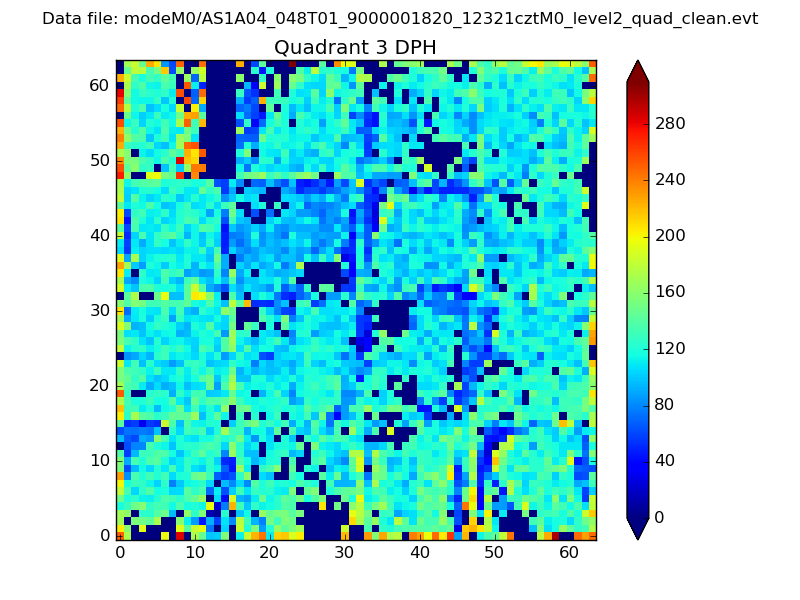 |
 |
Quadrant C |
| Plot type | Count rate plots | Images |
|---|---|---|
| Comparison with Poisson distribution Blue bars denote a histogram of data divided into 1 sec bins. Red curve is a Poisson curve with rate = median count rate of data. |
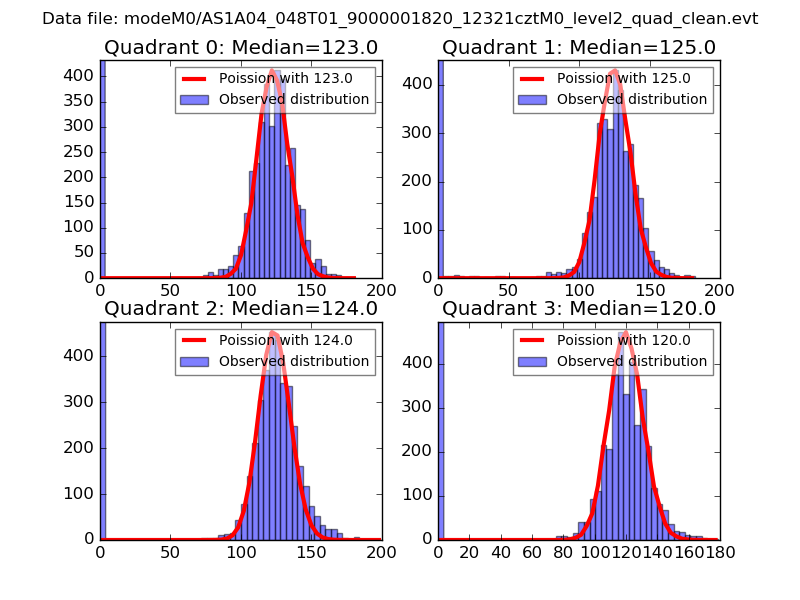 |
 |
| Quadrant-wise count rates Data is divided into 100 sec bins |
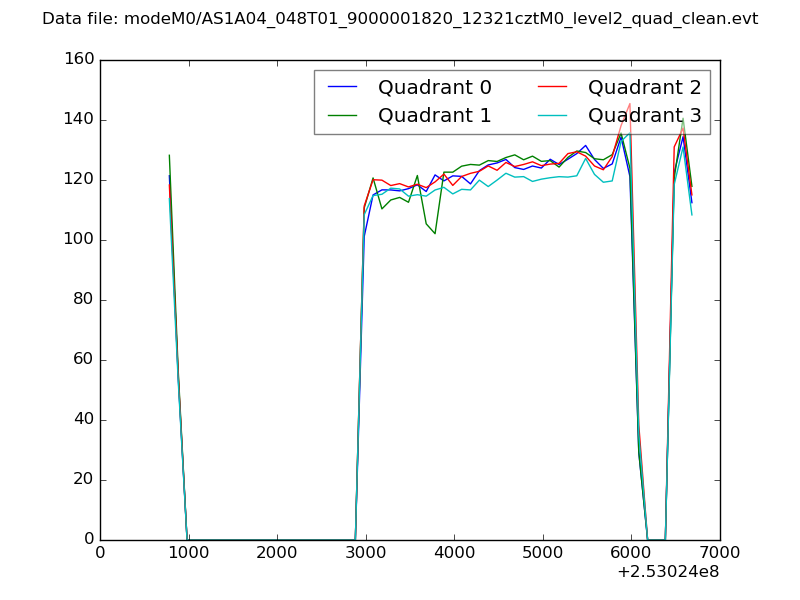 |
|
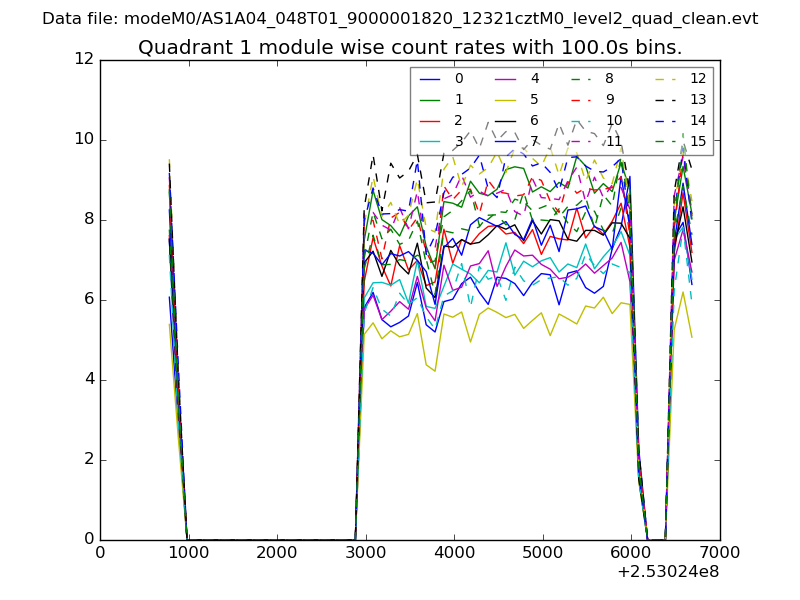
| Module-wise count rates for Quadrant A Data is divided into 100 sec bins |
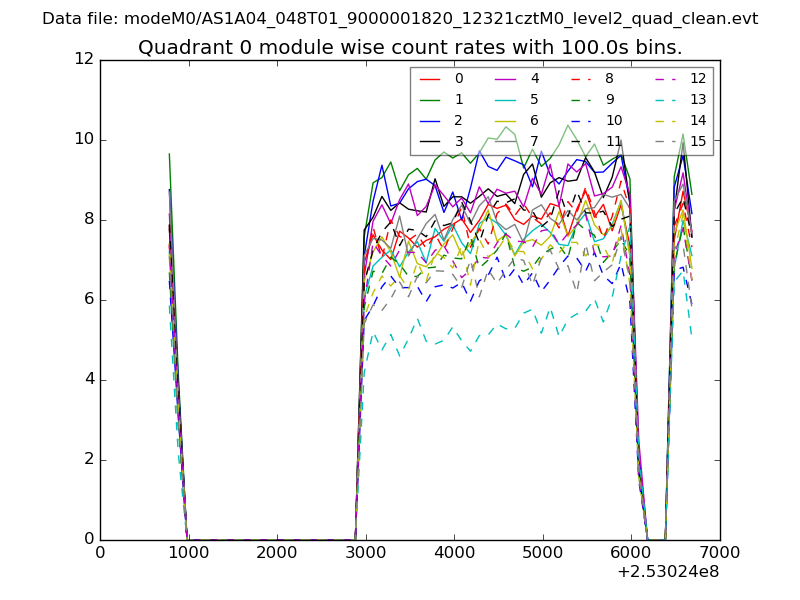 |
 |
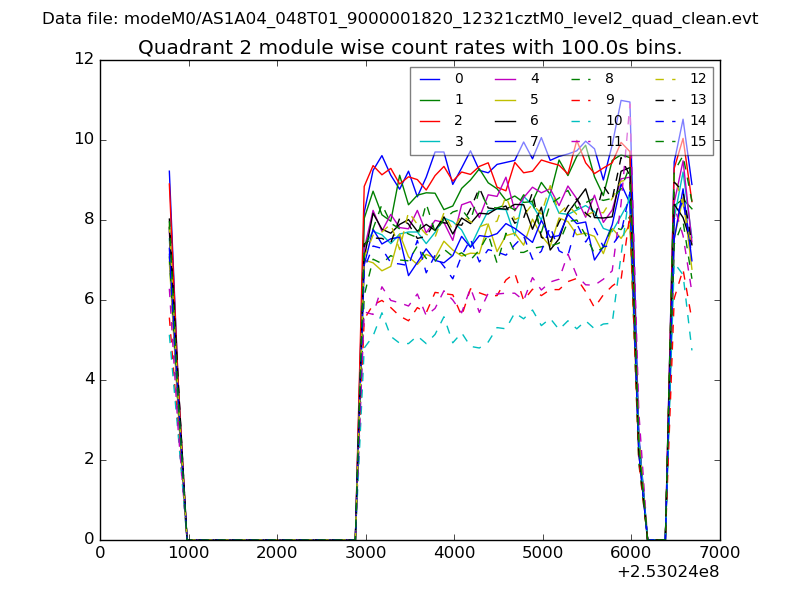
| Module-wise count rates for Quadrant B Data is divided into 100 sec bins |
 |
 |
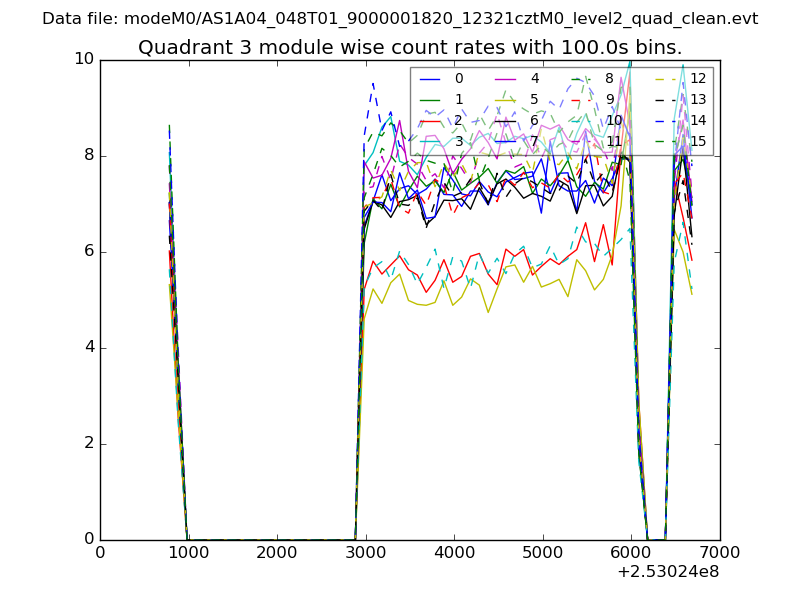
| Module-wise count rates for Quadrant C Data is divided into 100 sec bins |
 |
 |
| Module-wise count rates for Quadrant D Data is divided into 100 sec bins |
 |
 |
| Parameter | Plot |
|---|---|
| CZT HV Monitor | 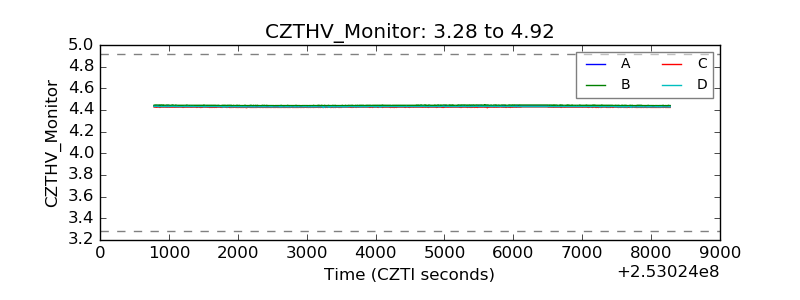 |
| D_VDD | 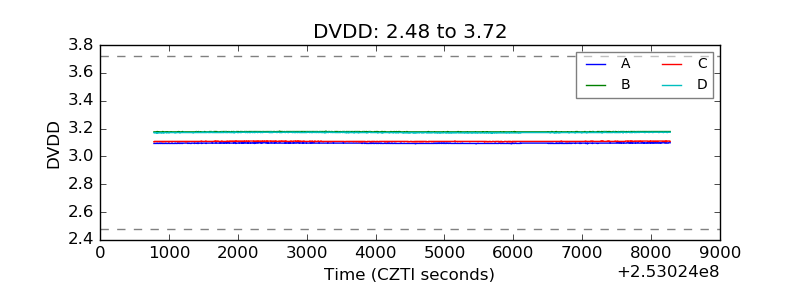 |
| Temperature 1 | 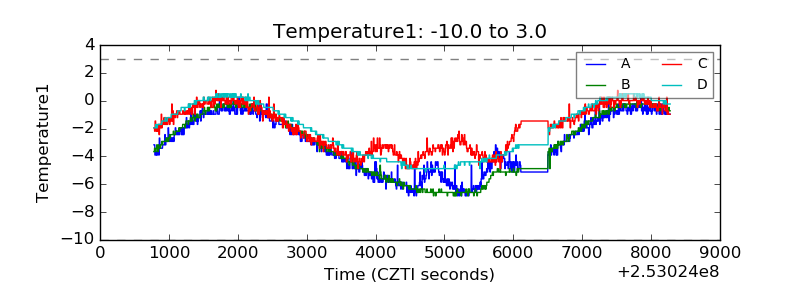 |
| Veto HV Monitor | 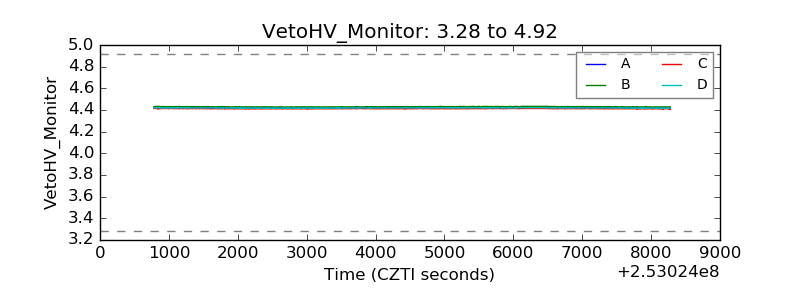 |
| Veto LLD | 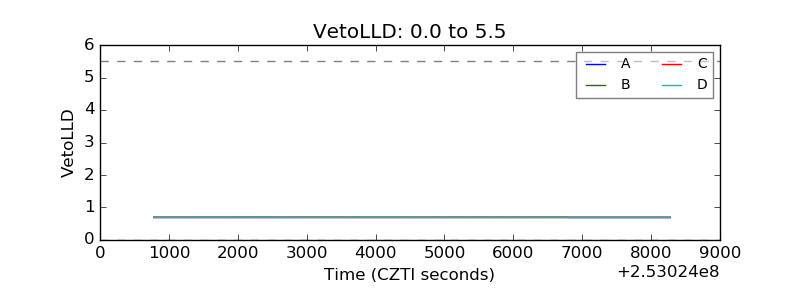 |
| Alpha Counter | 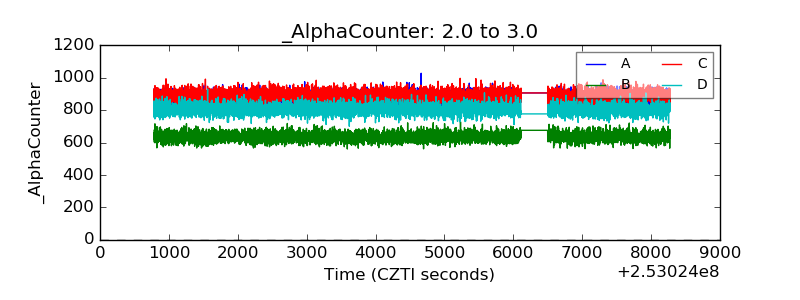 |
| _CPM_Rate | 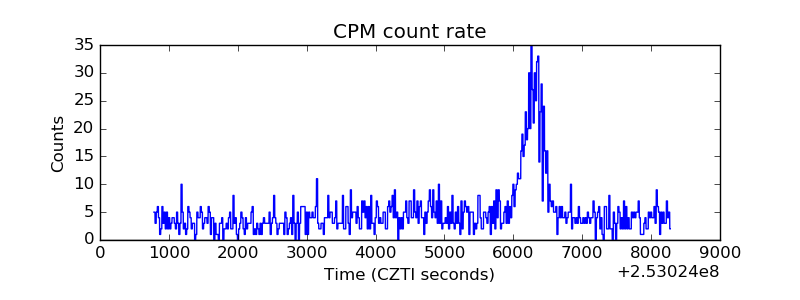 |
| CZT Counter | 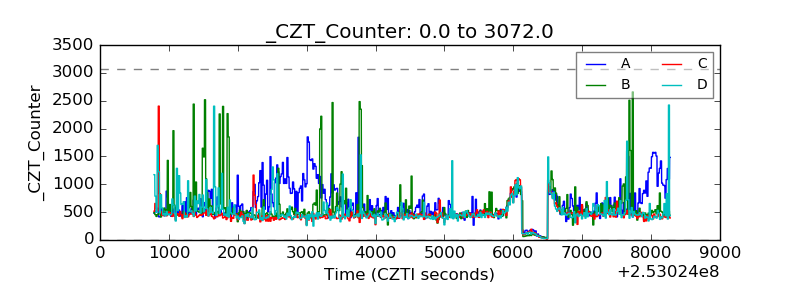 |
| +2.5 Volts monitor |  |
| +5 Volts monitor |  |
| _ROLL_ROT | 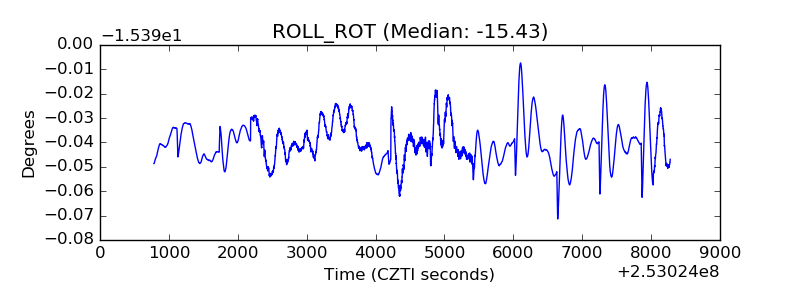 |
| _Roll_DEC | 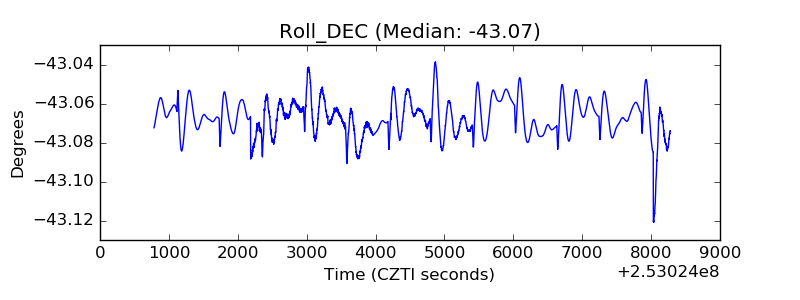 |
| _Roll_RA | 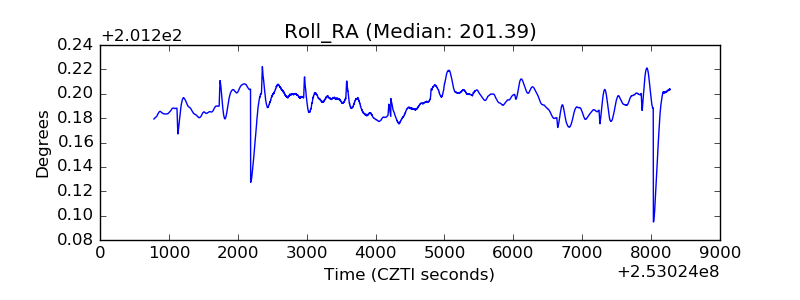 |
| Veto Counter | 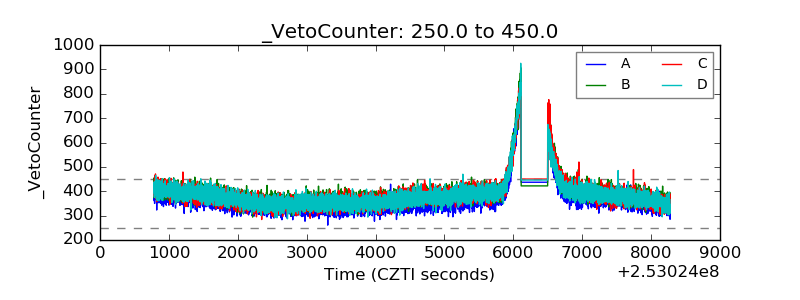 |