| Param | Original file | Final file |
|---|---|---|
| Filename | modeM0/AS1A04_048T01_9000001820_12322cztM0_level2.evt | modeM0/AS1A04_048T01_9000001820_12322cztM0_level2_quad_clean.evt |
| Size (bytes) | 589,458,240 | 73,725,120 |
| Size | 562.2 MB | 70.3 MB |
| Events in quadrant A | 5,547,445 | 437,953 |
| Events in quadrant B | 4,570,722 | 443,807 |
| Events in quadrant C | 3,287,762 | 447,878 |
| Events in quadrant D | 3,968,055 | 411,417 |
| Mode SS | |||
|---|---|---|---|
| Quadrant | BADHDUFLAG | Total packets | Discarded packets |
| A | 0 | 142 | 0 |
| B | 0 | 142 | 0 |
| C | 0 | 142 | 0 |
| D | 0 | 142 | 0 |
| Mode M0 | |||
|---|---|---|---|
| Quadrant | BADHDUFLAG | Total packets | Discarded packets |
| A | 0 | 21304 | 2 |
| B | 0 | 18106 | 1 |
| C | 0 | 14766 | 1 |
| D | 0 | 16661 | 1 |
| Mode M9 | |||
|---|---|---|---|
| Quadrant | BADHDUFLAG | Total packets | Discarded packets |
| A | 0 | 3 | 0 |
| B | 0 | 3 | 0 |
| C | 0 | 3 | 0 |
| D | 0 | 3 | 0 |
| Quadrant | Total seconds | Saturated seconds | Saturation percentage |
|---|---|---|---|
| A | 7052 | 347 | 4.920590% |
| B | 7052 | 503 | 7.132728% |
| C | 7052 | 95 | 1.347136% |
| D | 7052 | 364 | 5.161656% |
Noise dominated data is calculated using 1-second bins in cleaned event files. If a bin has >2000 counts, and if more than 50% of those come from <1% of pixels, then it is considered to be noise-dominated and hence unusable.
| Quadrant | # 1 sec bins | Bins with >0 counts | Bins with >2000 counts | High rate bins dominated by noise | Noise dominated (total time) | Noise dominated (detector-on time) | Marked lightcurve |
|---|---|---|---|---|---|---|---|
| A | 7298 | 7054 | 17 | 17 | 0.23% | 0.24% | 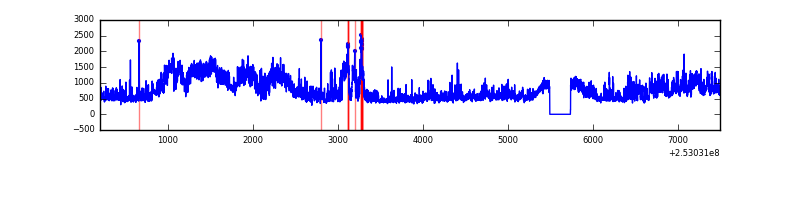 |
| B | 7298 | 7054 | 206 | 206 | 2.82% | 2.92% | 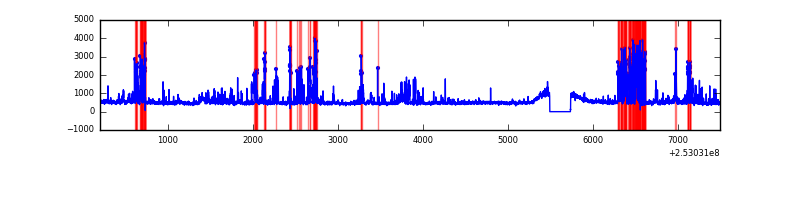 |
| C | 7298 | 7054 | 5 | 5 | 0.07% | 0.07% | 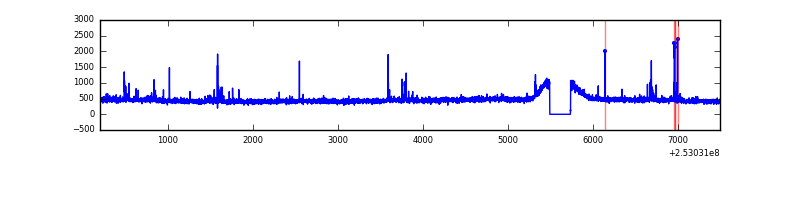 |
| D | 7298 | 7054 | 58 | 58 | 0.79% | 0.82% | 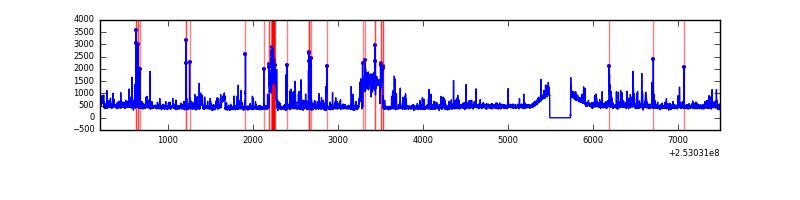 |
Top three noisy pixels from each quadrant. If the there are fewer than three noisy pixels in the level2.evt file, extra rows are filled as -1
| Pixel properties | Quadrant properties | ||||||
|---|---|---|---|---|---|---|---|
| Quadrant | DetID | PixID | Counts | Sigma | Mean | Median | Sigma |
| A | 15 | 174 | 810722 | 4717.94 | 834 | 817 | 171.7 |
| A | 0 | 23 | 335194 | 1947.85 | 834 | 817 | 171.7 |
| A | 1 | 162 | 307197 | 1784.75 | 834 | 817 | 171.7 |
| B | 4 | 239 | 975928 | 6143.27 | 821 | 799 | 158.7 |
| B | 15 | 36 | 82458 | 514.45 | 821 | 799 | 158.7 |
| B | 0 | 85 | 81887 | 510.85 | 821 | 799 | 158.7 |
| C | 0 | 207 | 33674 | 172.67 | 818 | 821 | 190.3 |
| C | 1 | 16 | 23556 | 119.49 | 818 | 821 | 190.3 |
| C | 4 | 254 | 21704 | 109.76 | 818 | 821 | 190.3 |
| D | 10 | 253 | 139401 | 704.35 | 804 | 781 | 196.8 |
| D | 13 | 104 | 119866 | 605.09 | 804 | 781 | 196.8 |
| D | 13 | 44 | 86651 | 436.32 | 804 | 781 | 196.8 |
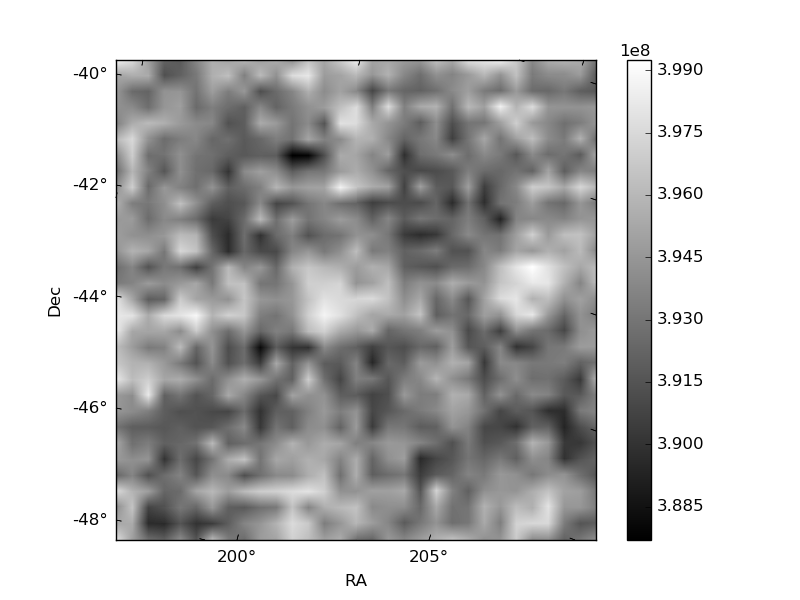
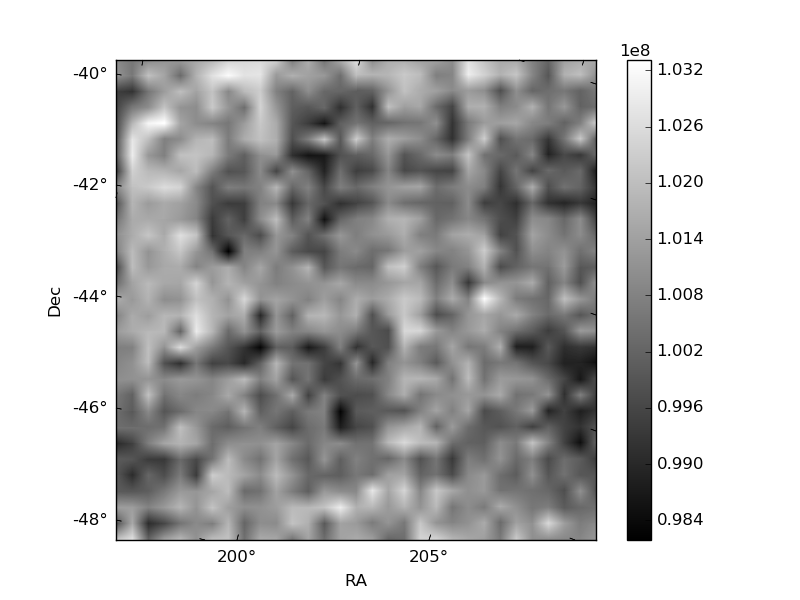
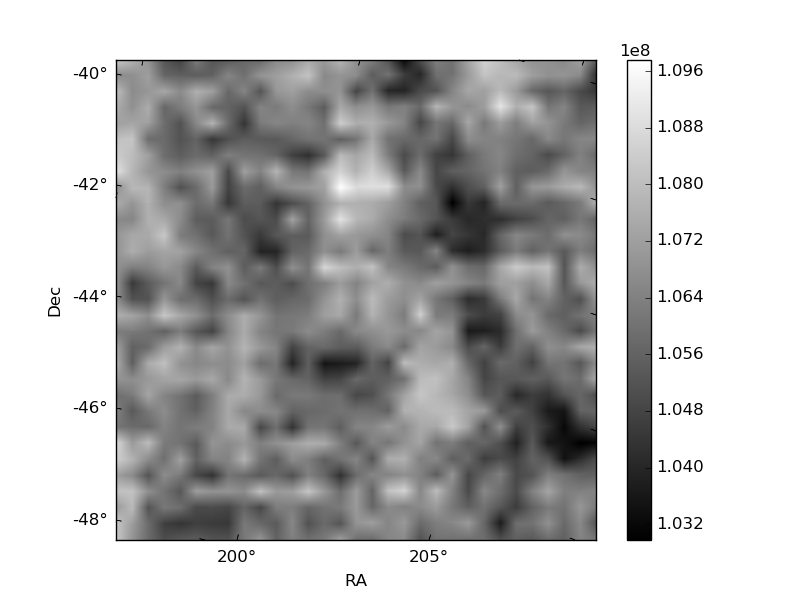
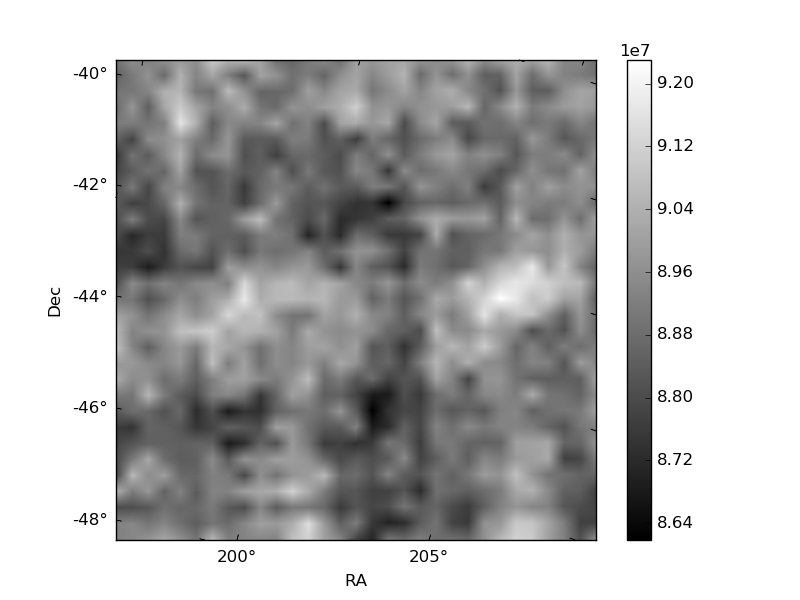
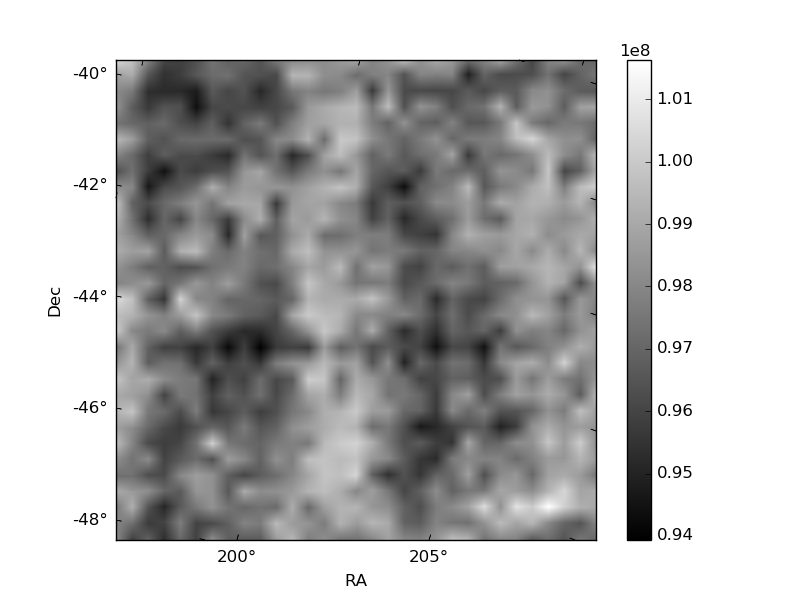
Histogram calculated using DETX and DETY for each event in the final _common_clean file
| Quadrant A | 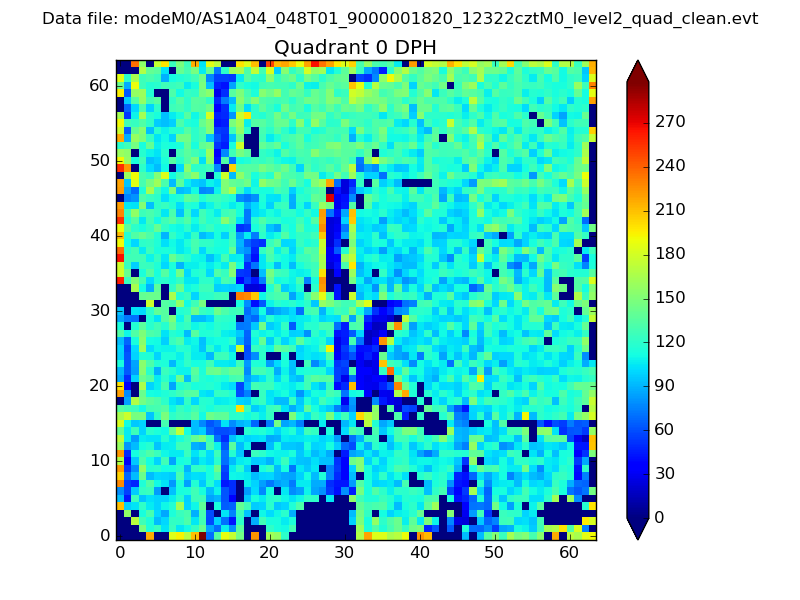 |
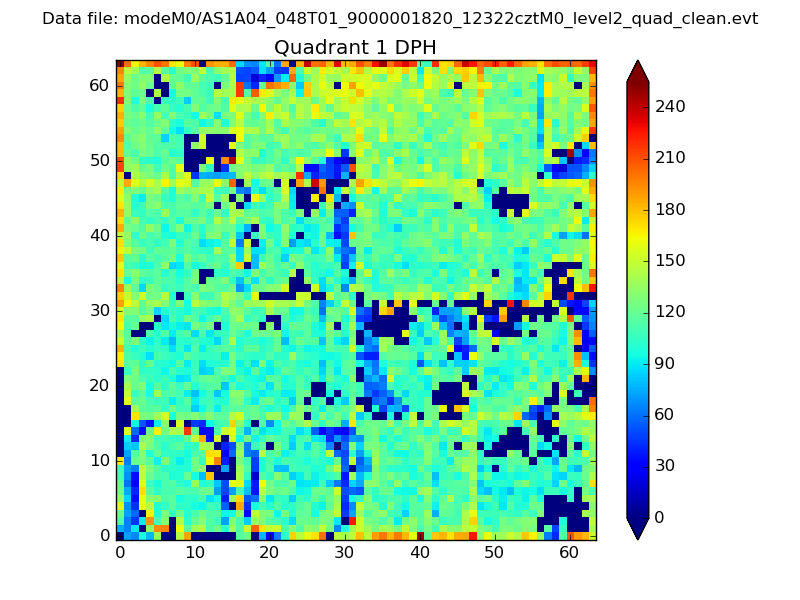 |
Quadrant B |
|---|---|---|---|
| Quadrant D | 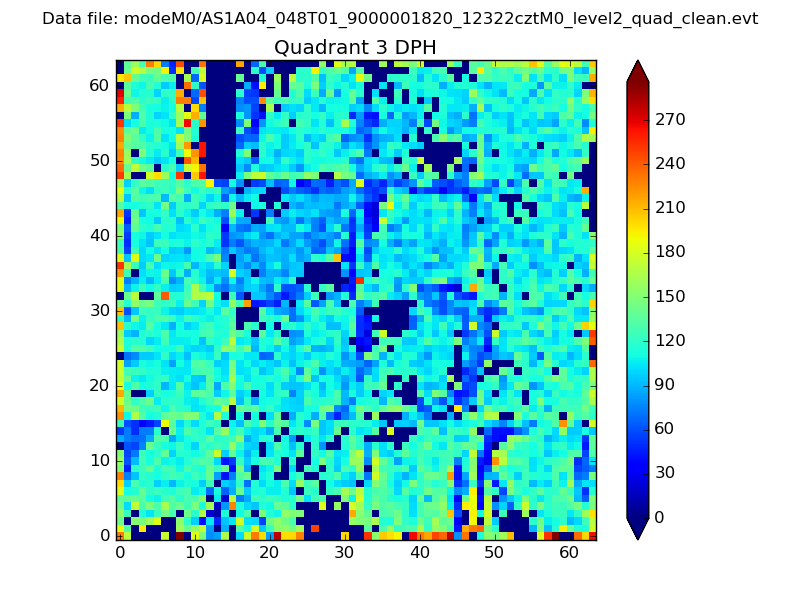 |
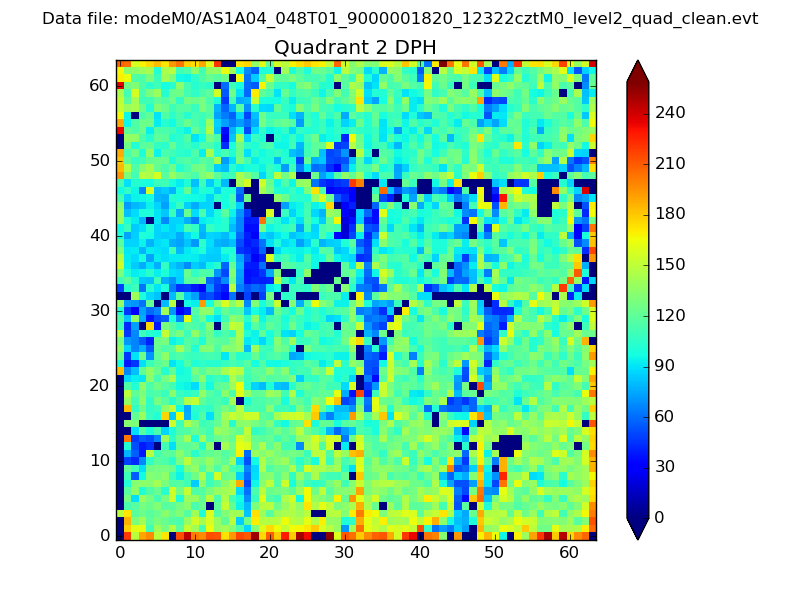 |
Quadrant C |
| Plot type | Count rate plots | Images |
|---|---|---|
| Comparison with Poisson distribution Blue bars denote a histogram of data divided into 1 sec bins. Red curve is a Poisson curve with rate = median count rate of data. |
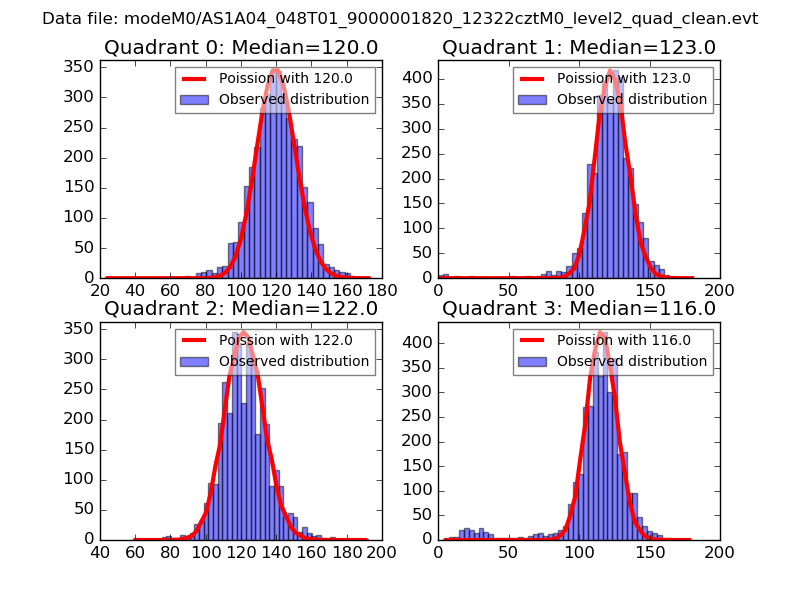 |
 |
| Quadrant-wise count rates Data is divided into 100 sec bins |
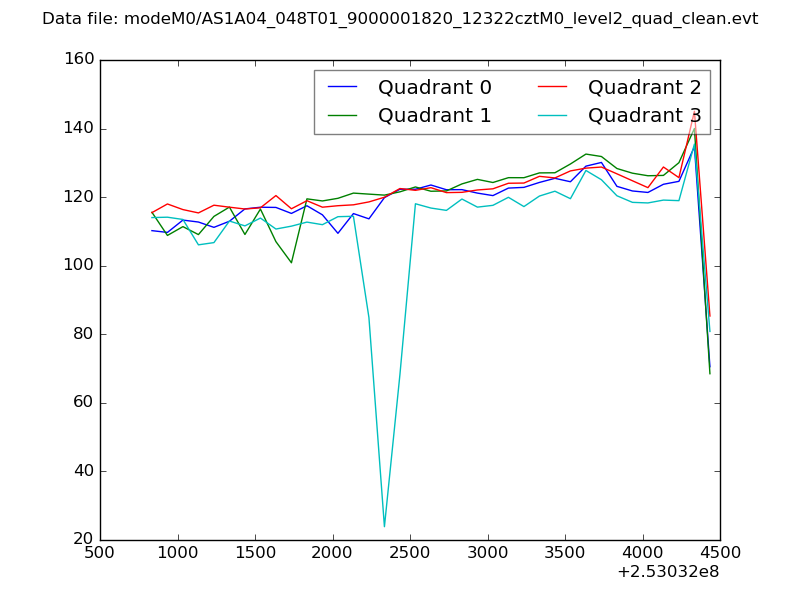 |
|
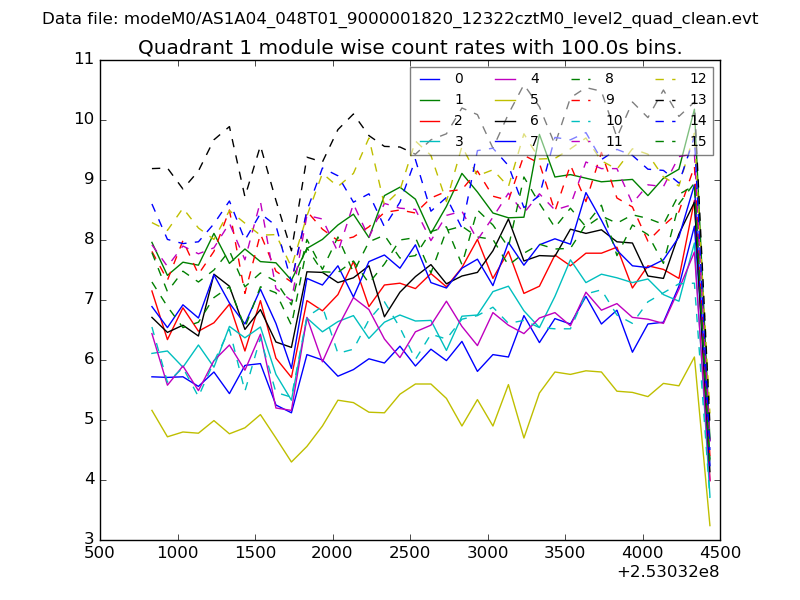
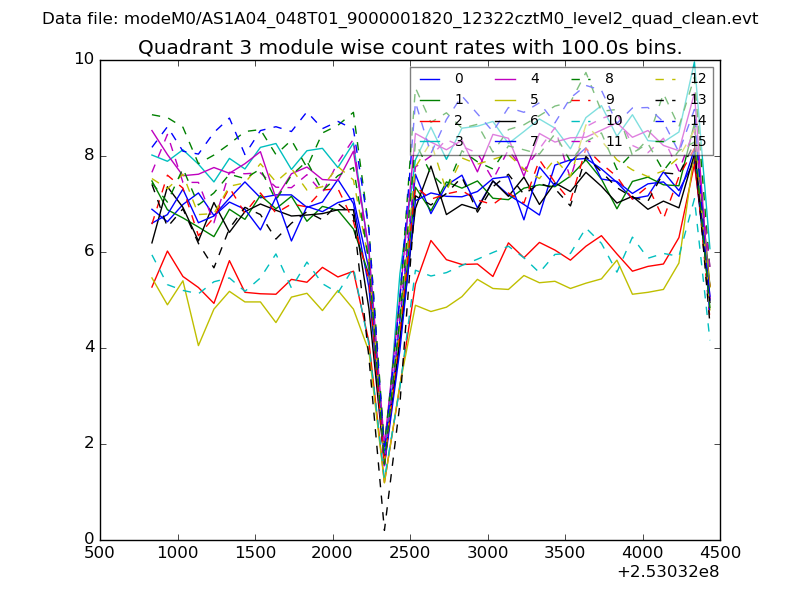
| Module-wise count rates for Quadrant A Data is divided into 100 sec bins |
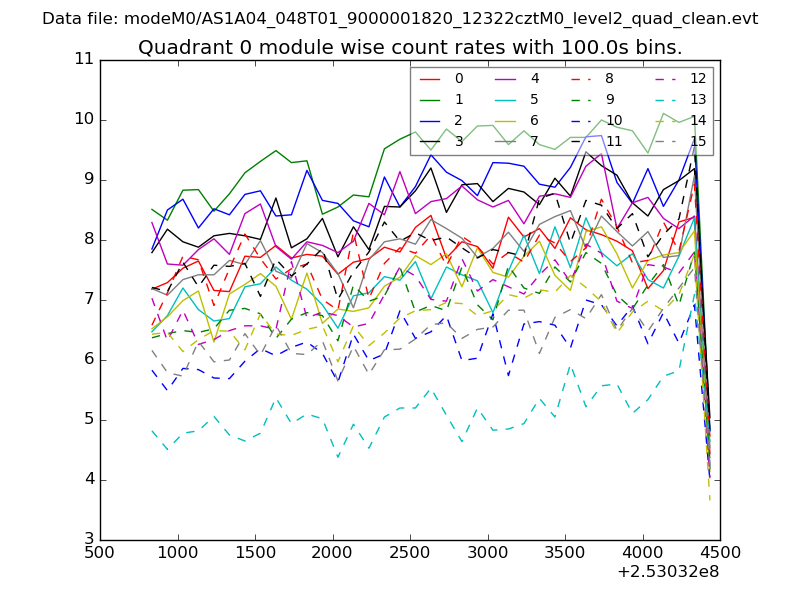 |
 |
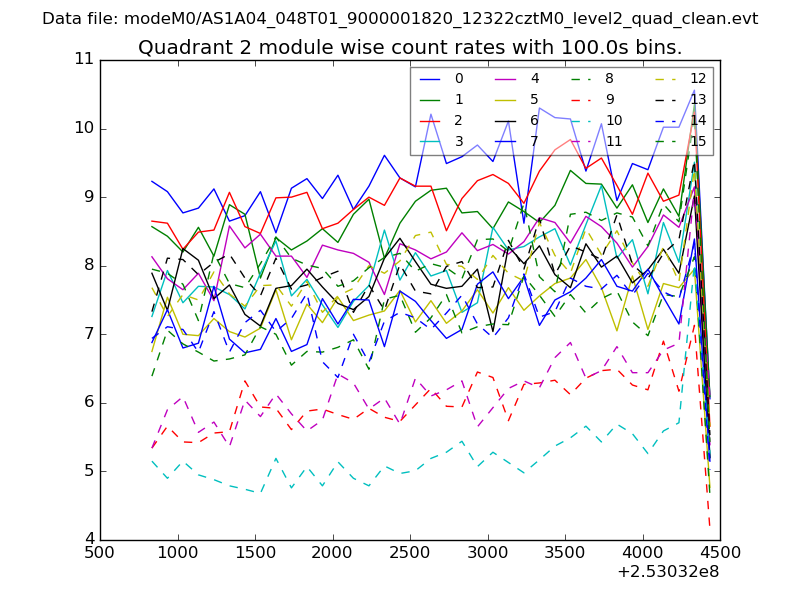
| Module-wise count rates for Quadrant B Data is divided into 100 sec bins |
 |
 |
| Module-wise count rates for Quadrant C Data is divided into 100 sec bins |
 |
 |
| Module-wise count rates for Quadrant D Data is divided into 100 sec bins |
 |
 |
| Parameter | Plot |
|---|---|
| CZT HV Monitor | 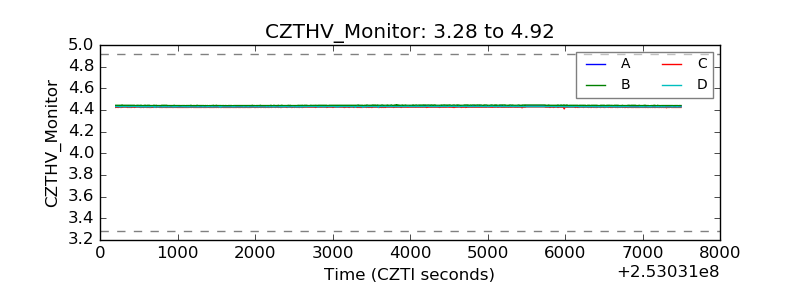 |
| D_VDD | 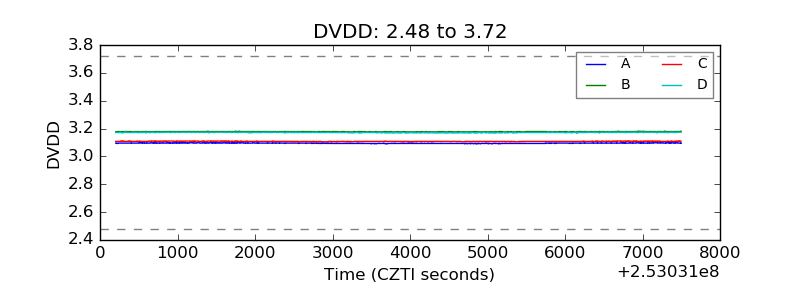 |
| Temperature 1 | 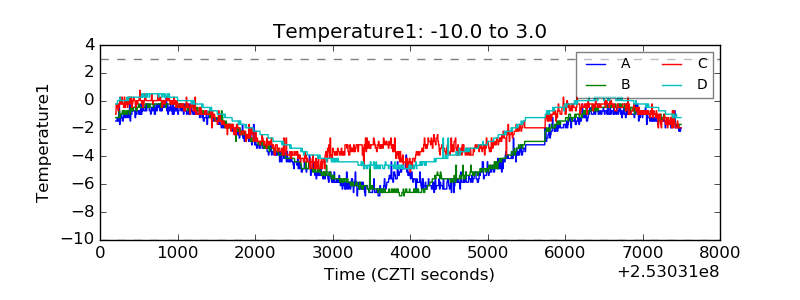 |
| Veto HV Monitor | 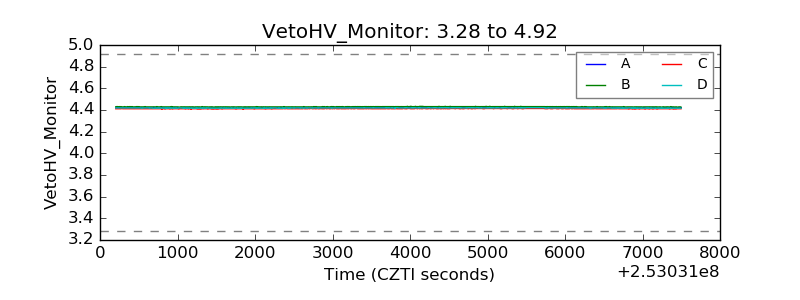 |
| Veto LLD | 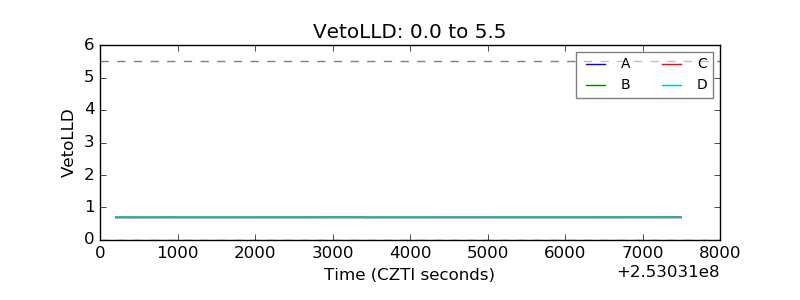 |
| Alpha Counter | 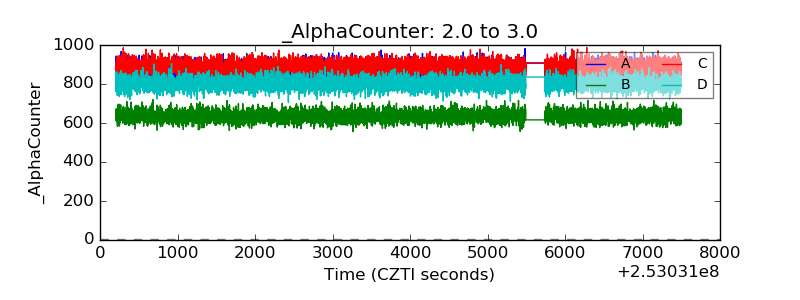 |
| _CPM_Rate | 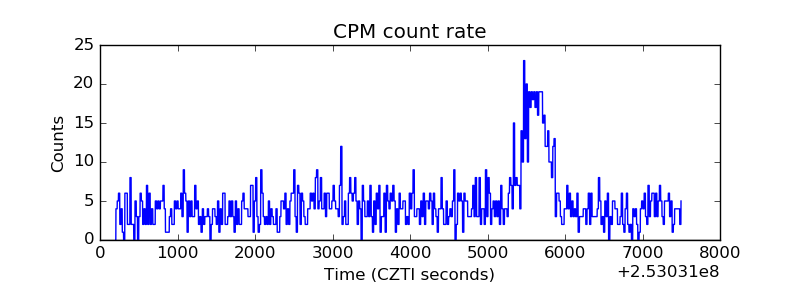 |
| CZT Counter | 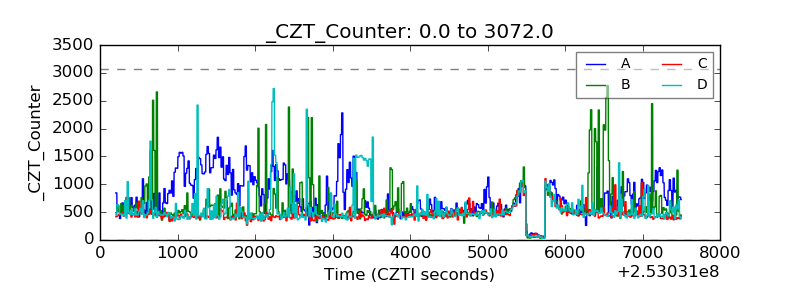 |
| +2.5 Volts monitor | 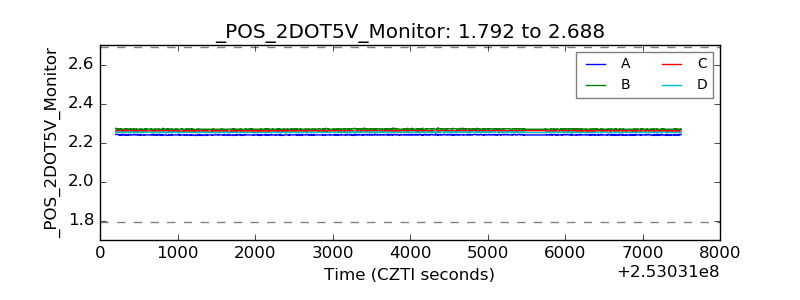 |
| +5 Volts monitor | 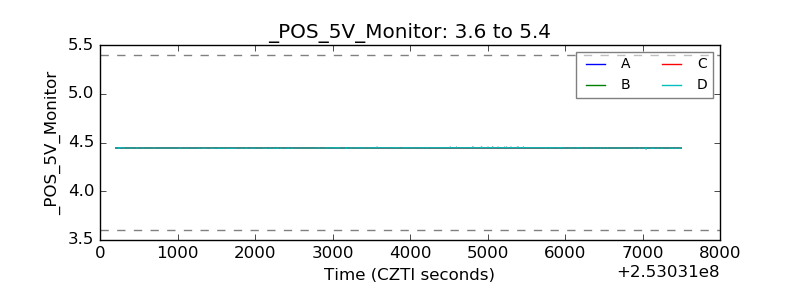 |
| _ROLL_ROT | 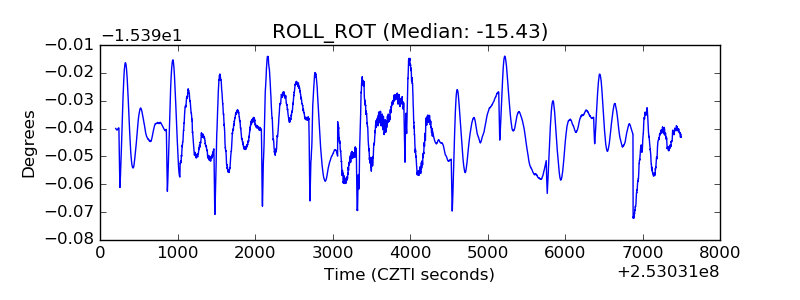 |
| _Roll_DEC | 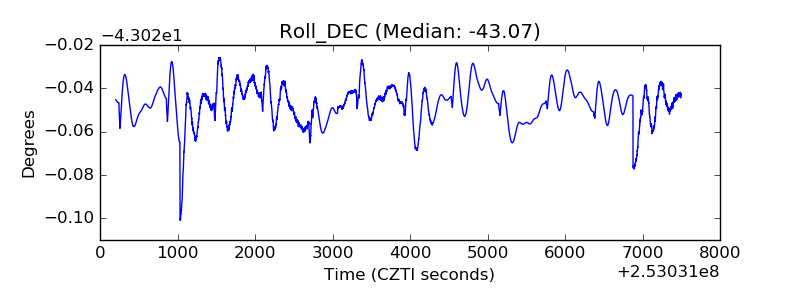 |
| _Roll_RA | 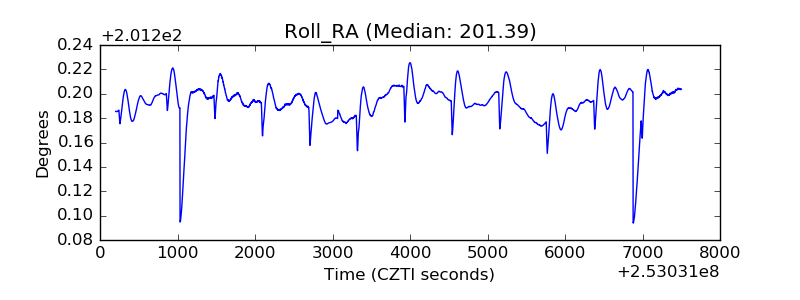 |
| Veto Counter | 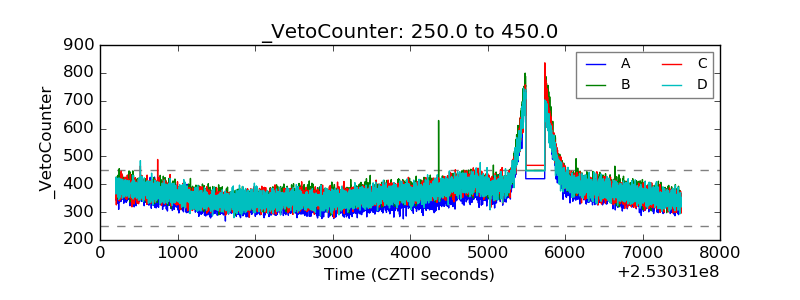 |