| Param | Original file | Final file |
|---|---|---|
| Filename | modeM0/AS1A04_048T01_9000001820_12323cztM0_level2.evt | modeM0/AS1A04_048T01_9000001820_12323cztM0_level2_quad_clean.evt |
| Size (bytes) | 617,201,280 | 81,138,240 |
| Size | 588.6 MB | 77.4 MB |
| Events in quadrant A | 5,222,200 | 481,517 |
| Events in quadrant B | 5,215,767 | 485,048 |
| Events in quadrant C | 3,671,787 | 489,993 |
| Events in quadrant D | 4,064,726 | 469,149 |
| Mode SS | |||
|---|---|---|---|
| Quadrant | BADHDUFLAG | Total packets | Discarded packets |
| A | 0 | 156 | 0 |
| B | 0 | 156 | 0 |
| C | 0 | 156 | 0 |
| D | 0 | 156 | 0 |
| Mode M0 | |||
|---|---|---|---|
| Quadrant | BADHDUFLAG | Total packets | Discarded packets |
| A | 0 | 20740 | 3 |
| B | 0 | 20502 | 2 |
| C | 0 | 16250 | 2 |
| D | 0 | 17304 | 2 |
| Mode M9 | |||
|---|---|---|---|
| Quadrant | BADHDUFLAG | Total packets | Discarded packets |
| A | 0 | 7 | 0 |
| B | 0 | 7 | 0 |
| C | 0 | 7 | 0 |
| D | 0 | 7 | 0 |
| Quadrant | Total seconds | Saturated seconds | Saturation percentage |
|---|---|---|---|
| A | 7637 | 351 | 4.596046% |
| B | 7637 | 780 | 10.213435% |
| C | 7637 | 144 | 1.885557% |
| D | 7637 | 206 | 2.697394% |
Noise dominated data is calculated using 1-second bins in cleaned event files. If a bin has >2000 counts, and if more than 50% of those come from <1% of pixels, then it is considered to be noise-dominated and hence unusable.
| Quadrant | # 1 sec bins | Bins with >0 counts | Bins with >2000 counts | High rate bins dominated by noise | Noise dominated (total time) | Noise dominated (detector-on time) | Marked lightcurve |
|---|---|---|---|---|---|---|---|
| A | 8303 | 7640 | 0 | 0 | 0.00% | 0.00% |  |
| B | 8303 | 7640 | 345 | 345 | 4.16% | 4.52% | 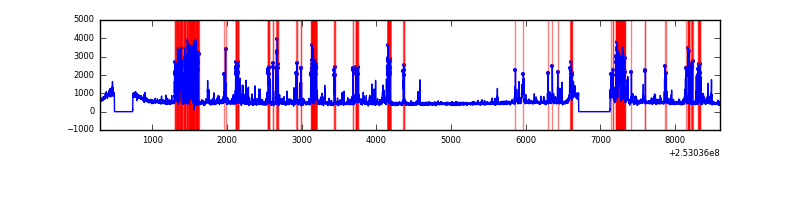 |
| C | 8303 | 7640 | 12 | 12 | 0.14% | 0.16% | 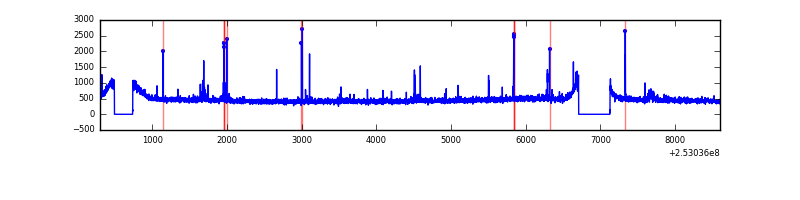 |
| D | 8303 | 7640 | 47 | 47 | 0.57% | 0.62% | 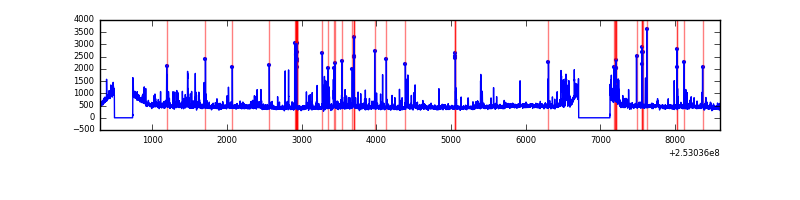 |
Top three noisy pixels from each quadrant. If the there are fewer than three noisy pixels in the level2.evt file, extra rows are filled as -1
| Pixel properties | Quadrant properties | ||||||
|---|---|---|---|---|---|---|---|
| Quadrant | DetID | PixID | Counts | Sigma | Mean | Median | Sigma |
| A | 0 | 23 | 424630 | 2221.44 | 926 | 904 | 190.7 |
| A | 1 | 162 | 314199 | 1642.49 | 926 | 904 | 190.7 |
| A | 15 | 174 | 255791 | 1336.28 | 926 | 904 | 190.7 |
| B | 4 | 239 | 1304156 | 7464.87 | 897 | 872 | 174.6 |
| B | 0 | 85 | 216331 | 1234.09 | 897 | 872 | 174.6 |
| B | 3 | 64 | 56889 | 320.85 | 897 | 872 | 174.6 |
| C | 4 | 254 | 59249 | 276.53 | 904 | 907 | 211.0 |
| C | 0 | 207 | 48568 | 225.91 | 904 | 907 | 211.0 |
| C | 15 | 208 | 24816 | 113.33 | 904 | 907 | 211.0 |
| D | 1 | 52 | 109783 | 494.05 | 905 | 881 | 220.4 |
| D | 13 | 104 | 104311 | 469.23 | 905 | 881 | 220.4 |
| D | 5 | 222 | 70403 | 315.4 | 905 | 881 | 220.4 |
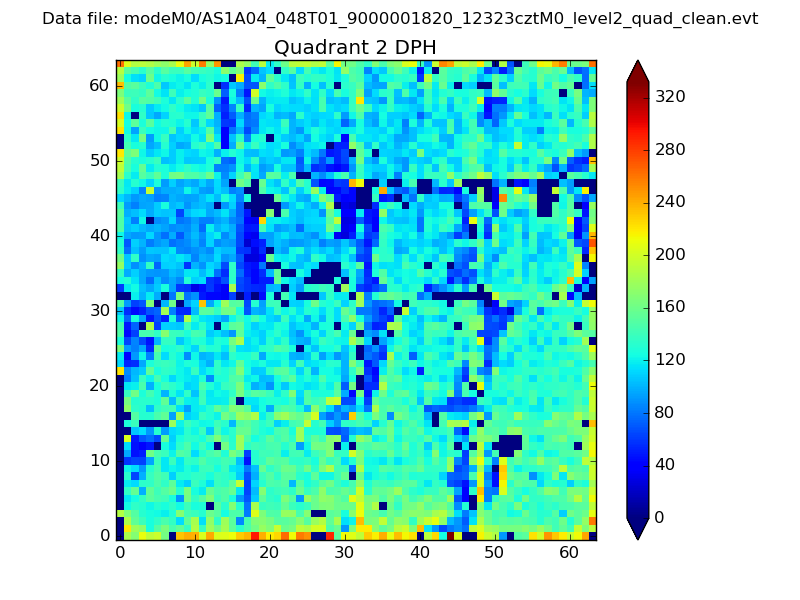
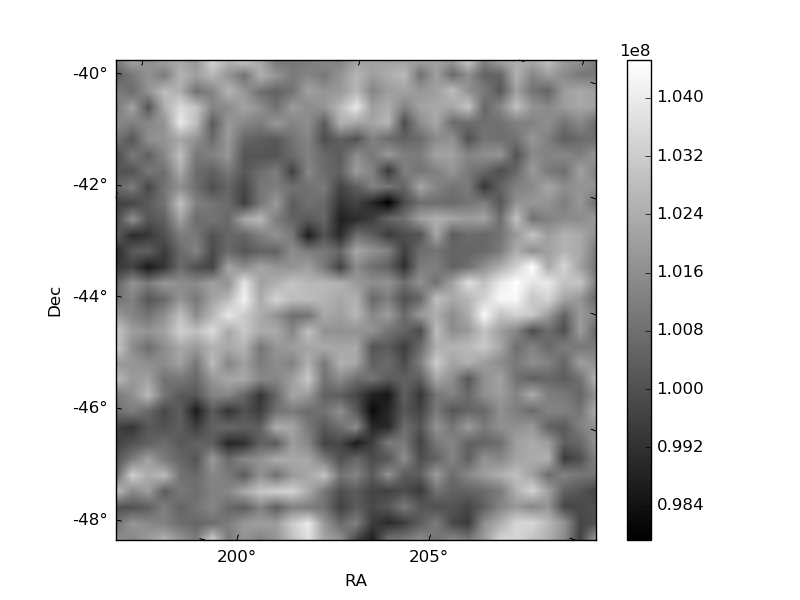
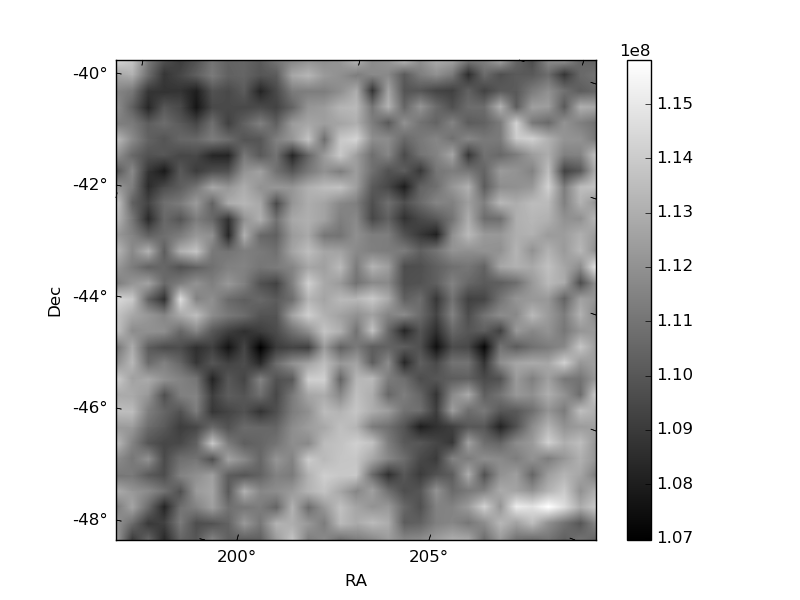
Histogram calculated using DETX and DETY for each event in the final _common_clean file
| Quadrant A | 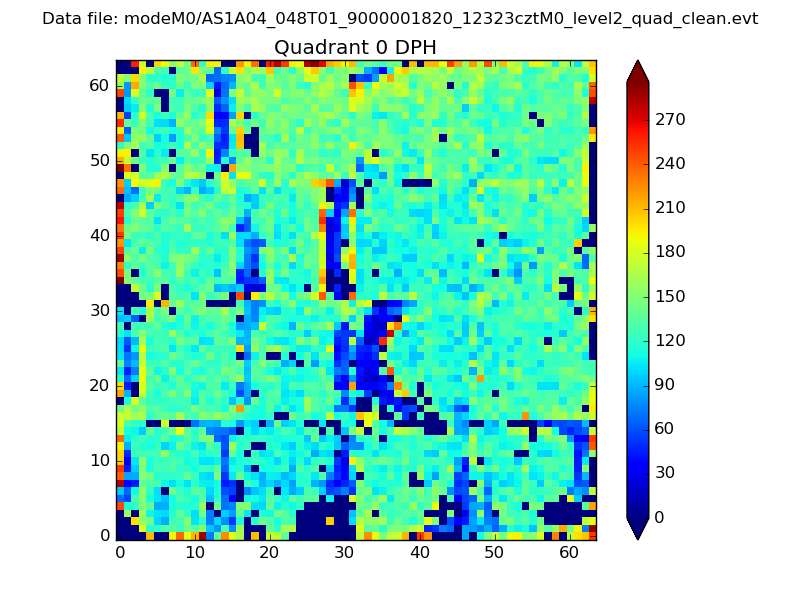 |
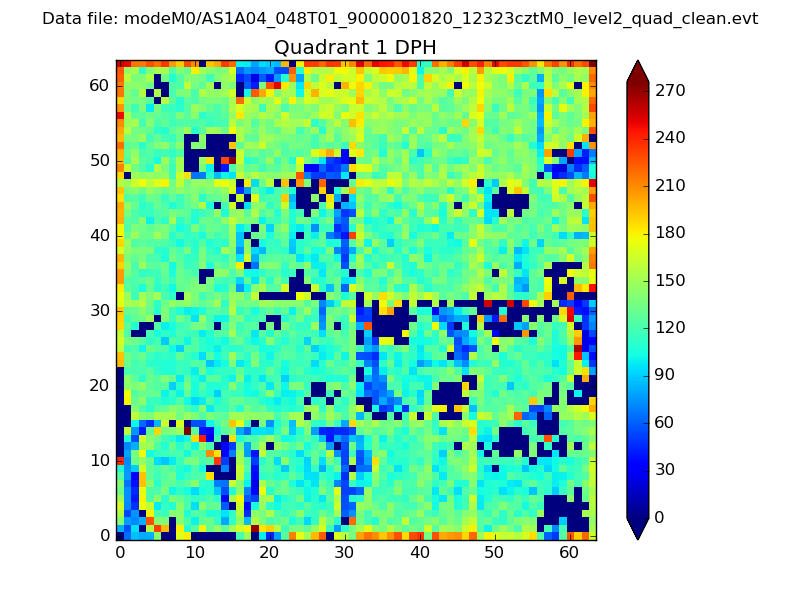 |
Quadrant B |
|---|---|---|---|
| Quadrant D | 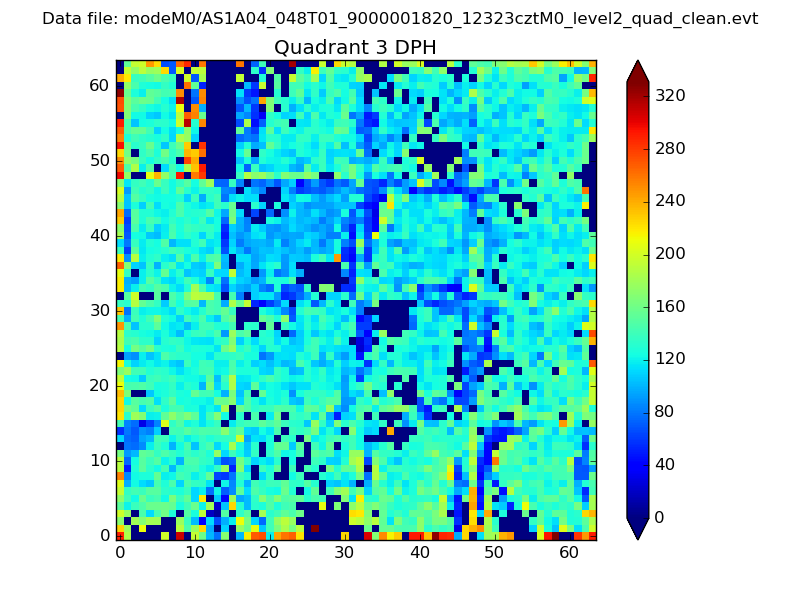 |
 |
Quadrant C |
| Plot type | Count rate plots | Images |
|---|---|---|
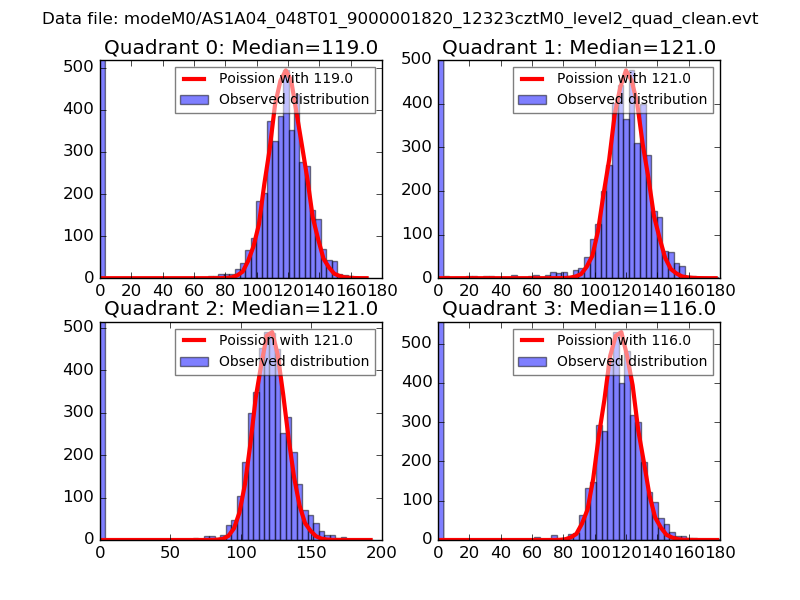
| Comparison with Poisson distribution Blue bars denote a histogram of data divided into 1 sec bins. Red curve is a Poisson curve with rate = median count rate of data. |
 |
 |
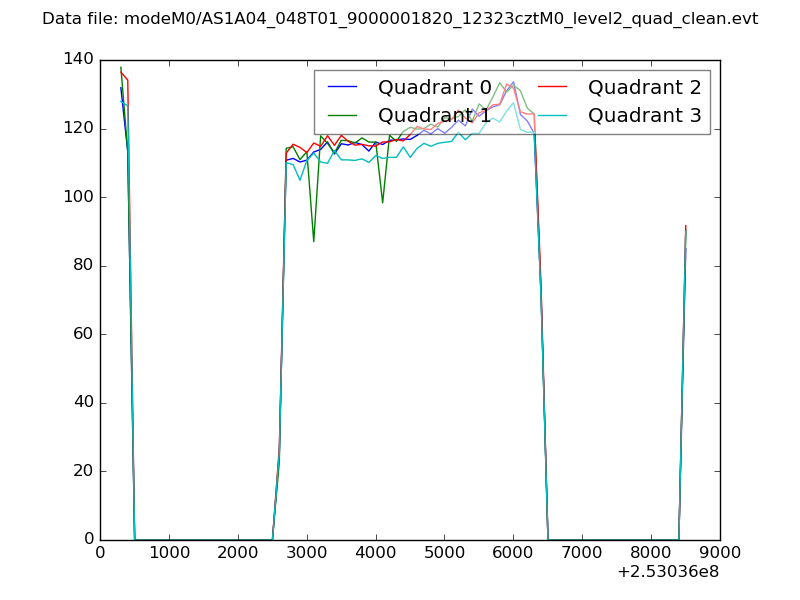
| Quadrant-wise count rates Data is divided into 100 sec bins |
 |
|
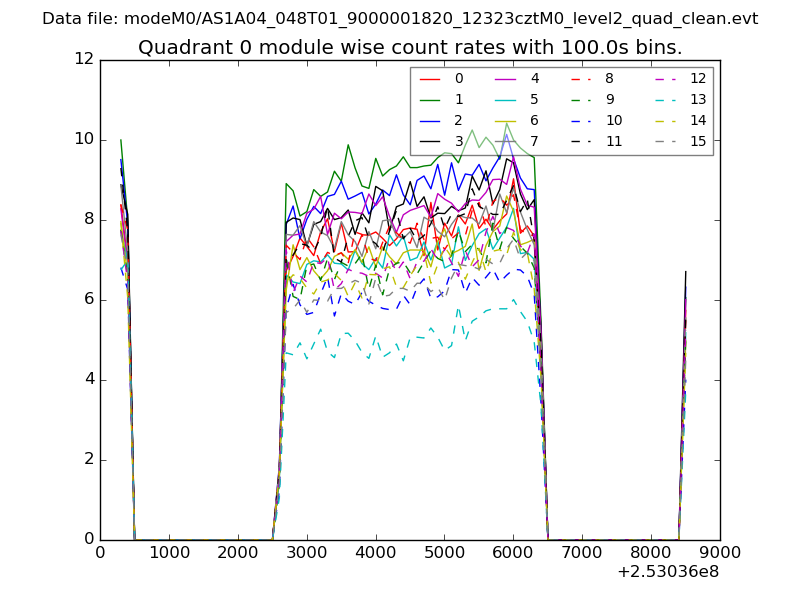
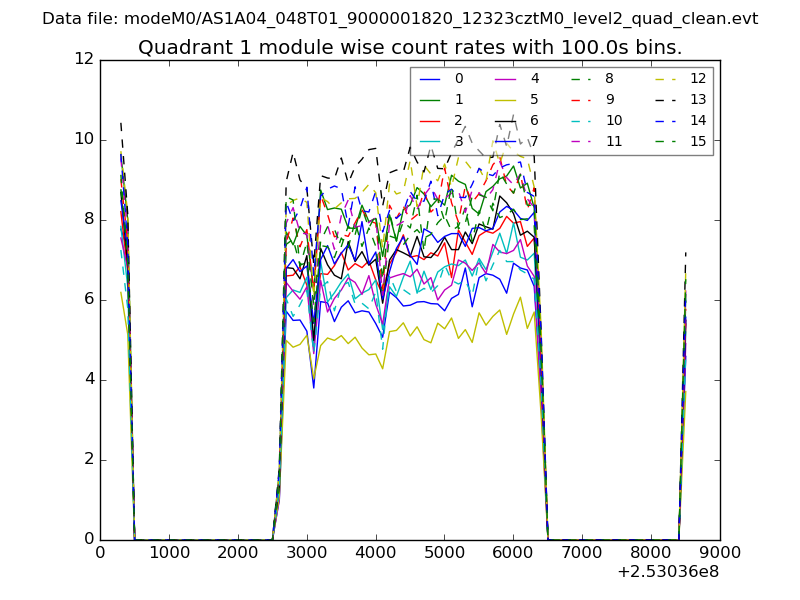
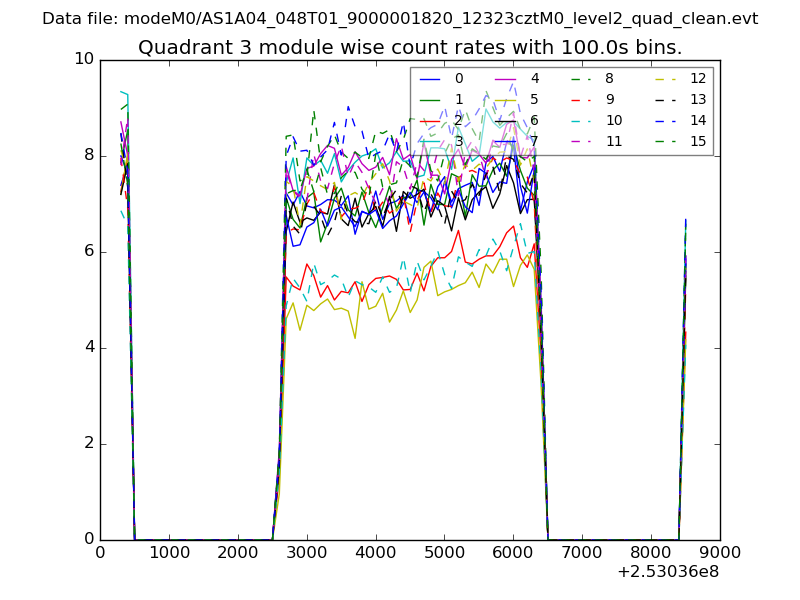
| Module-wise count rates for Quadrant A Data is divided into 100 sec bins |
 |
 |
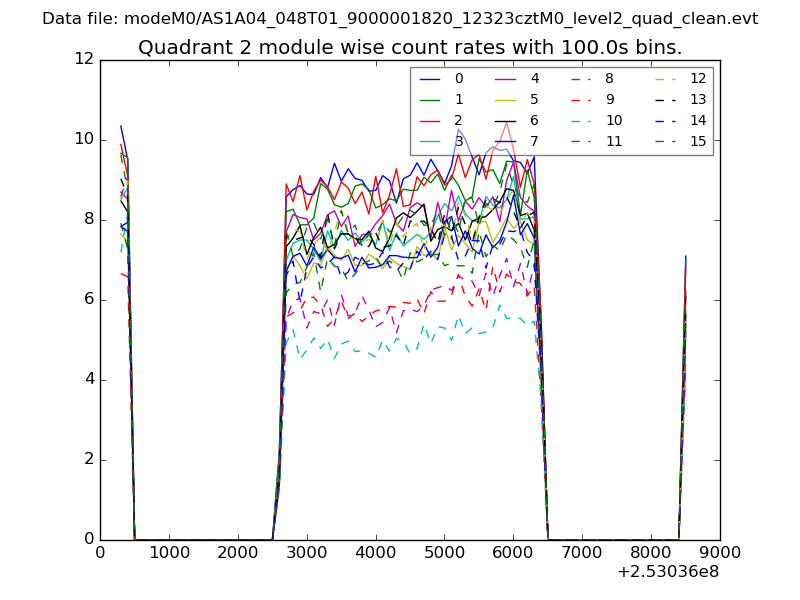
| Module-wise count rates for Quadrant B Data is divided into 100 sec bins |
 |
 |
| Module-wise count rates for Quadrant C Data is divided into 100 sec bins |
 |
 |
| Module-wise count rates for Quadrant D Data is divided into 100 sec bins |
 |
 |
| Parameter | Plot |
|---|---|
| CZT HV Monitor | 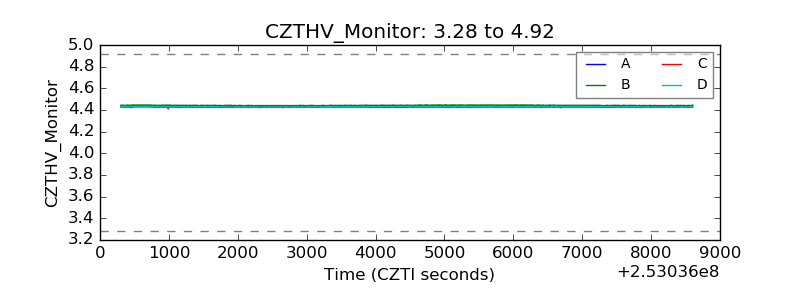 |
| D_VDD | 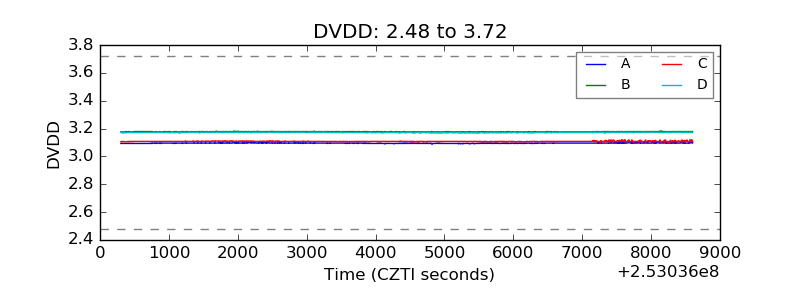 |
| Temperature 1 | 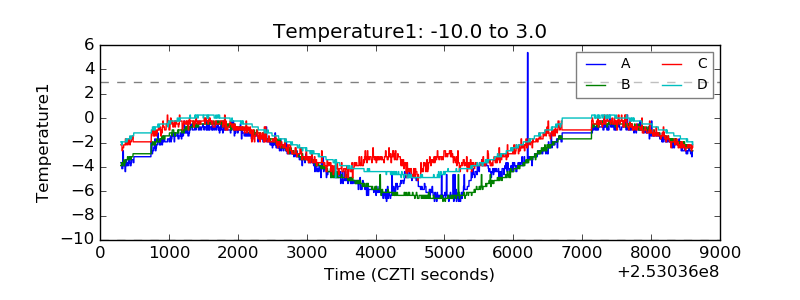 |
| Veto HV Monitor | 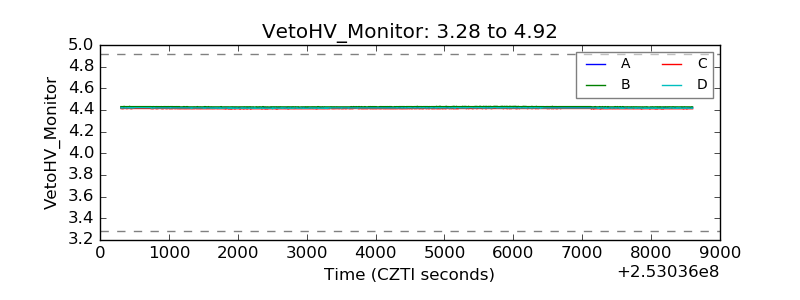 |
| Veto LLD | 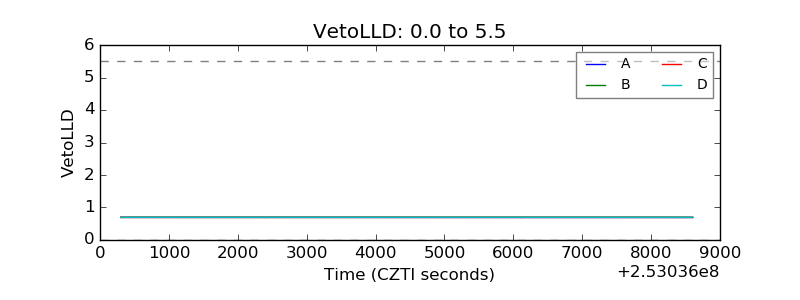 |
| Alpha Counter | 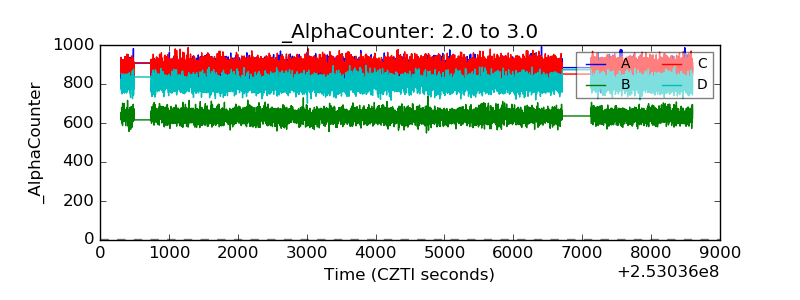 |
| _CPM_Rate | 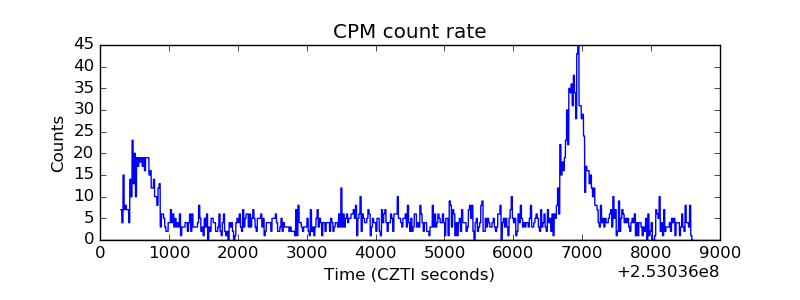 |
| CZT Counter | 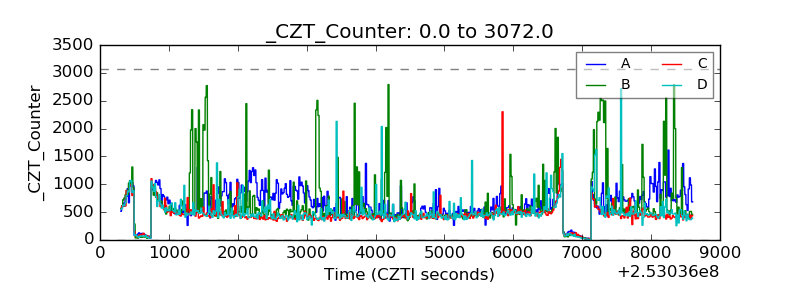 |
| +2.5 Volts monitor |  |
| +5 Volts monitor |  |
| _ROLL_ROT | 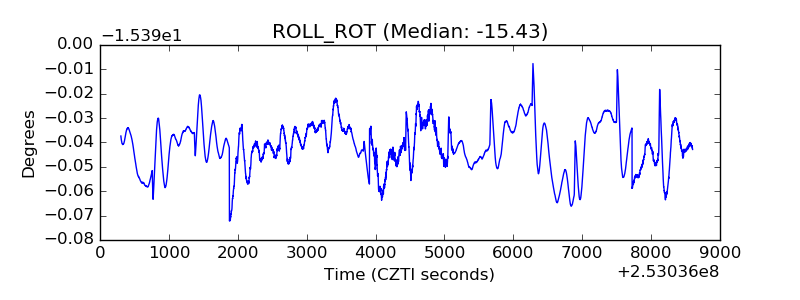 |
| _Roll_DEC | 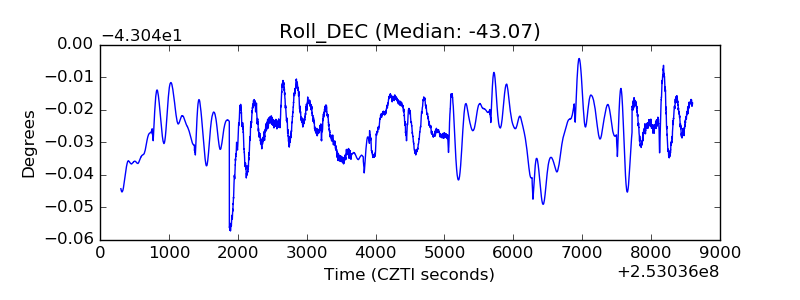 |
| _Roll_RA | 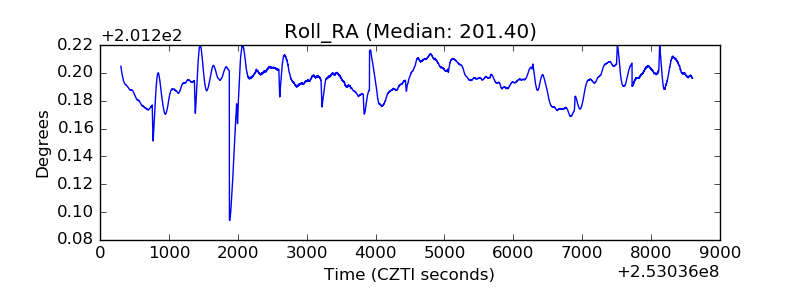 |
| Veto Counter | 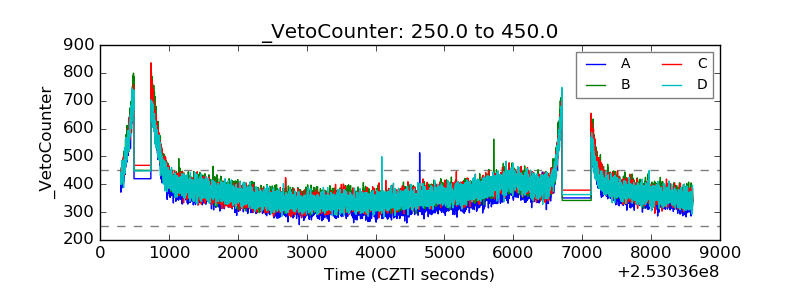 |