| Param | Original file | Final file |
|---|---|---|
| Filename | modeM0/AS1A04_048T01_9000001820_12325cztM0_level2.evt | modeM0/AS1A04_048T01_9000001820_12325cztM0_level2_quad_clean.evt |
| Size (bytes) | 1,011,142,080 | 162,970,560 |
| Size | 964.3 MB | 155.4 MB |
| Events in quadrant A | 8,177,699 | 1,014,189 |
| Events in quadrant B | 8,417,922 | 1,016,929 |
| Events in quadrant C | 6,038,092 | 1,023,179 |
| Events in quadrant D | 7,102,002 | 975,575 |
| Mode SS | |||
|---|---|---|---|
| Quadrant | BADHDUFLAG | Total packets | Discarded packets |
| A | 0 | 268 | 0 |
| B | 0 | 268 | 0 |
| C | 0 | 268 | 0 |
| D | 0 | 268 | 0 |
| Mode M0 | |||
|---|---|---|---|
| Quadrant | BADHDUFLAG | Total packets | Discarded packets |
| A | 0 | 33303 | 4 |
| B | 0 | 33701 | 3 |
| C | 0 | 27088 | 3 |
| D | 0 | 30282 | 3 |
| Mode M9 | |||
|---|---|---|---|
| Quadrant | BADHDUFLAG | Total packets | Discarded packets |
| A | 0 | 17 | 0 |
| B | 0 | 17 | 0 |
| C | 0 | 17 | 0 |
| D | 0 | 17 | 0 |
| Quadrant | Total seconds | Saturated seconds | Saturation percentage |
|---|---|---|---|
| A | 13112 | 465 | 3.546370% |
| B | 13112 | 1084 | 8.267236% |
| C | 13112 | 109 | 0.831300% |
| D | 13112 | 269 | 2.051556% |
Noise dominated data is calculated using 1-second bins in cleaned event files. If a bin has >2000 counts, and if more than 50% of those come from <1% of pixels, then it is considered to be noise-dominated and hence unusable.
| Quadrant | # 1 sec bins | Bins with >0 counts | Bins with >2000 counts | High rate bins dominated by noise | Noise dominated (total time) | Noise dominated (detector-on time) | Marked lightcurve |
|---|---|---|---|---|---|---|---|
| A | 14783 | 13116 | 57 | 57 | 0.39% | 0.43% | 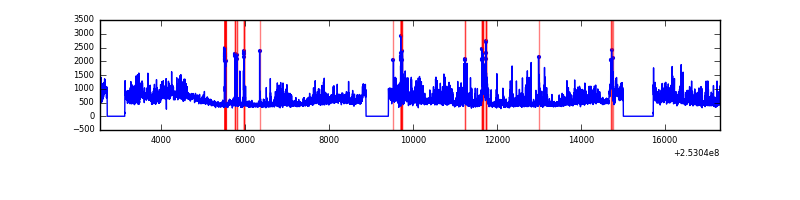 |
| B | 14783 | 13116 | 415 | 415 | 2.81% | 3.16% | 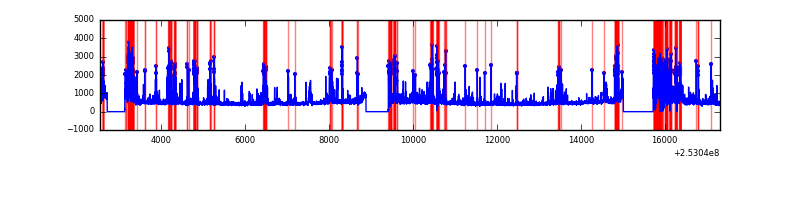 |
| C | 14783 | 13116 | 14 | 14 | 0.09% | 0.11% | 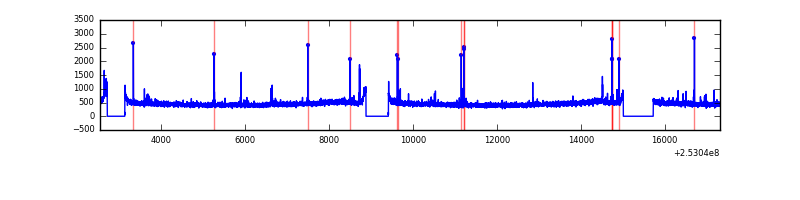 |
| D | 14783 | 13116 | 133 | 133 | 0.90% | 1.01% | 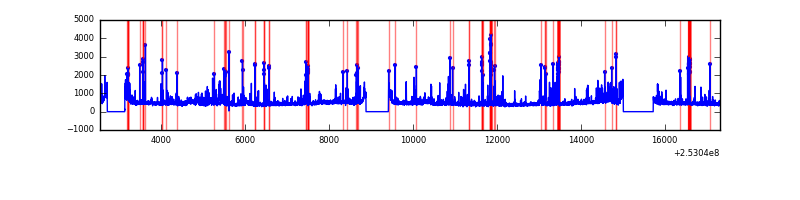 |
Top three noisy pixels from each quadrant. If the there are fewer than three noisy pixels in the level2.evt file, extra rows are filled as -1
| Pixel properties | Quadrant properties | ||||||
|---|---|---|---|---|---|---|---|
| Quadrant | DetID | PixID | Counts | Sigma | Mean | Median | Sigma |
| A | 1 | 162 | 416972 | 1327.94 | 1538 | 1503 | 312.9 |
| A | 0 | 23 | 321846 | 1023.89 | 1538 | 1503 | 312.9 |
| A | 13 | 248 | 283460 | 901.2 | 1538 | 1503 | 312.9 |
| B | 4 | 239 | 1937893 | 6887.77 | 1481 | 1446 | 281.1 |
| B | 3 | 64 | 205250 | 724.91 | 1481 | 1446 | 281.1 |
| B | 0 | 85 | 190902 | 673.88 | 1481 | 1446 | 281.1 |
| C | 15 | 208 | 65970 | 184.67 | 1502 | 1511 | 349.0 |
| C | 0 | 207 | 46521 | 128.95 | 1502 | 1511 | 349.0 |
| C | 4 | 254 | 28300 | 76.75 | 1502 | 1511 | 349.0 |
| D | 1 | 52 | 613242 | 1704.53 | 1491 | 1447 | 358.9 |
| D | 10 | 199 | 188781 | 521.93 | 1491 | 1447 | 358.9 |
| D | 5 | 222 | 105667 | 290.37 | 1491 | 1447 | 358.9 |
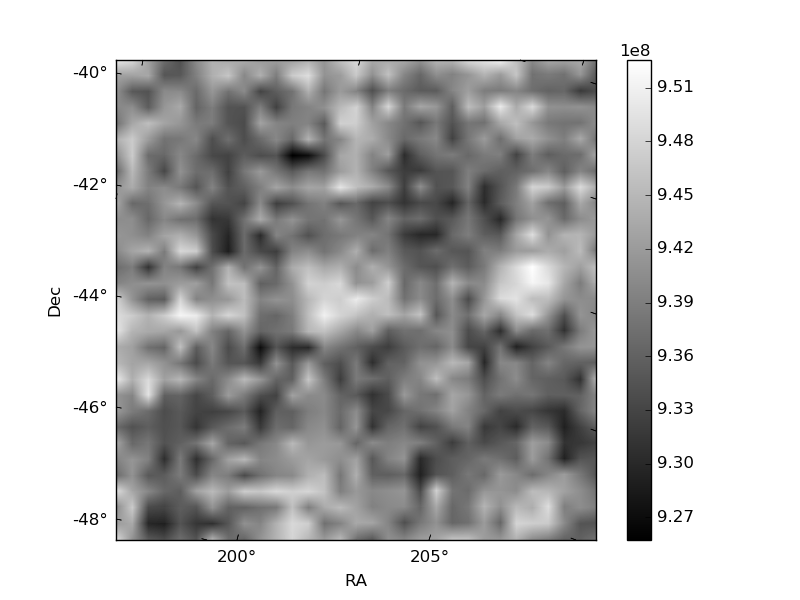
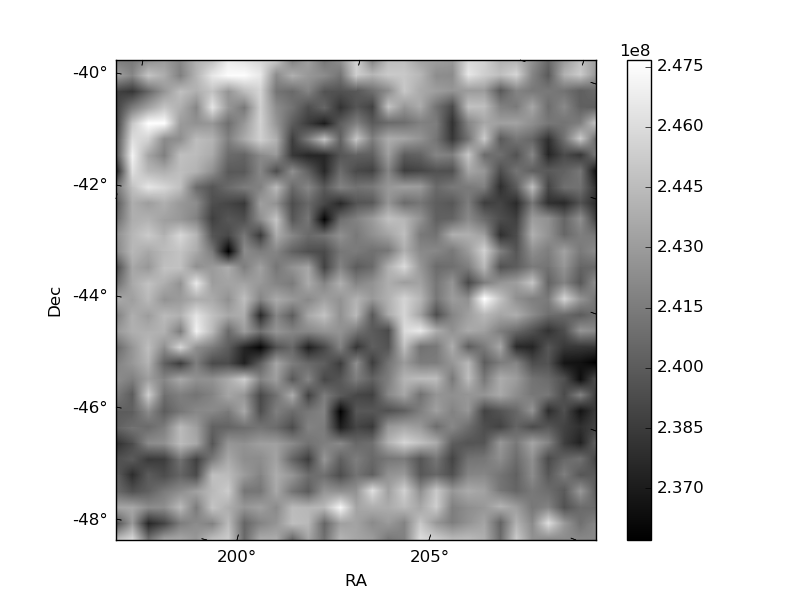
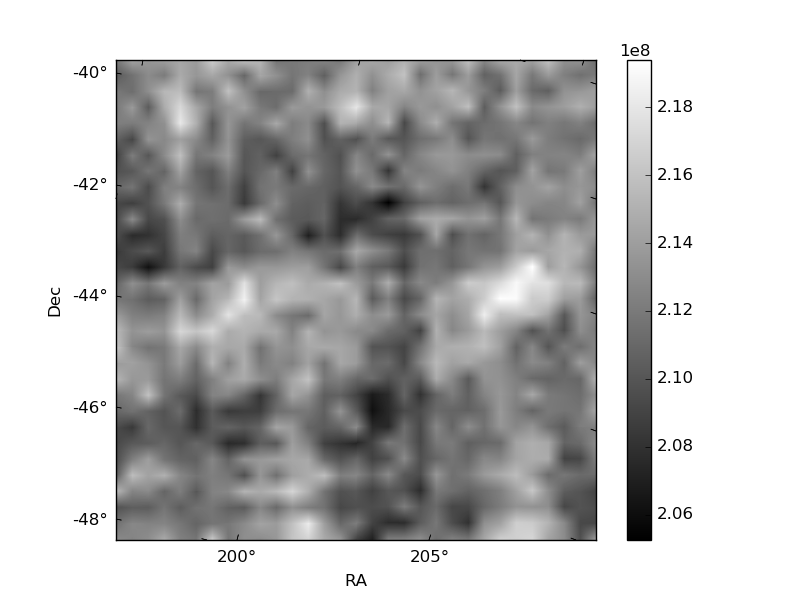
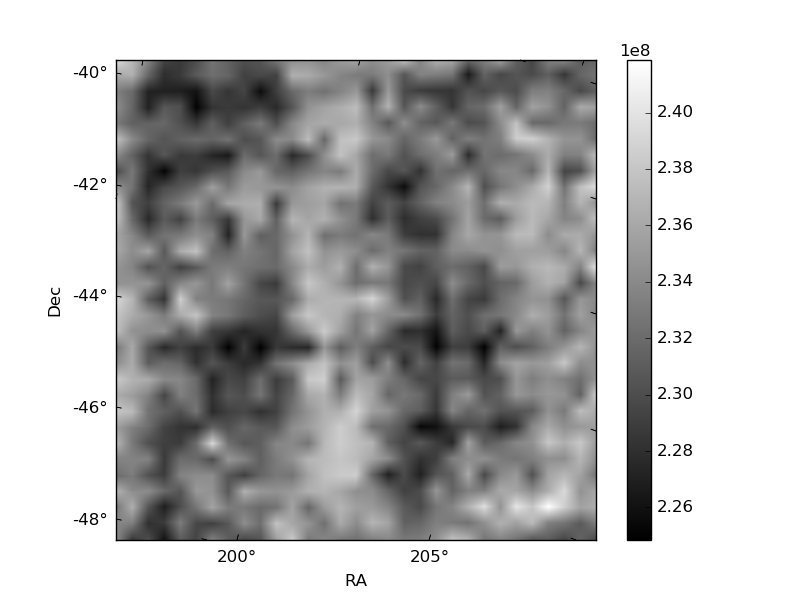
Histogram calculated using DETX and DETY for each event in the final _common_clean file
| Quadrant A | 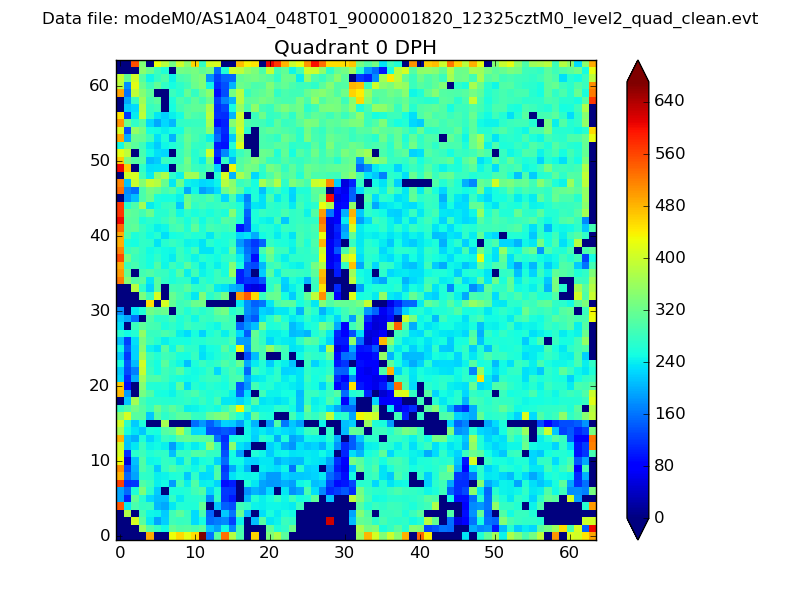 |
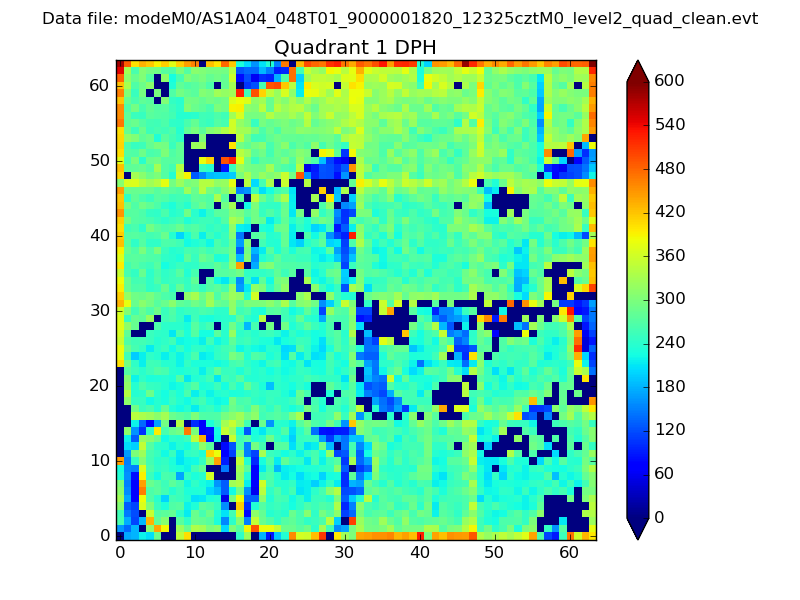 |
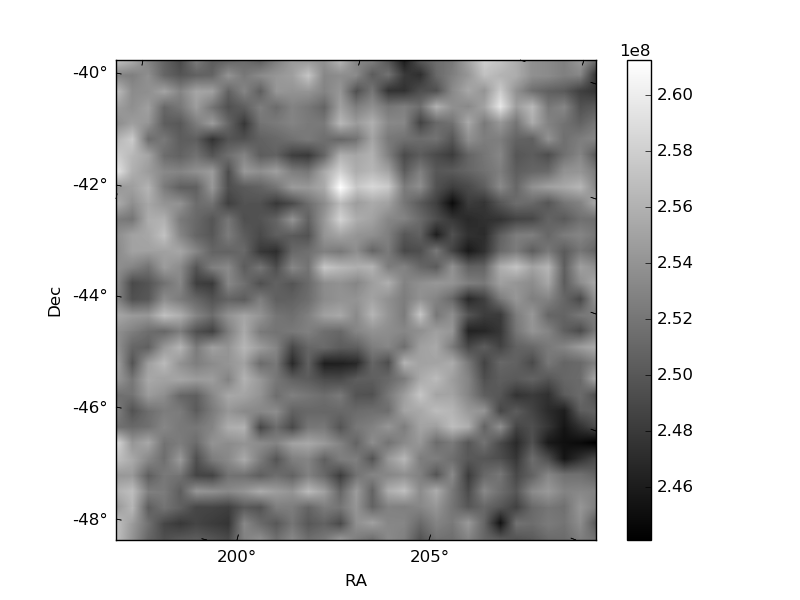
Quadrant B |
|---|---|---|---|
| Quadrant D | 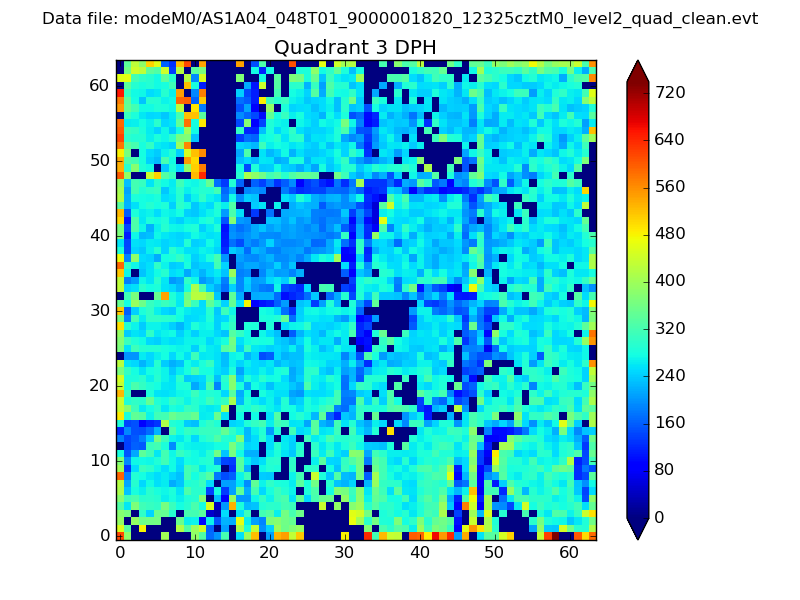 |
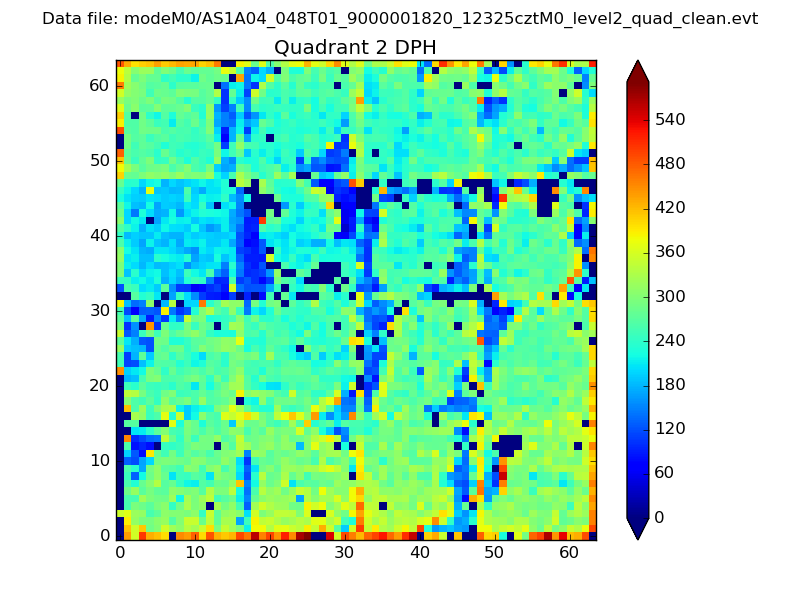 |
Quadrant C |
| Plot type | Count rate plots | Images |
|---|---|---|
| Comparison with Poisson distribution Blue bars denote a histogram of data divided into 1 sec bins. Red curve is a Poisson curve with rate = median count rate of data. |
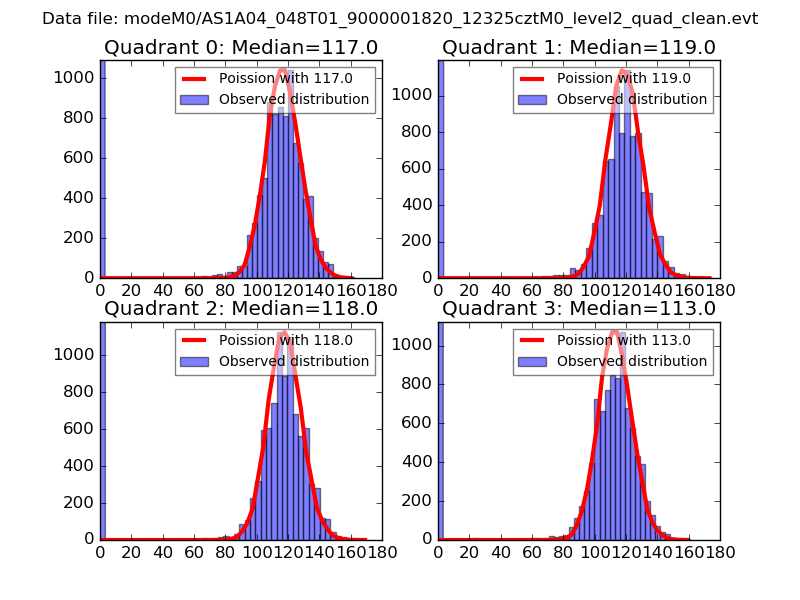 |
 |
| Quadrant-wise count rates Data is divided into 100 sec bins |
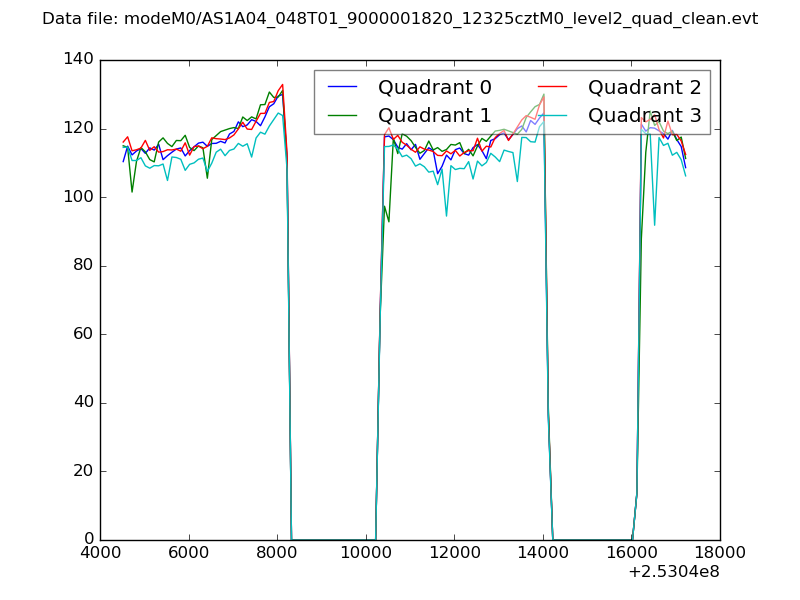 |
|
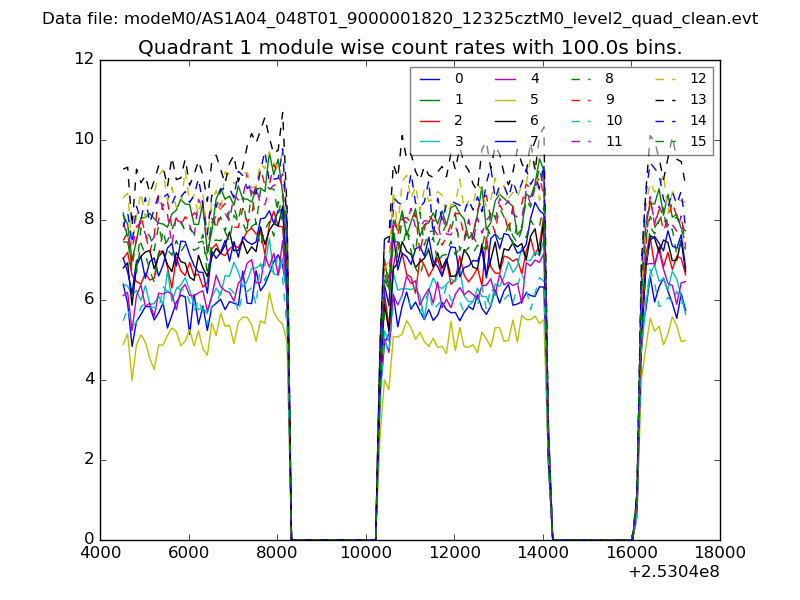
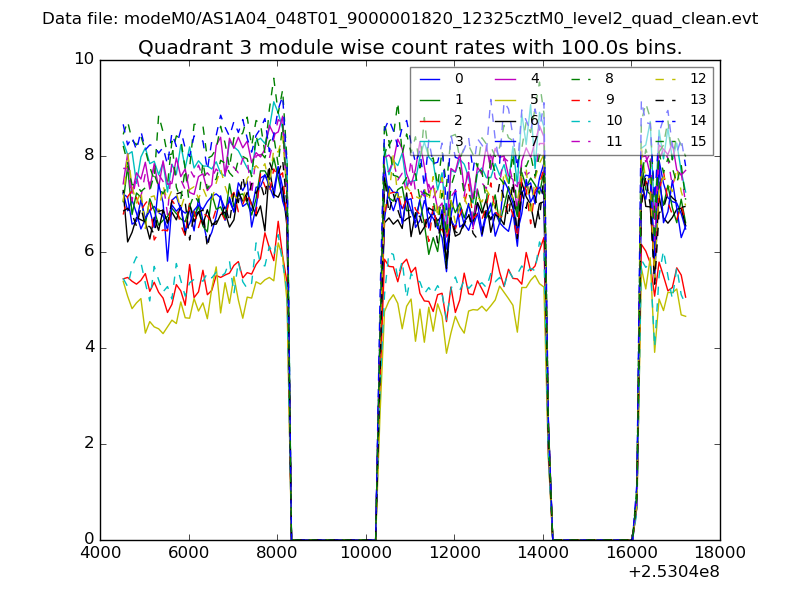
| Module-wise count rates for Quadrant A Data is divided into 100 sec bins |
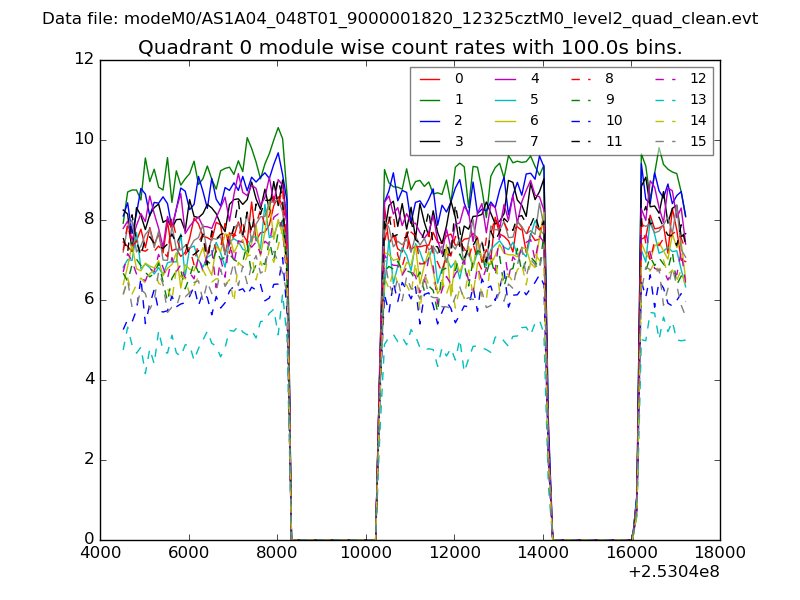 |
 |
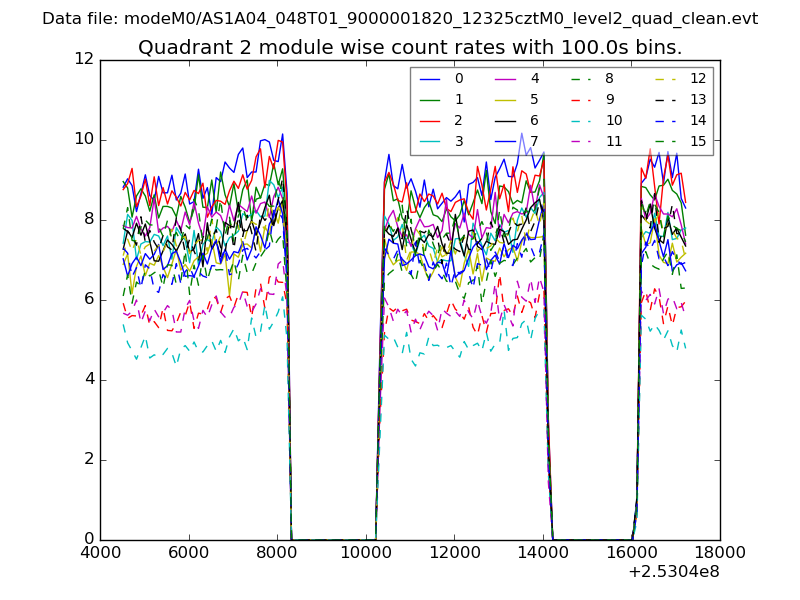
| Module-wise count rates for Quadrant B Data is divided into 100 sec bins |
 |
 |
| Module-wise count rates for Quadrant C Data is divided into 100 sec bins |
 |
 |
| Module-wise count rates for Quadrant D Data is divided into 100 sec bins |
 |
 |
| Parameter | Plot |
|---|---|
| CZT HV Monitor | 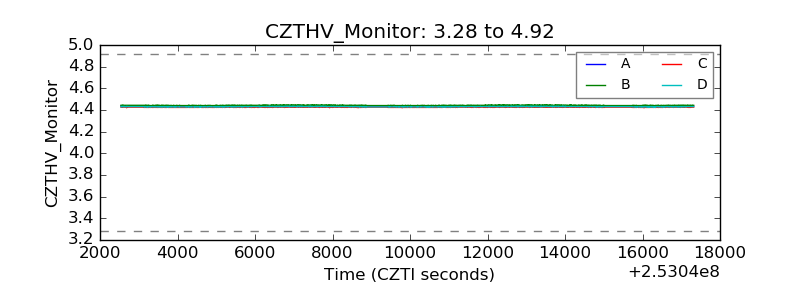 |
| D_VDD | 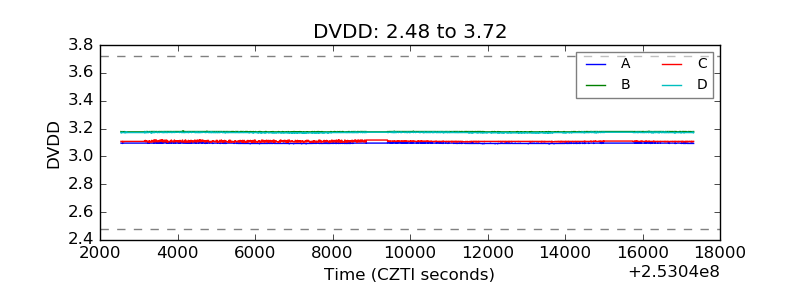 |
| Temperature 1 | 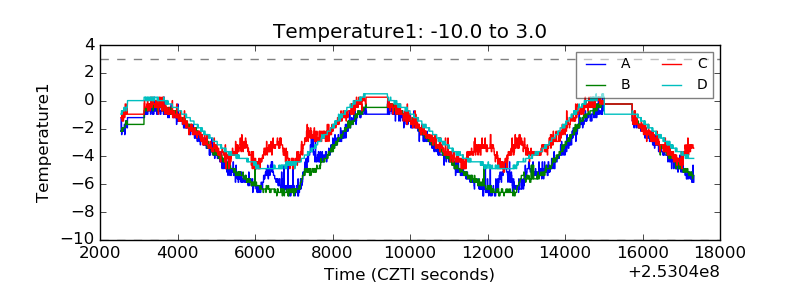 |
| Veto HV Monitor | 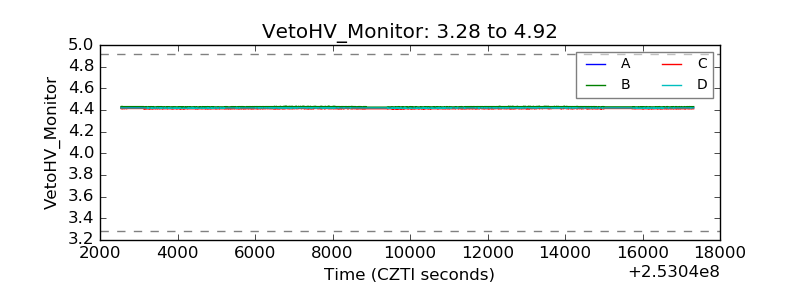 |
| Veto LLD | 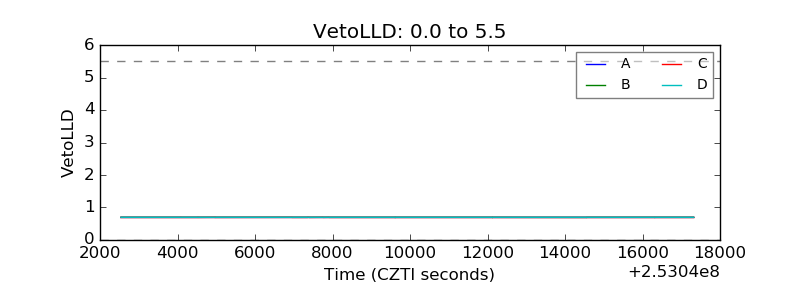 |
| Alpha Counter | 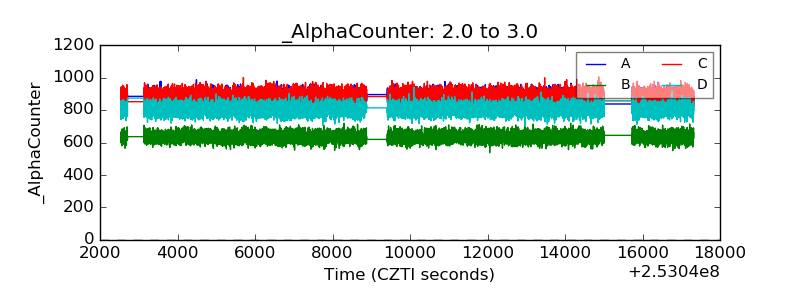 |
| _CPM_Rate | 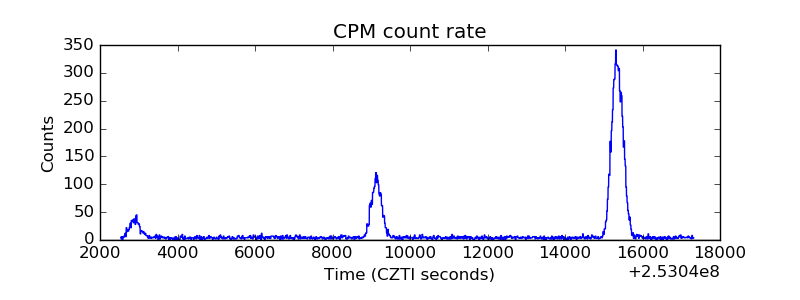 |
| CZT Counter | 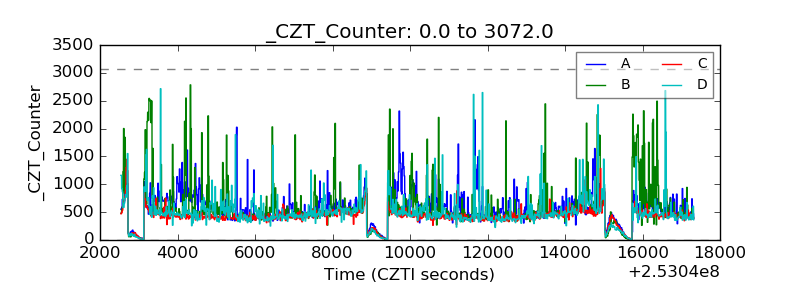 |
| +2.5 Volts monitor | 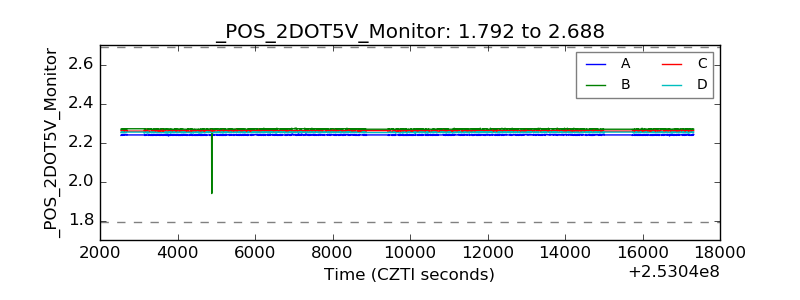 |
| +5 Volts monitor | 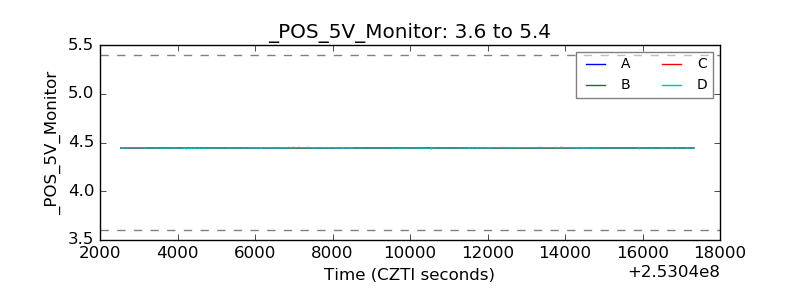 |
| _ROLL_ROT | 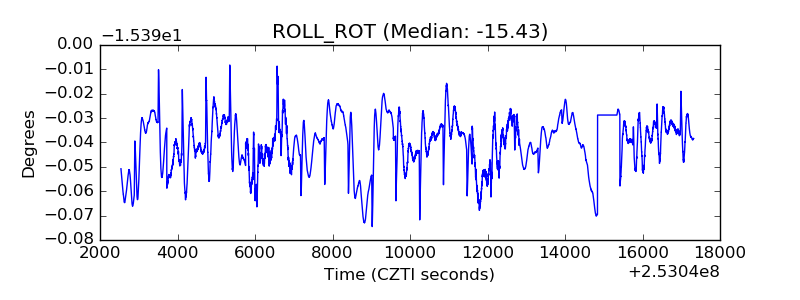 |
| _Roll_DEC | 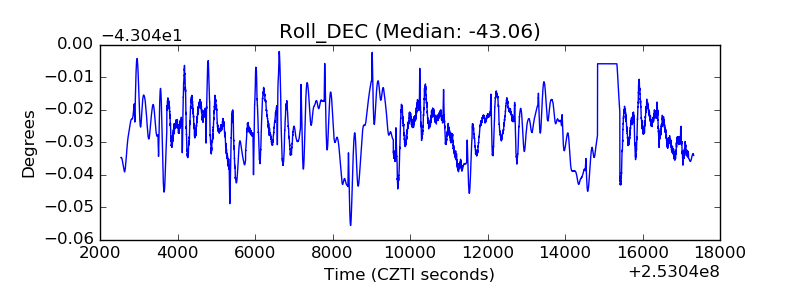 |
| _Roll_RA | 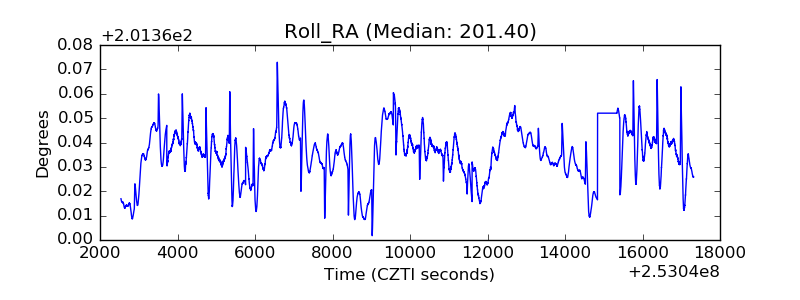 |
| Veto Counter | 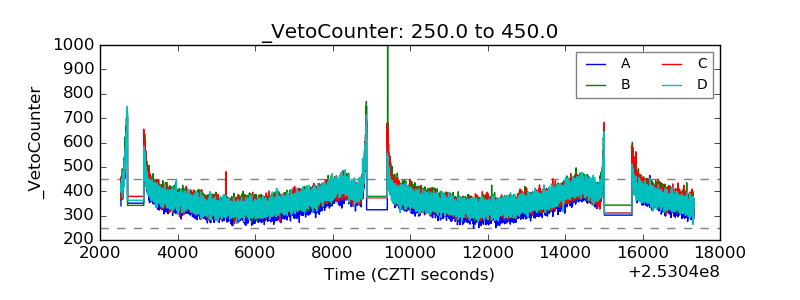 |