| Param | Original file | Final file |
|---|---|---|
| Filename | modeM0/AS1A04_048T01_9000001820_12331cztM0_level2.evt | modeM0/AS1A04_048T01_9000001820_12331cztM0_level2_quad_clean.evt |
| Size (bytes) | 478,339,200 | 79,583,040 |
| Size | 456.2 MB | 75.9 MB |
| Events in quadrant A | 3,242,474 | 508,819 |
| Events in quadrant B | 4,290,848 | 484,239 |
| Events in quadrant C | 3,313,640 | 524,262 |
| Events in quadrant D | 3,254,034 | 495,335 |
| Mode SS | |||
|---|---|---|---|
| Quadrant | BADHDUFLAG | Total packets | Discarded packets |
| A | 0 | 118 | 0 |
| B | 0 | 118 | 0 |
| C | 0 | 118 | 0 |
| D | 0 | 118 | 0 |
| Mode M0 | |||
|---|---|---|---|
| Quadrant | BADHDUFLAG | Total packets | Discarded packets |
| A | 0 | 13261 | 4 |
| B | 0 | 16270 | 2 |
| C | 0 | 13343 | 2 |
| D | 0 | 13312 | 2 |
| Mode M9 | |||
|---|---|---|---|
| Quadrant | BADHDUFLAG | Total packets | Discarded packets |
| A | 0 | 12 | 0 |
| B | 0 | 12 | 0 |
| C | 0 | 12 | 0 |
| D | 0 | 12 | 0 |
| Quadrant | Total seconds | Saturated seconds | Saturation percentage |
|---|---|---|---|
| A | 5668 | 66 | 1.164432% |
| B | 5668 | 712 | 12.561750% |
| C | 5668 | 166 | 2.928723% |
| D | 5668 | 127 | 2.240649% |
Noise dominated data is calculated using 1-second bins in cleaned event files. If a bin has >2000 counts, and if more than 50% of those come from <1% of pixels, then it is considered to be noise-dominated and hence unusable.
| Quadrant | # 1 sec bins | Bins with >0 counts | Bins with >2000 counts | High rate bins dominated by noise | Noise dominated (total time) | Noise dominated (detector-on time) | Marked lightcurve |
|---|---|---|---|---|---|---|---|
| A | 6960 | 5672 | 1 | 1 | 0.01% | 0.02% | 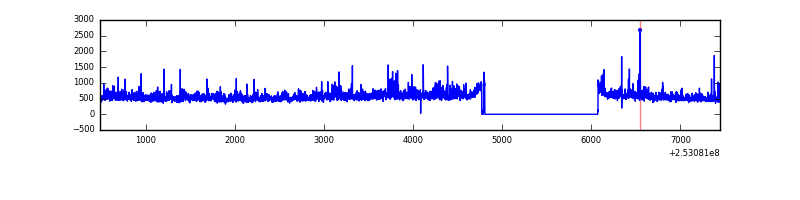 |
| B | 6960 | 5672 | 505 | 505 | 7.26% | 8.90% | 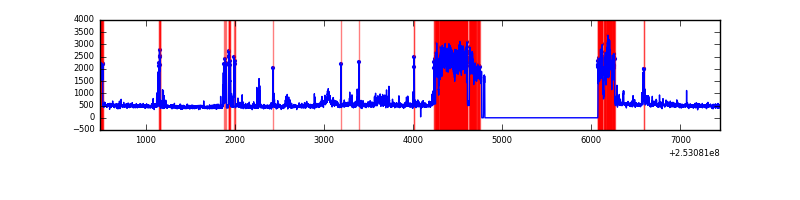 |
| C | 6960 | 5672 | 108 | 108 | 1.55% | 1.90% | 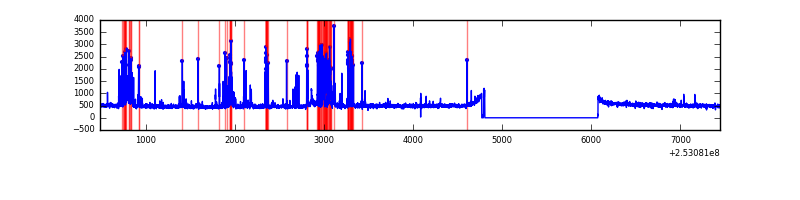 |
| D | 6960 | 5672 | 76 | 76 | 1.09% | 1.34% | 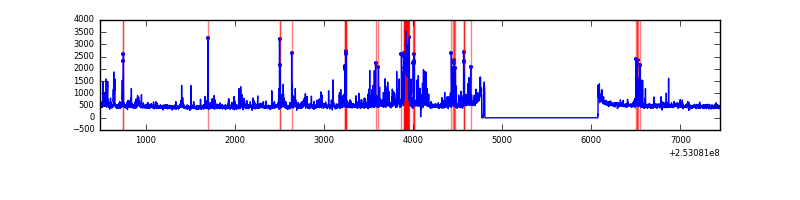 |
Top three noisy pixels from each quadrant. If the there are fewer than three noisy pixels in the level2.evt file, extra rows are filled as -1
| Pixel properties | Quadrant properties | ||||||
|---|---|---|---|---|---|---|---|
| Quadrant | DetID | PixID | Counts | Sigma | Mean | Median | Sigma |
| A | 1 | 162 | 155200 | 1089.31 | 703 | 690 | 141.8 |
| A | 13 | 251 | 146492 | 1027.92 | 703 | 690 | 141.8 |
| A | 1 | 178 | 82590 | 577.4 | 703 | 690 | 141.8 |
| B | 0 | 85 | 1400909 | 11442.76 | 658 | 645 | 122.4 |
| B | 4 | 239 | 234122 | 1907.94 | 658 | 645 | 122.4 |
| B | 3 | 64 | 20008 | 158.23 | 658 | 645 | 122.4 |
| C | 4 | 254 | 324323 | 2011.41 | 698 | 702 | 160.9 |
| C | 15 | 208 | 255179 | 1581.66 | 698 | 702 | 160.9 |
| C | 13 | 61 | 5079 | 27.2 | 698 | 702 | 160.9 |
| D | 14 | 34 | 218636 | 1316.51 | 692 | 673 | 165.6 |
| D | 1 | 52 | 90577 | 543.03 | 692 | 673 | 165.6 |
| D | 10 | 253 | 83896 | 502.67 | 692 | 673 | 165.6 |
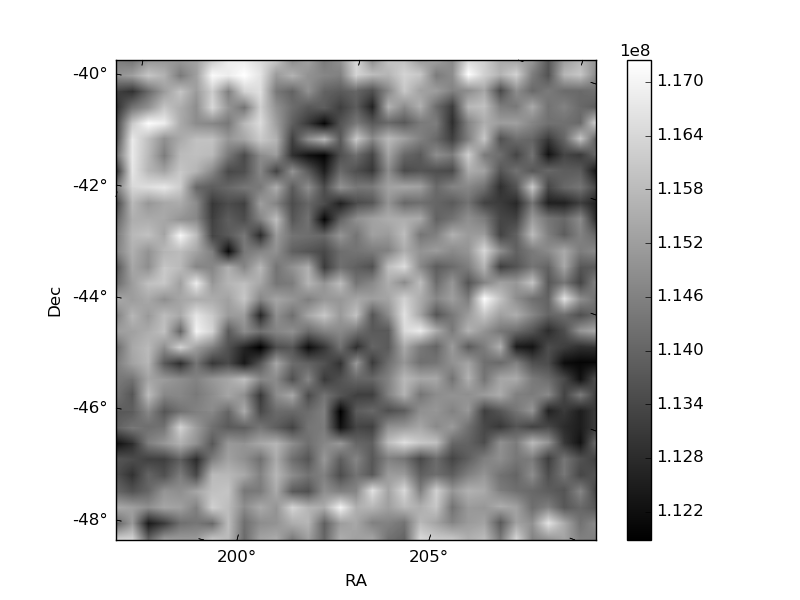
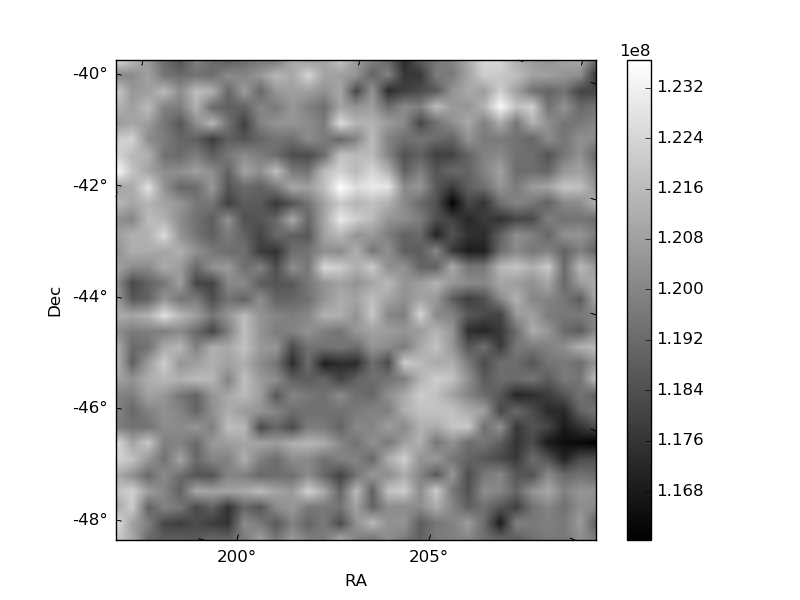
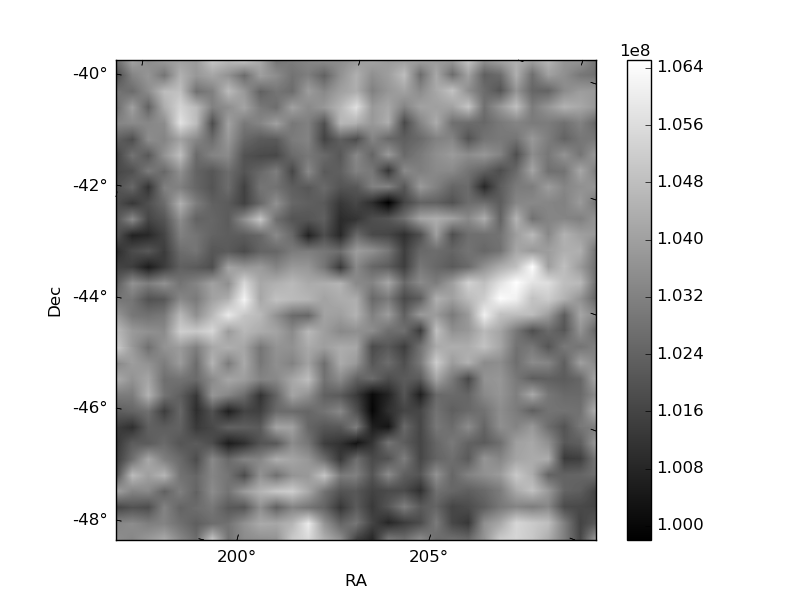
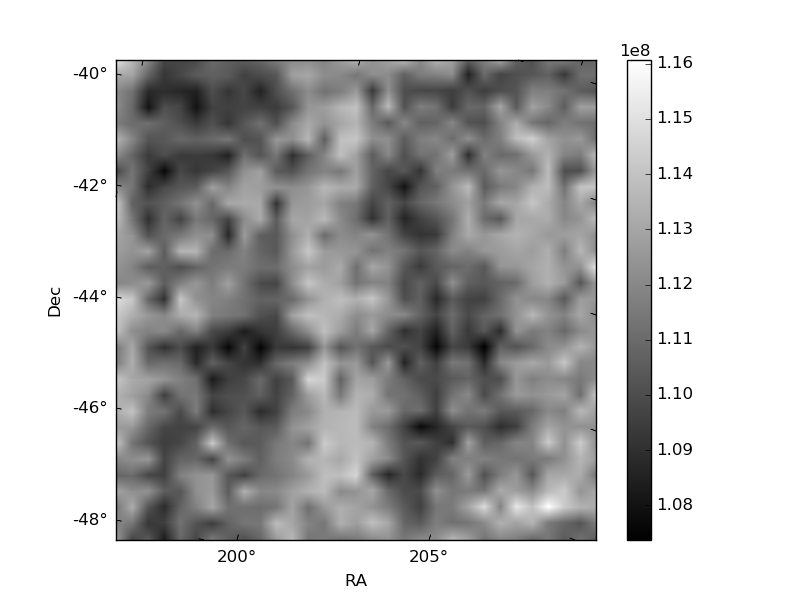
Histogram calculated using DETX and DETY for each event in the final _common_clean file
| Quadrant A | 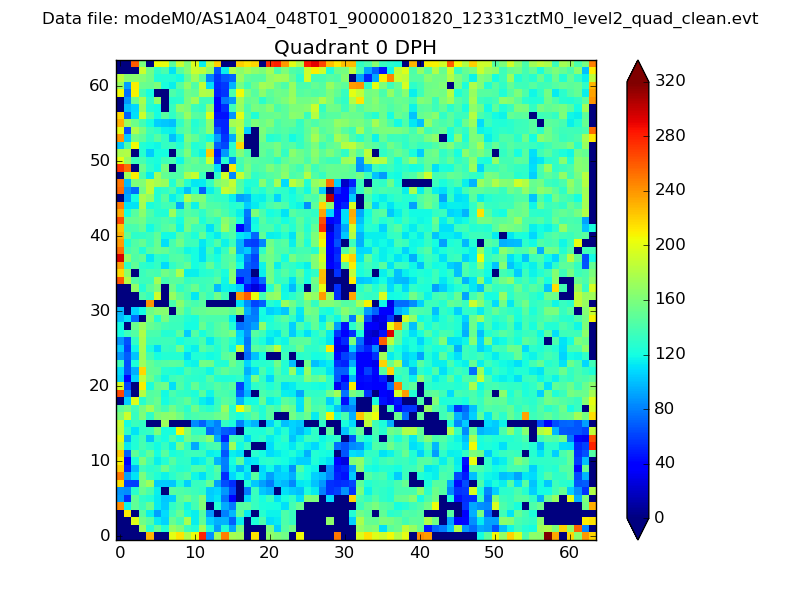 |
 |
Quadrant B |
|---|---|---|---|
| Quadrant D |  |
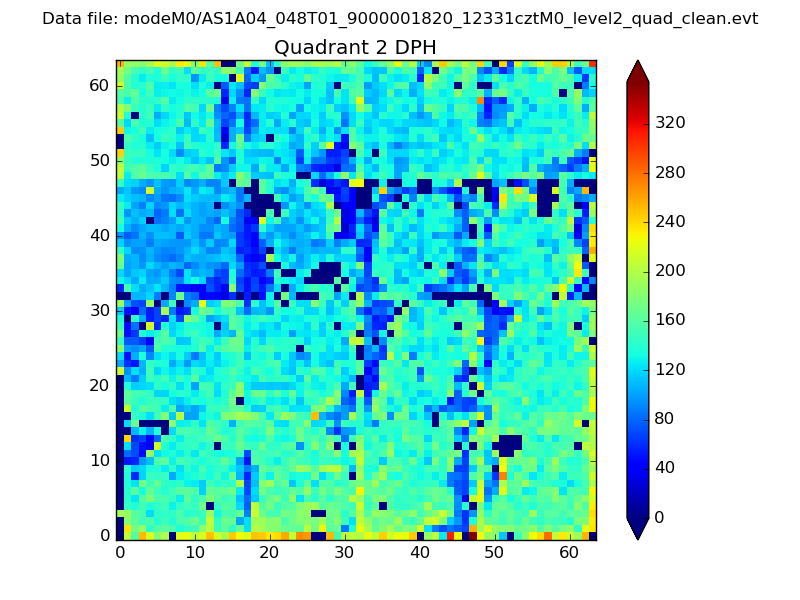 |
Quadrant C |
| Plot type | Count rate plots | Images |
|---|---|---|
| Comparison with Poisson distribution Blue bars denote a histogram of data divided into 1 sec bins. Red curve is a Poisson curve with rate = median count rate of data. |
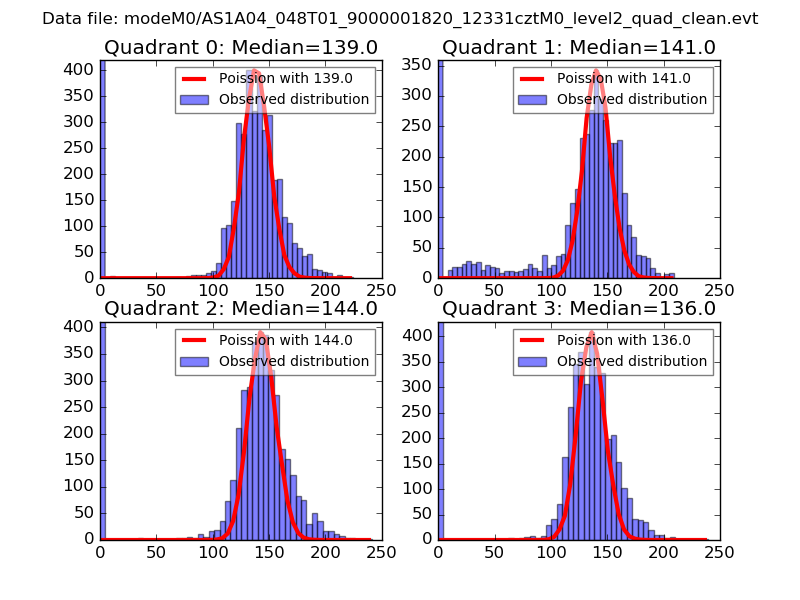 |
 |
| Quadrant-wise count rates Data is divided into 100 sec bins |
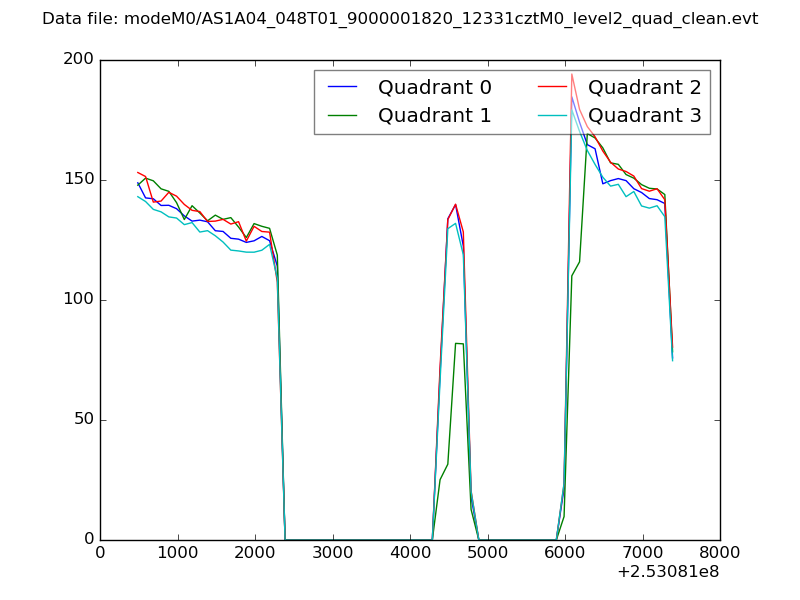 |
|
| Module-wise count rates for Quadrant A Data is divided into 100 sec bins |
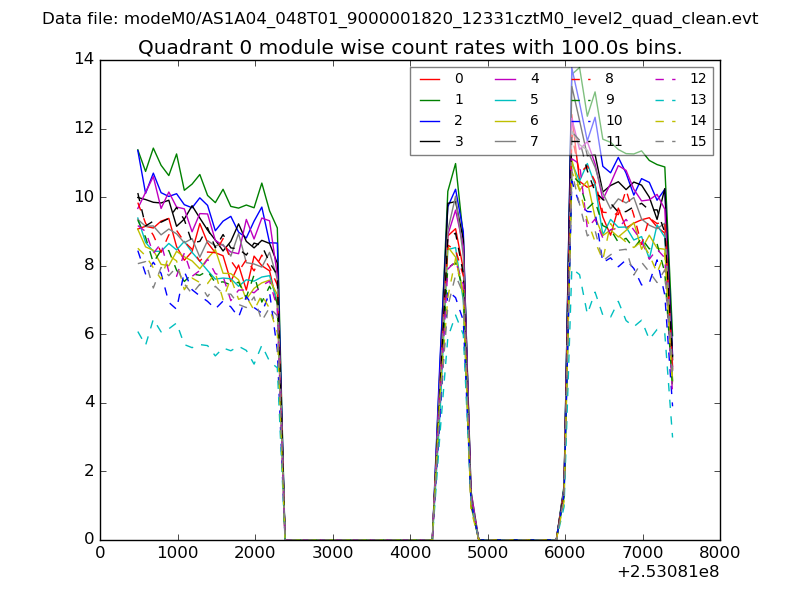 |
 |
| Module-wise count rates for Quadrant B Data is divided into 100 sec bins |
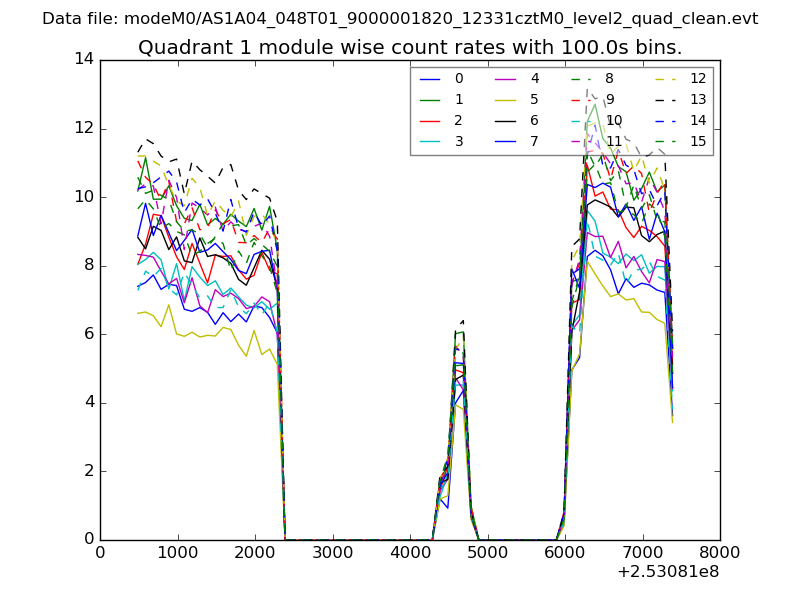 |
 |
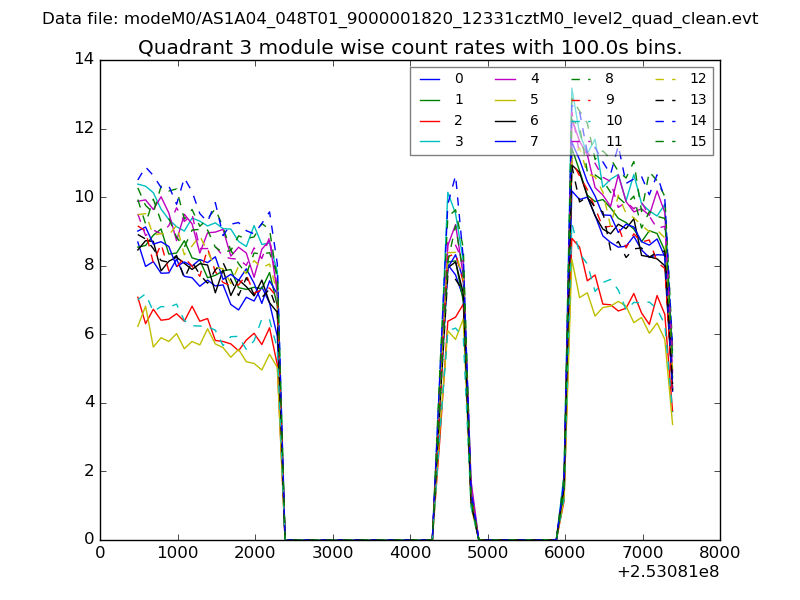
| Module-wise count rates for Quadrant C Data is divided into 100 sec bins |
 |
 |
| Module-wise count rates for Quadrant D Data is divided into 100 sec bins |
 |
 |
| Parameter | Plot |
|---|---|
| CZT HV Monitor | 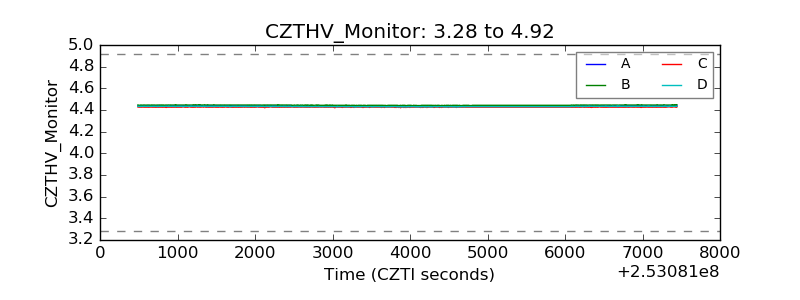 |
| D_VDD | 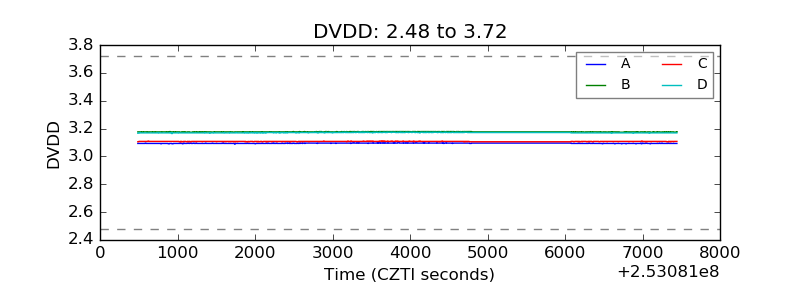 |
| Temperature 1 | 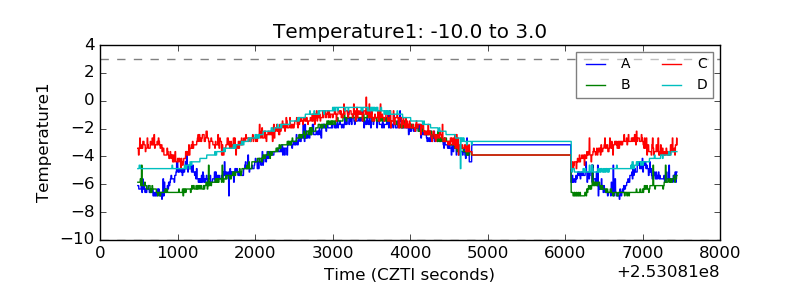 |
| Veto HV Monitor | 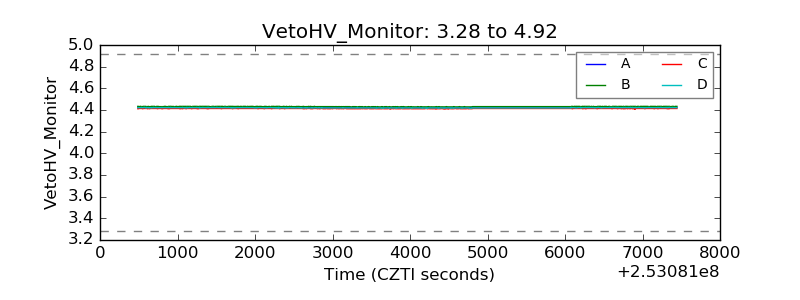 |
| Veto LLD | 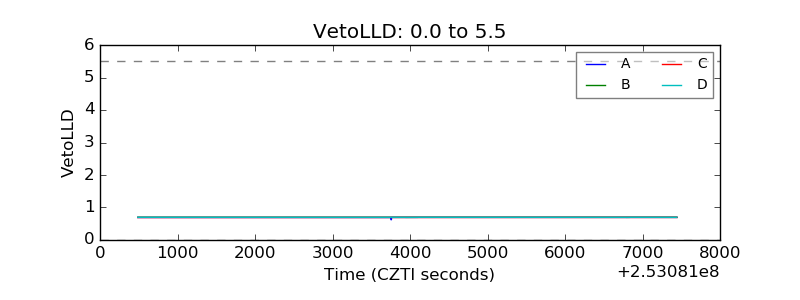 |
| Alpha Counter | 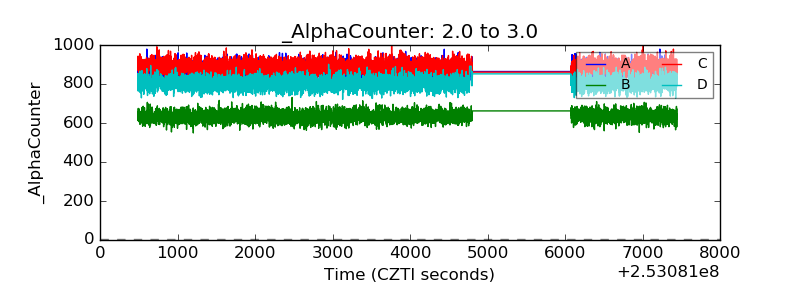 |
| _CPM_Rate | 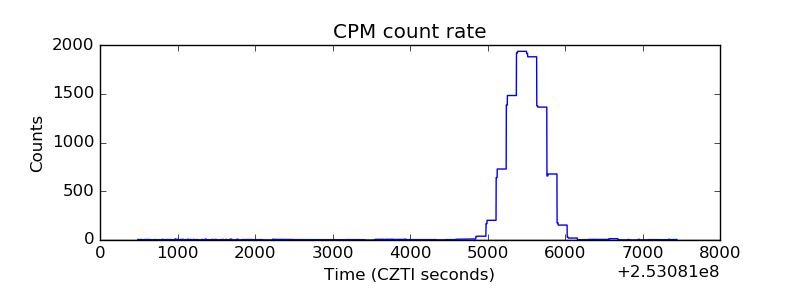 |
| CZT Counter | 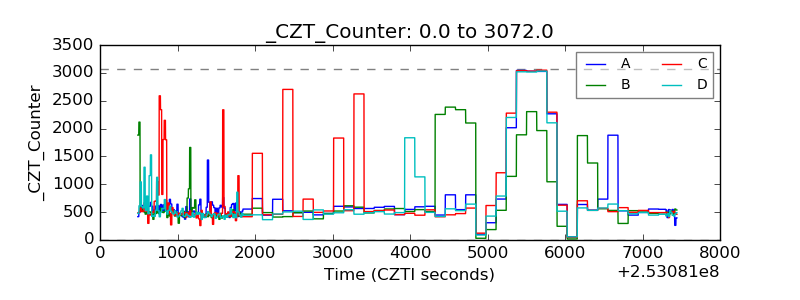 |
| +2.5 Volts monitor |  |
| +5 Volts monitor |  |
| _ROLL_ROT | 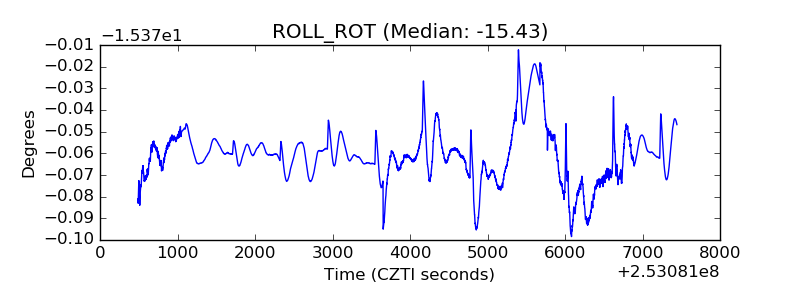 |
| _Roll_DEC | 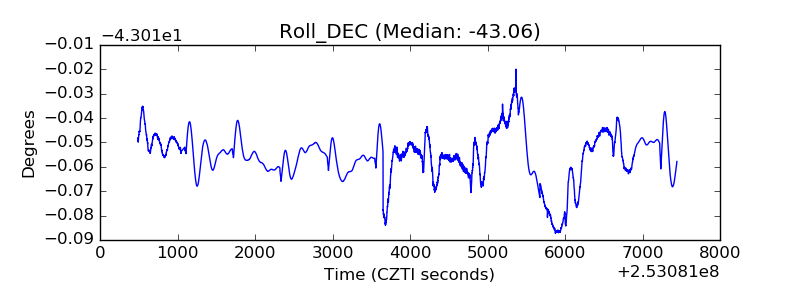 |
| _Roll_RA | 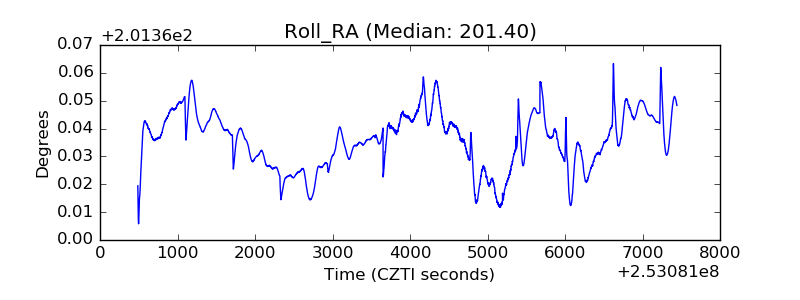 |
| Veto Counter | 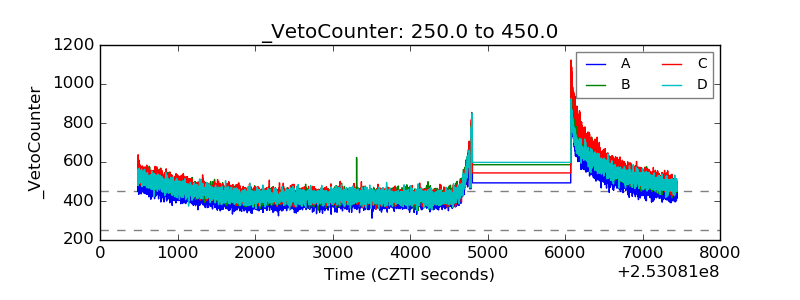 |