| Param | Original file | Final file |
|---|---|---|
| Filename | modeM0/AS1A04_048T01_9000001820_12335cztM0_level2.evt | modeM0/AS1A04_048T01_9000001820_12335cztM0_level2_quad_clean.evt |
| Size (bytes) | 342,668,160 | 47,070,720 |
| Size | 326.8 MB | 44.9 MB |
| Events in quadrant A | 2,751,918 | 279,383 |
| Events in quadrant B | 2,526,728 | 287,061 |
| Events in quadrant C | 2,196,354 | 282,951 |
| Events in quadrant D | 2,607,260 | 270,011 |
| Mode SS | |||
|---|---|---|---|
| Quadrant | BADHDUFLAG | Total packets | Discarded packets |
| A | 0 | 86 | 0 |
| B | 0 | 86 | 0 |
| C | 0 | 86 | 0 |
| D | 0 | 86 | 0 |
| Mode M0 | |||
|---|---|---|---|
| Quadrant | BADHDUFLAG | Total packets | Discarded packets |
| A | 0 | 11043 | 0 |
| B | 0 | 10187 | 0 |
| C | 0 | 9539 | 0 |
| D | 0 | 10726 | 0 |
| Quadrant | Total seconds | Saturated seconds | Saturation percentage |
|---|---|---|---|
| A | 4342 | 68 | 1.566099% |
| B | 4342 | 69 | 1.589129% |
| C | 4342 | 55 | 1.266697% |
| D | 4342 | 94 | 2.164901% |
Noise dominated data is calculated using 1-second bins in cleaned event files. If a bin has >2000 counts, and if more than 50% of those come from <1% of pixels, then it is considered to be noise-dominated and hence unusable.
| Quadrant | # 1 sec bins | Bins with >0 counts | Bins with >2000 counts | High rate bins dominated by noise | Noise dominated (total time) | Noise dominated (detector-on time) | Marked lightcurve |
|---|---|---|---|---|---|---|---|
| A | 4343 | 4343 | 43 | 43 | 0.99% | 0.99% | 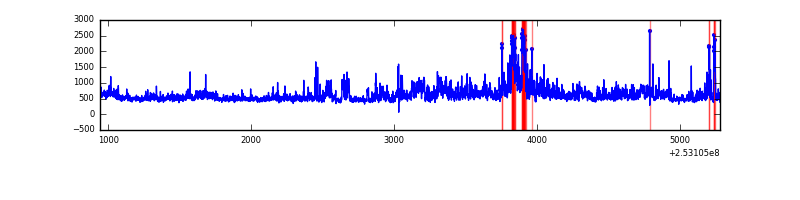 |
| B | 4343 | 4343 | 46 | 46 | 1.06% | 1.06% | 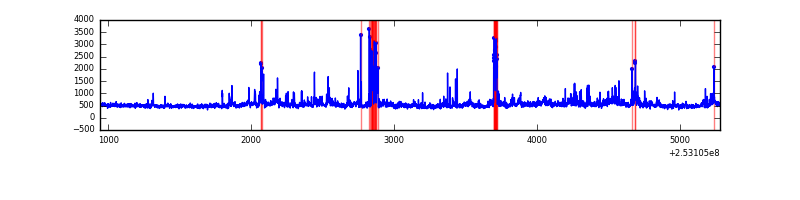 |
| C | 4343 | 4343 | 34 | 34 | 0.78% | 0.78% | 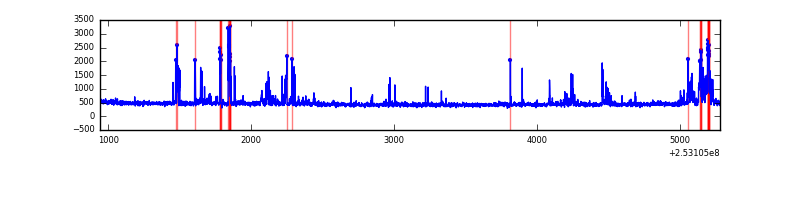 |
| D | 4343 | 4343 | 86 | 86 | 1.98% | 1.98% | 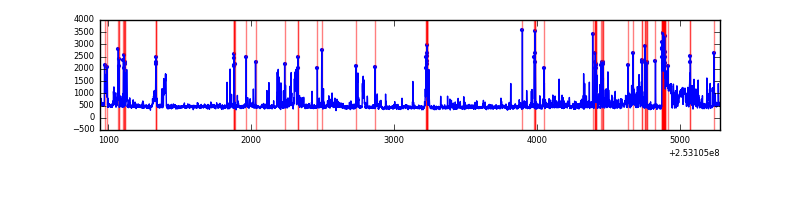 |
Top three noisy pixels from each quadrant. If the there are fewer than three noisy pixels in the level2.evt file, extra rows are filled as -1
| Pixel properties | Quadrant properties | ||||||
|---|---|---|---|---|---|---|---|
| Quadrant | DetID | PixID | Counts | Sigma | Mean | Median | Sigma |
| A | 13 | 251 | 399873 | 3971.47 | 492 | 482 | 100.6 |
| A | 14 | 63 | 146282 | 1449.81 | 492 | 482 | 100.6 |
| A | 1 | 162 | 96057 | 950.38 | 492 | 482 | 100.6 |
| B | 4 | 239 | 223052 | 2378.67 | 491 | 479 | 93.6 |
| B | 0 | 219 | 167618 | 1786.24 | 491 | 479 | 93.6 |
| B | 0 | 85 | 54833 | 580.89 | 491 | 479 | 93.6 |
| C | 4 | 254 | 292966 | 2608.13 | 480 | 484 | 112.1 |
| C | 15 | 208 | 14599 | 125.87 | 480 | 484 | 112.1 |
| C | 0 | 207 | 11835 | 101.22 | 480 | 484 | 112.1 |
| D | 1 | 52 | 440982 | 3812.41 | 479 | 467 | 115.5 |
| D | 13 | 104 | 116366 | 1003.04 | 479 | 467 | 115.5 |
| D | 10 | 199 | 107174 | 923.49 | 479 | 467 | 115.5 |
Histogram calculated using DETX and DETY for each event in the final _common_clean file
| Quadrant A | 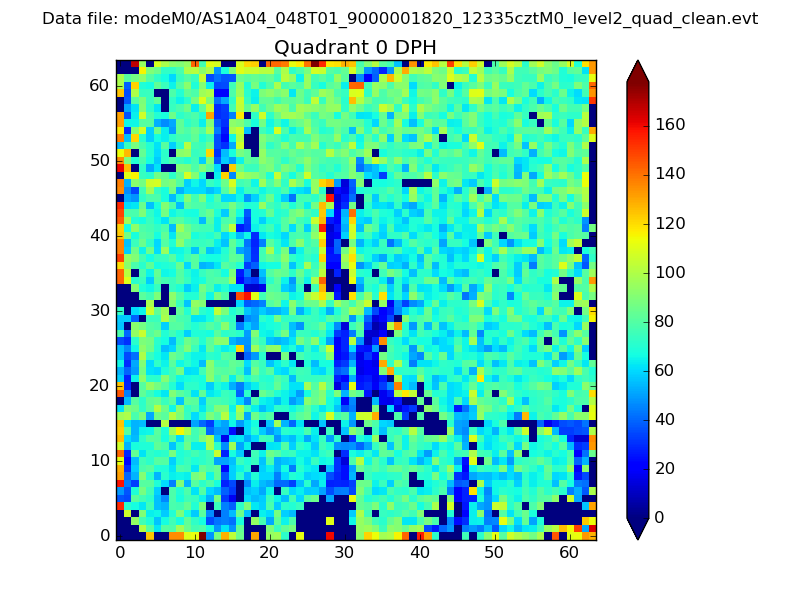 |
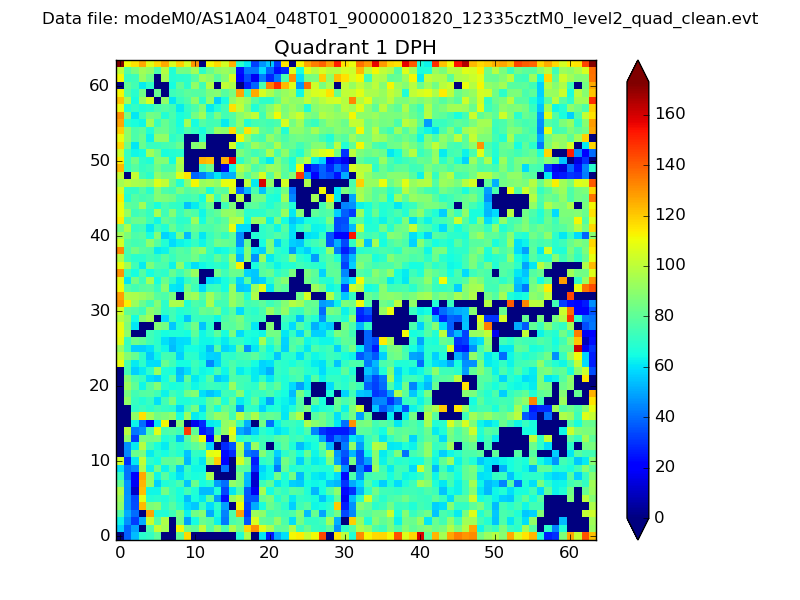 |
Quadrant B |
|---|---|---|---|
| Quadrant D |  |
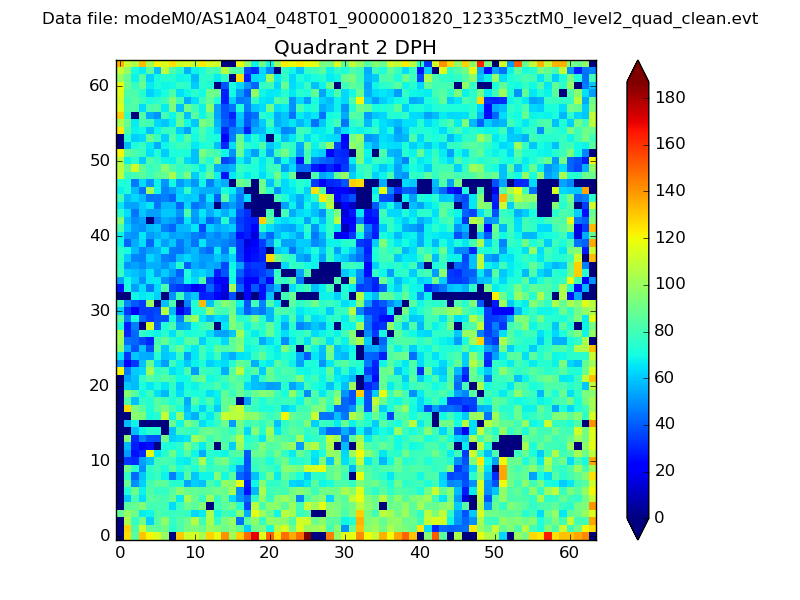 |
Quadrant C |
| Plot type | Count rate plots | Images |
|---|---|---|
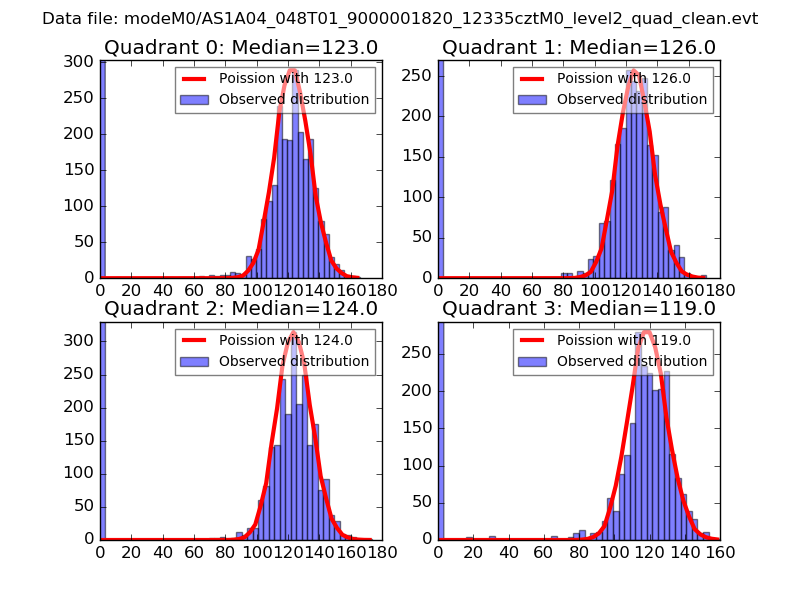
| Comparison with Poisson distribution Blue bars denote a histogram of data divided into 1 sec bins. Red curve is a Poisson curve with rate = median count rate of data. |
 |
 |
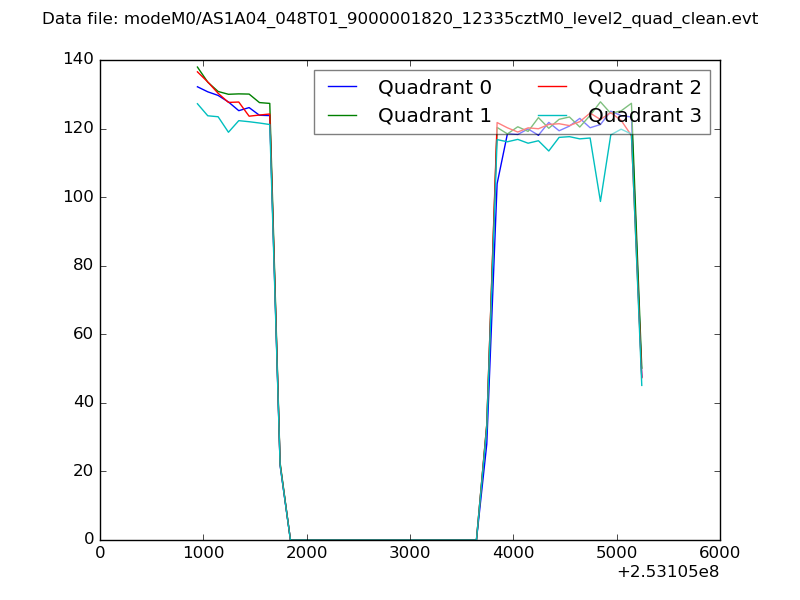
| Quadrant-wise count rates Data is divided into 100 sec bins |
 |
|
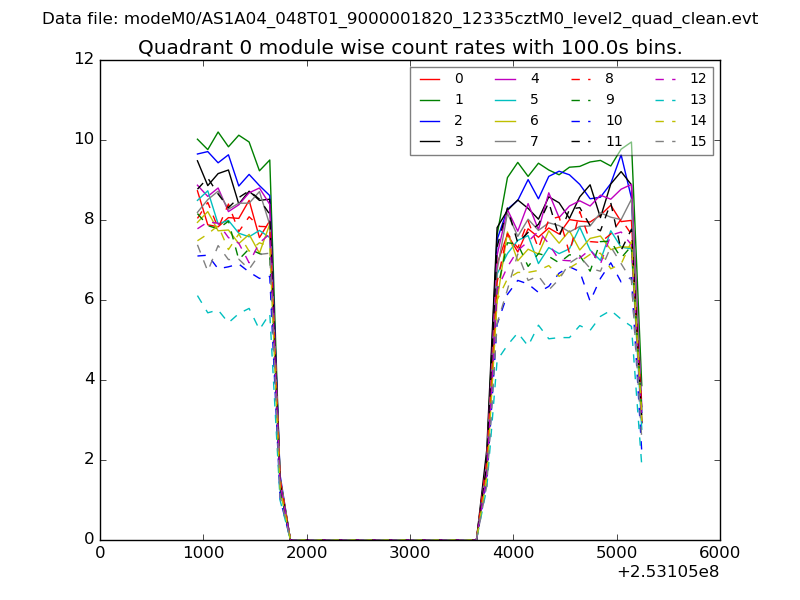
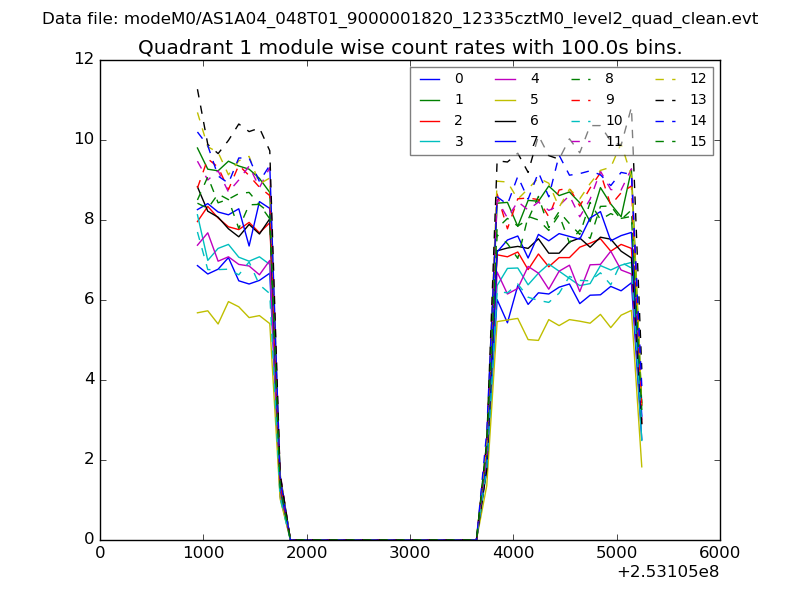
| Module-wise count rates for Quadrant A Data is divided into 100 sec bins |
 |
 |
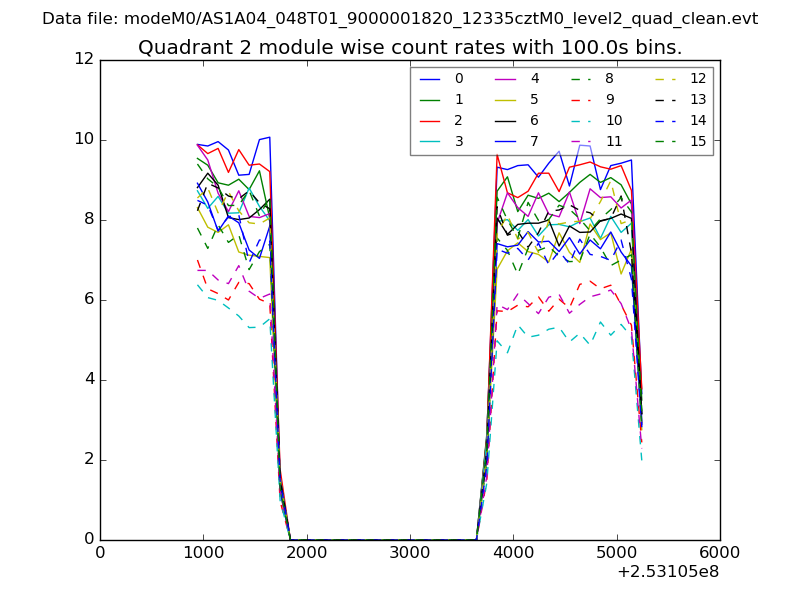
| Module-wise count rates for Quadrant B Data is divided into 100 sec bins |
 |
 |
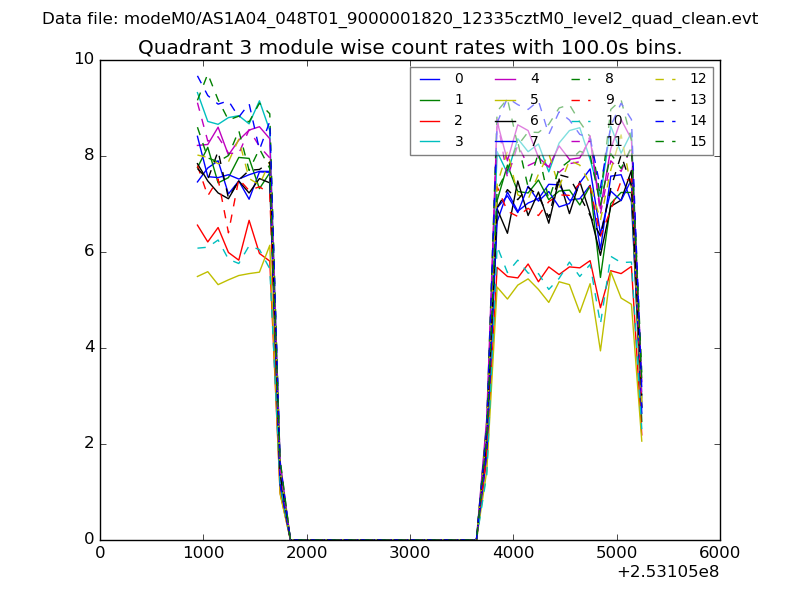
| Module-wise count rates for Quadrant C Data is divided into 100 sec bins |
 |
 |
| Module-wise count rates for Quadrant D Data is divided into 100 sec bins |
 |
 |
| Parameter | Plot |
|---|---|
| CZT HV Monitor | 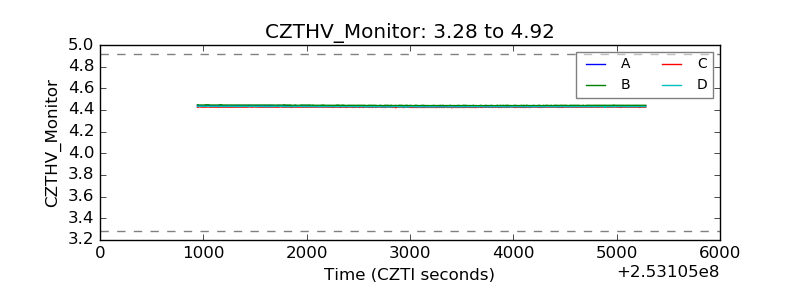 |
| D_VDD | 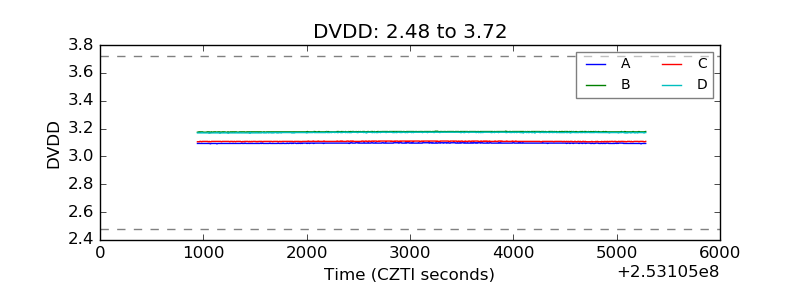 |
| Temperature 1 | 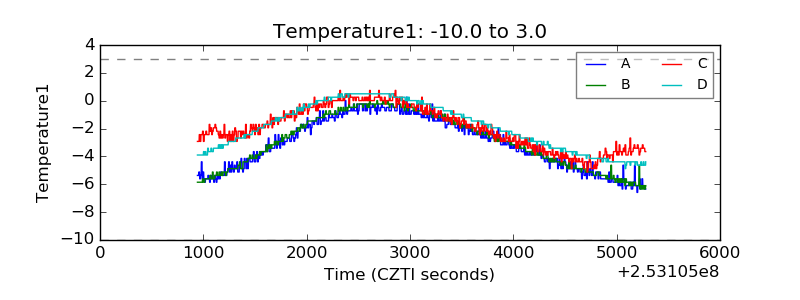 |
| Veto HV Monitor | 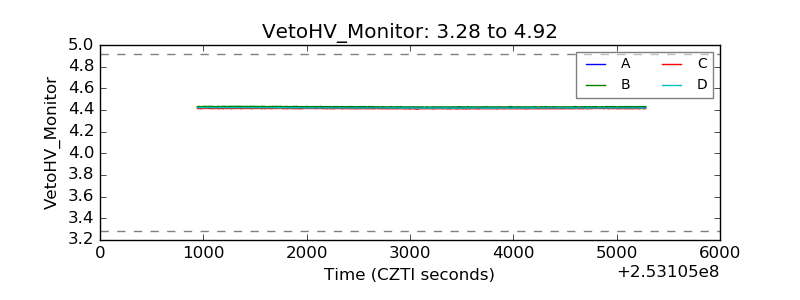 |
| Veto LLD | 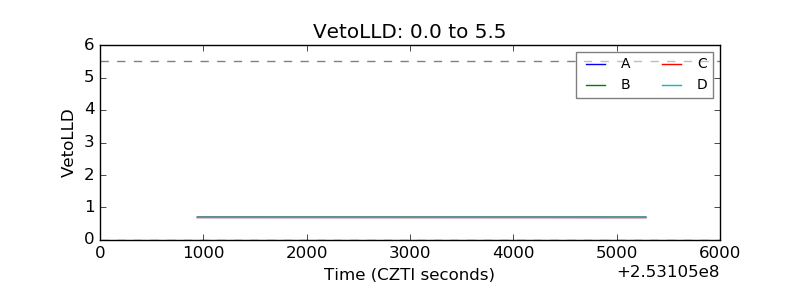 |
| Alpha Counter | 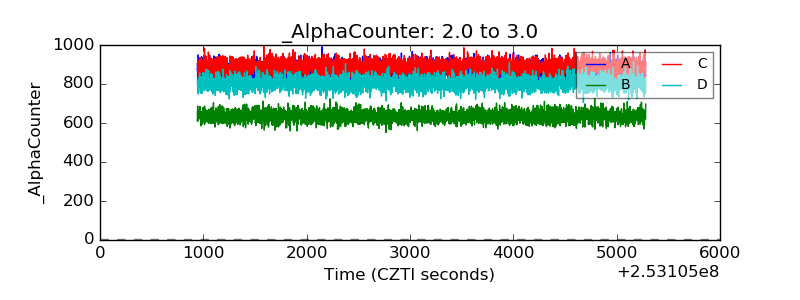 |
| _CPM_Rate | 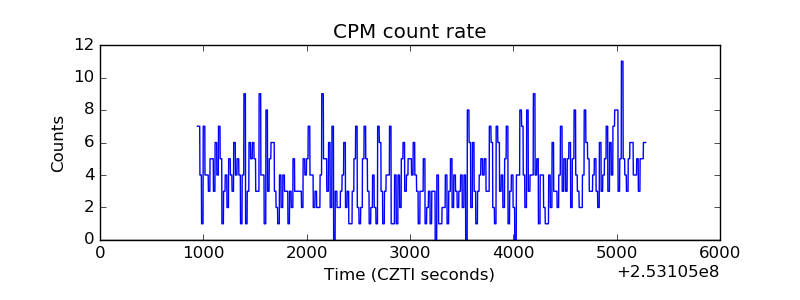 |
| CZT Counter |  |
| +2.5 Volts monitor |  |
| +5 Volts monitor |  |
| _ROLL_ROT | 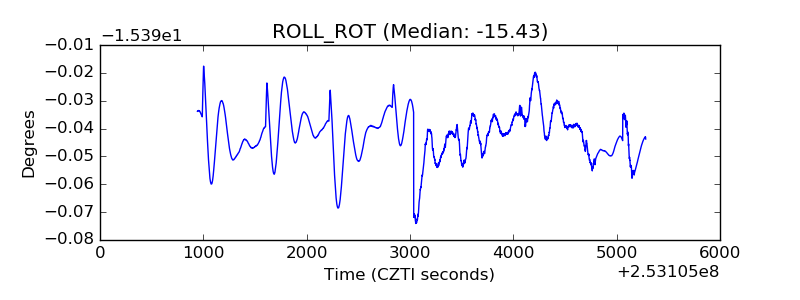 |
| _Roll_DEC | 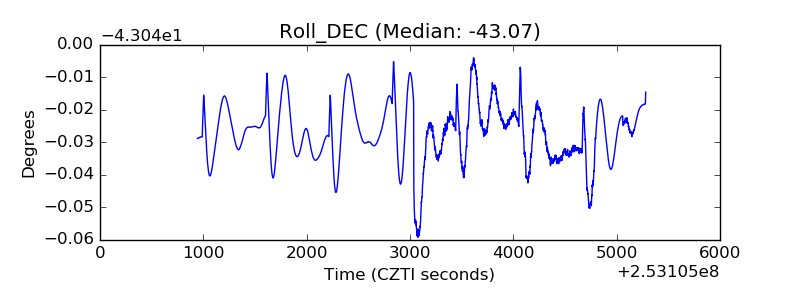 |
| _Roll_RA | 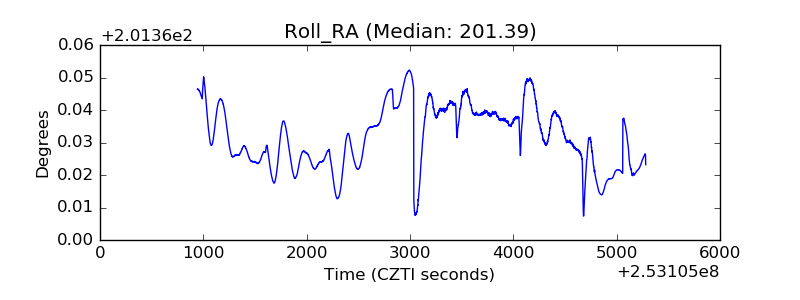 |
| Veto Counter | 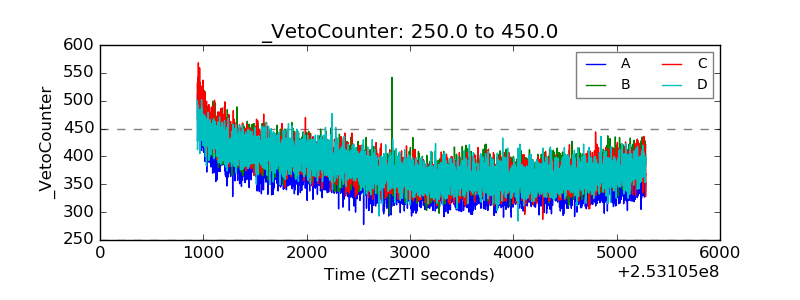 |