| Param | Original file | Final file |
|---|---|---|
| Filename | modeM0/AS1A04_130T01_9000001822_12335cztM0_level2.evt | modeM0/AS1A04_130T01_9000001822_12335cztM0_level2_quad_clean.evt |
| Size (bytes) | 132,243,840 | 24,647,040 |
| Size | 126.1 MB | 23.5 MB |
| Events in quadrant A | 982,231 | 158,727 |
| Events in quadrant B | 923,773 | 162,290 |
| Events in quadrant C | 774,105 | 163,471 |
| Events in quadrant D | 1,222,940 | 152,596 |
| Mode M9 | |||
|---|---|---|---|
| Quadrant | BADHDUFLAG | Total packets | Discarded packets |
| A | 0 | 2 | 0 |
| B | 0 | 2 | 0 |
| C | 0 | 2 | 0 |
| D | 0 | 2 | 0 |
| Mode M0 | |||
|---|---|---|---|
| Quadrant | BADHDUFLAG | Total packets | Discarded packets |
| A | 0 | 3881 | 2 |
| B | 0 | 3681 | 1 |
| C | 0 | 3259 | 1 |
| D | 0 | 4594 | 1 |
| Mode SS | |||
|---|---|---|---|
| Quadrant | BADHDUFLAG | Total packets | Discarded packets |
| A | 0 | 30 | 0 |
| B | 0 | 30 | 0 |
| C | 0 | 30 | 0 |
| D | 0 | 30 | 0 |
| Quadrant | Total seconds | Saturated seconds | Saturation percentage |
|---|---|---|---|
| A | 1462 | 104 | 7.113543% |
| B | 1462 | 95 | 6.497948% |
| C | 1462 | 55 | 3.761970% |
| D | 1462 | 118 | 8.071135% |
Noise dominated data is calculated using 1-second bins in cleaned event files. If a bin has >2000 counts, and if more than 50% of those come from <1% of pixels, then it is considered to be noise-dominated and hence unusable.
| Quadrant | # 1 sec bins | Bins with >0 counts | Bins with >2000 counts | High rate bins dominated by noise | Noise dominated (total time) | Noise dominated (detector-on time) | Marked lightcurve |
|---|---|---|---|---|---|---|---|
| A | 1463 | 1463 | 7 | 7 | 0.48% | 0.48% | 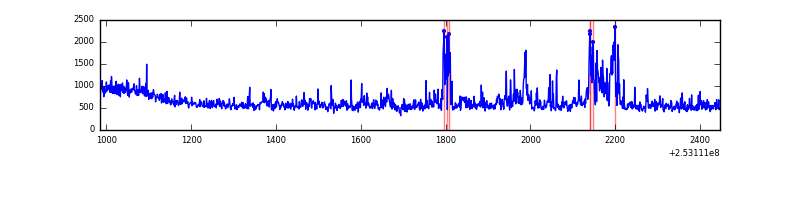 |
| B | 1463 | 1463 | 4 | 4 | 0.27% | 0.27% | 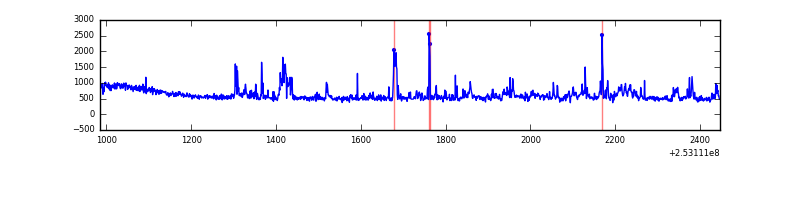 |
| C | 1463 | 1463 | 1 | 1 | 0.07% | 0.07% | 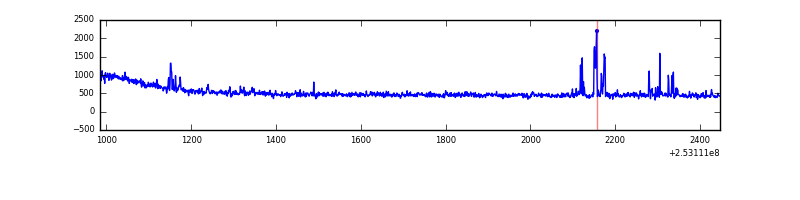 |
| D | 1463 | 1463 | 45 | 45 | 3.08% | 3.08% | 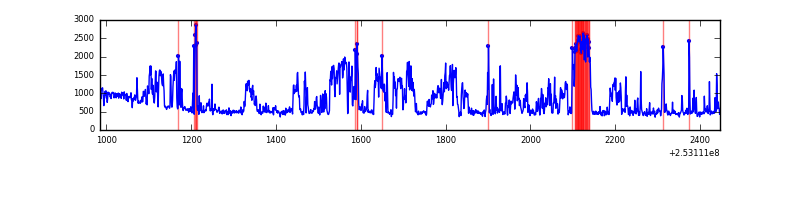 |
Top three noisy pixels from each quadrant. If the there are fewer than three noisy pixels in the level2.evt file, extra rows are filled as -1
| Pixel properties | Quadrant properties | ||||||
|---|---|---|---|---|---|---|---|
| Quadrant | DetID | PixID | Counts | Sigma | Mean | Median | Sigma |
| A | 3 | 1 | 118465 | 2764.18 | 197 | 192 | 42.8 |
| A | 13 | 251 | 33350 | 774.94 | 197 | 192 | 42.8 |
| A | 1 | 162 | 27336 | 634.39 | 197 | 192 | 42.8 |
| B | 0 | 85 | 64509 | 1614.64 | 194 | 189 | 39.8 |
| B | 4 | 239 | 32721 | 816.66 | 194 | 189 | 39.8 |
| B | 0 | 219 | 23897 | 595.15 | 194 | 189 | 39.8 |
| C | 4 | 254 | 37971 | 818.32 | 188 | 189 | 46.2 |
| C | 13 | 61 | 1311 | 24.3 | 188 | 189 | 46.2 |
| C | 8 | 222 | 1049 | 18.63 | 188 | 189 | 46.2 |
| D | 1 | 52 | 376989 | 7952.43 | 188 | 182 | 47.4 |
| D | 14 | 34 | 76265 | 1605.72 | 188 | 182 | 47.4 |
| D | 7 | 223 | 18263 | 381.6 | 188 | 182 | 47.4 |
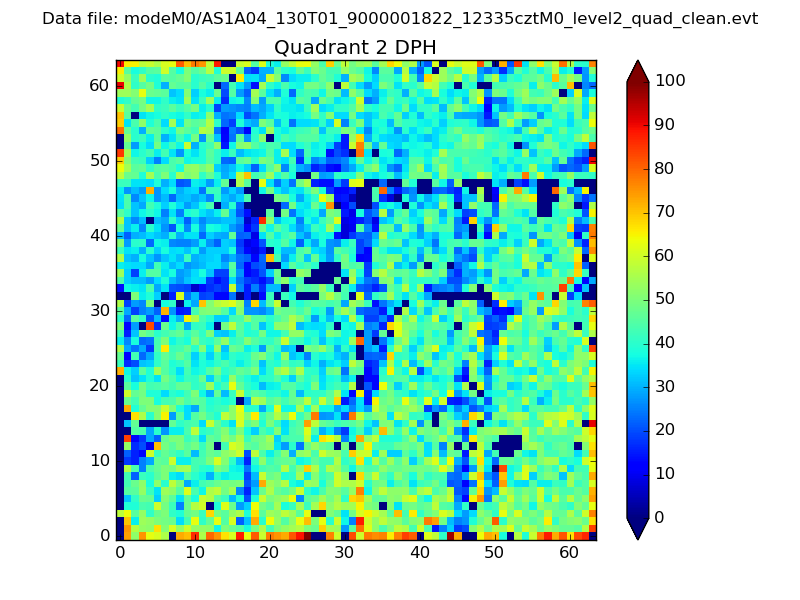
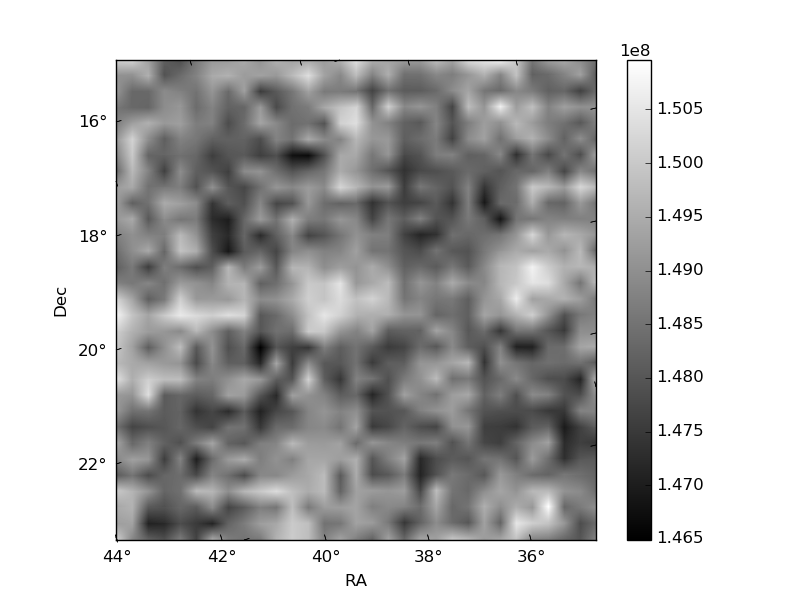
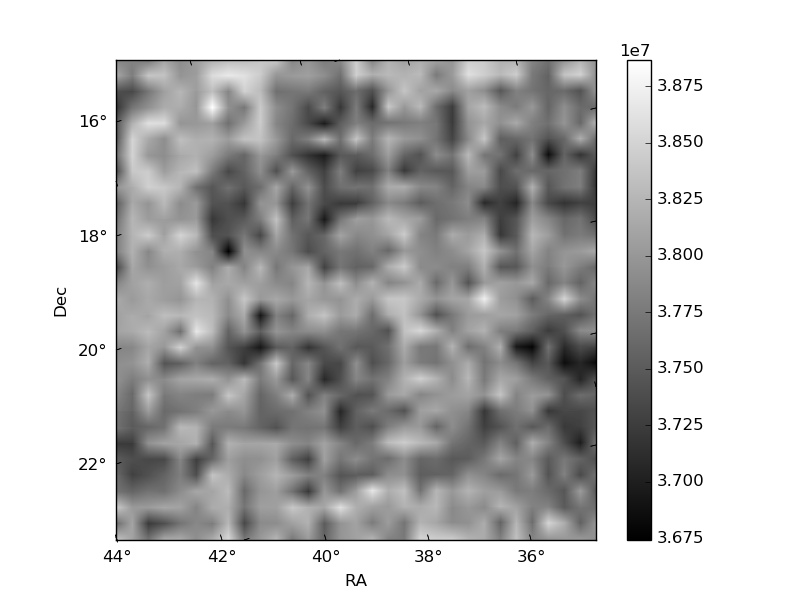
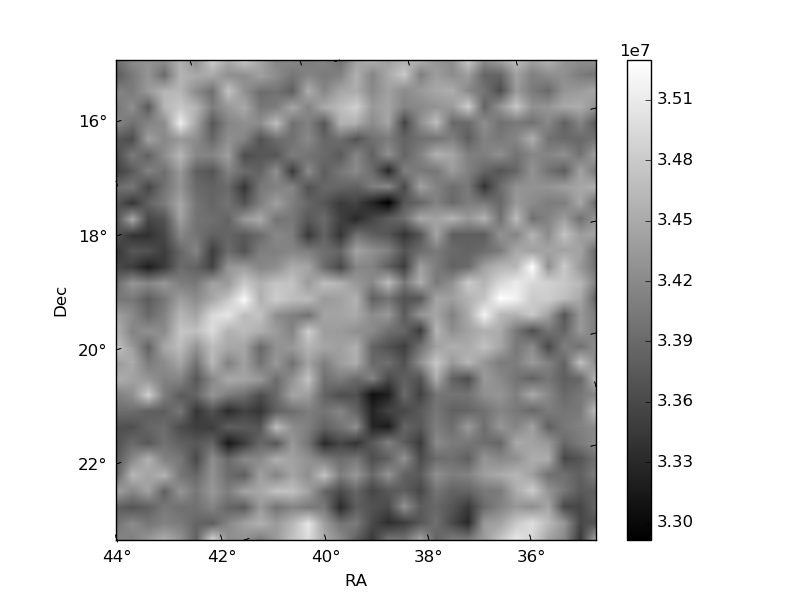
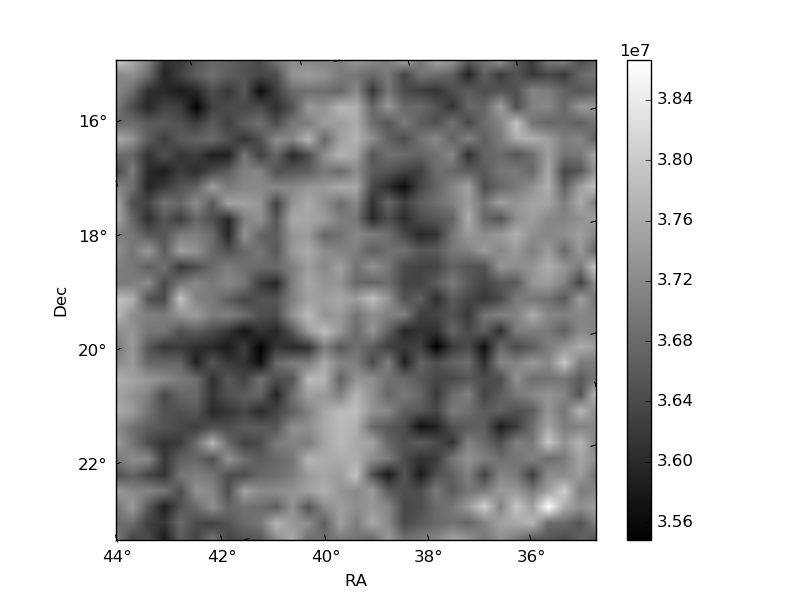
Histogram calculated using DETX and DETY for each event in the final _common_clean file
| Quadrant A | 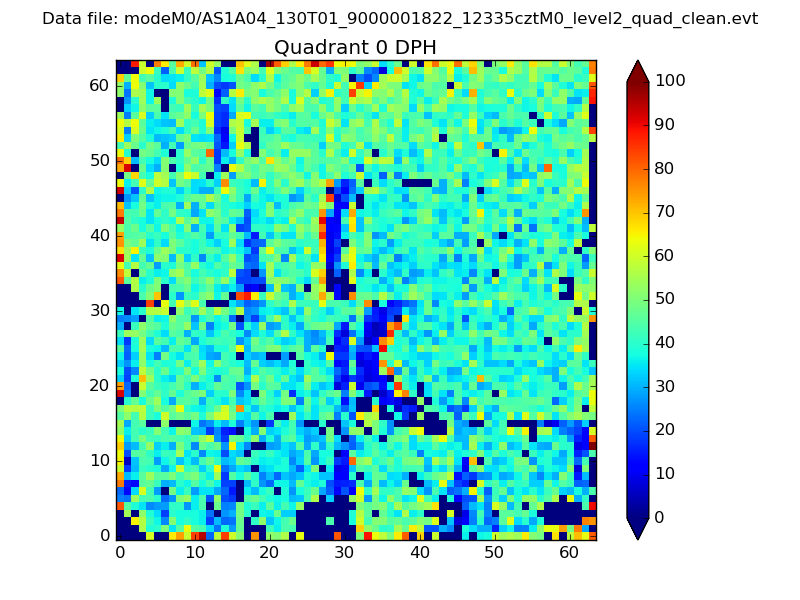 |
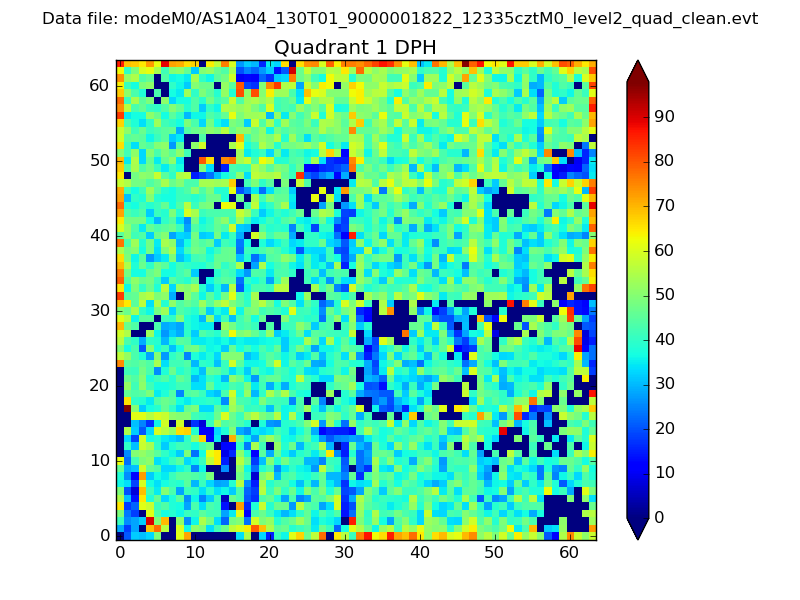 |
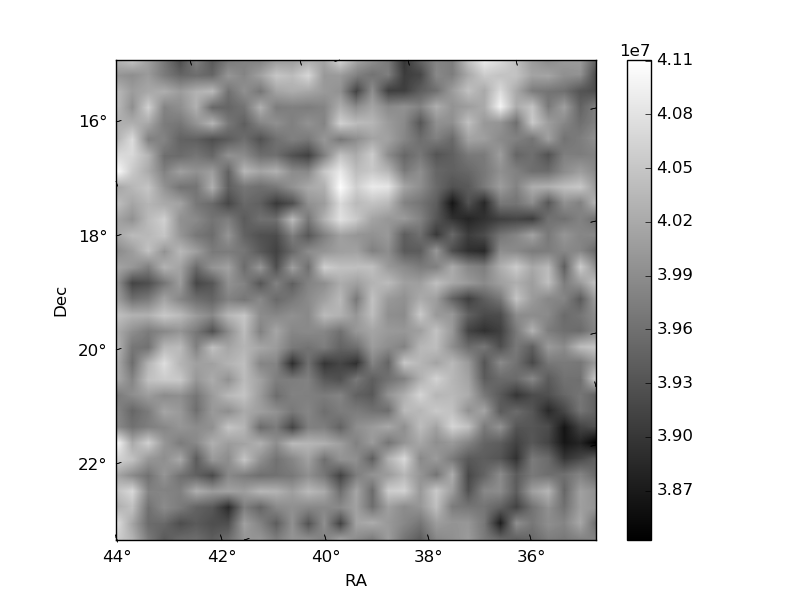
Quadrant B |
|---|---|---|---|
| Quadrant D | 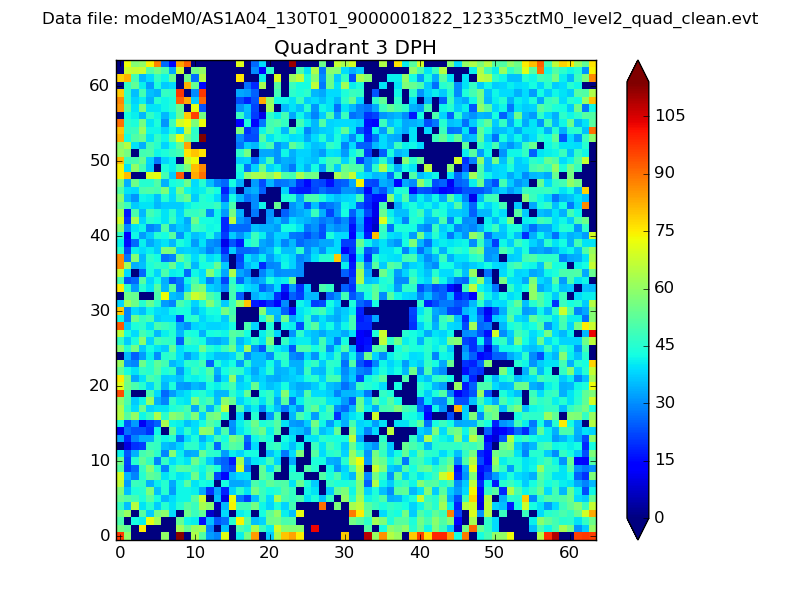 |
 |
Quadrant C |
| Plot type | Count rate plots | Images |
|---|---|---|
| Comparison with Poisson distribution Blue bars denote a histogram of data divided into 1 sec bins. Red curve is a Poisson curve with rate = median count rate of data. |
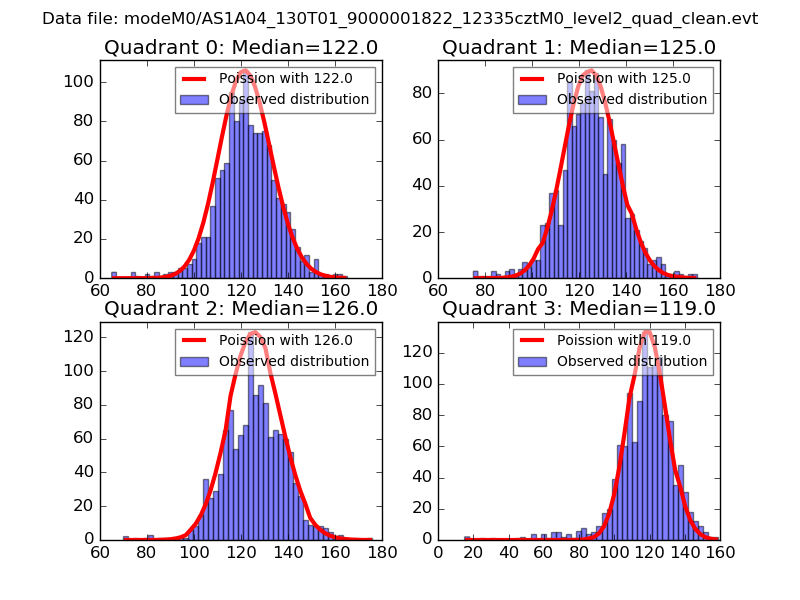 |
 |
| Quadrant-wise count rates Data is divided into 100 sec bins |
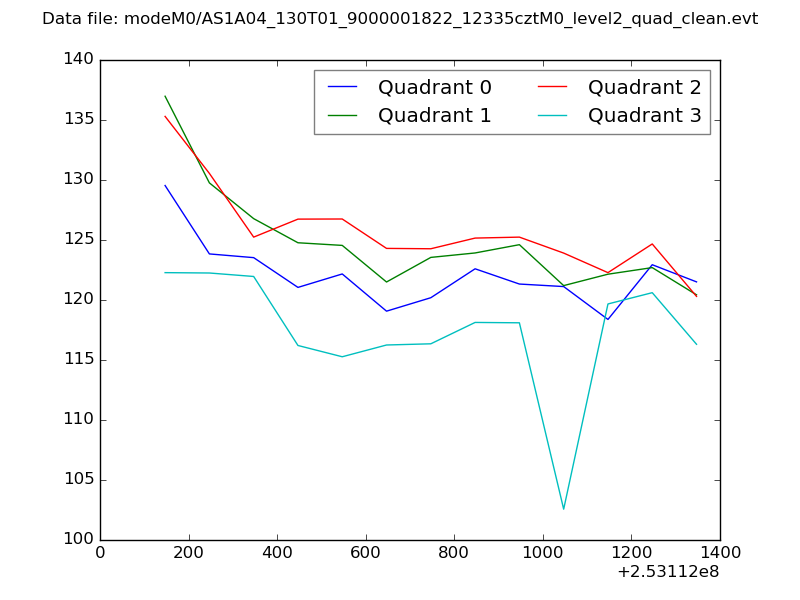 |
|
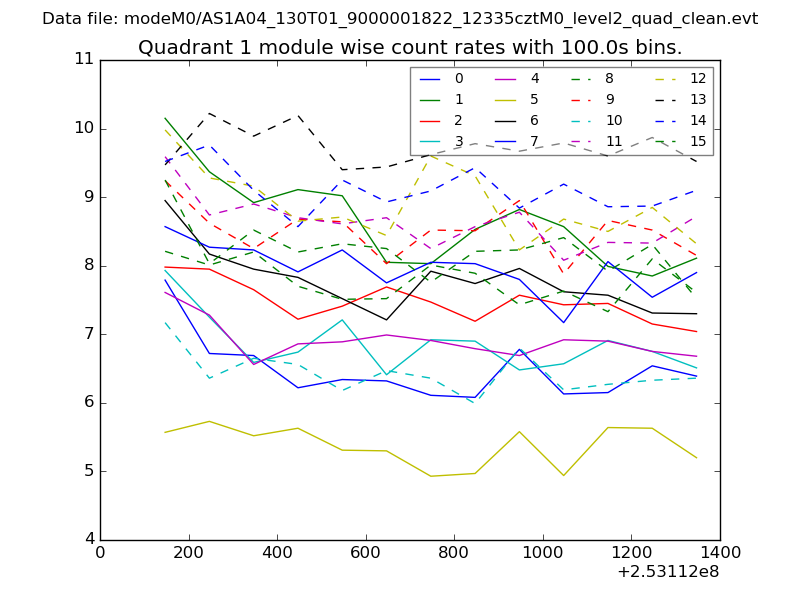
| Module-wise count rates for Quadrant A Data is divided into 100 sec bins |
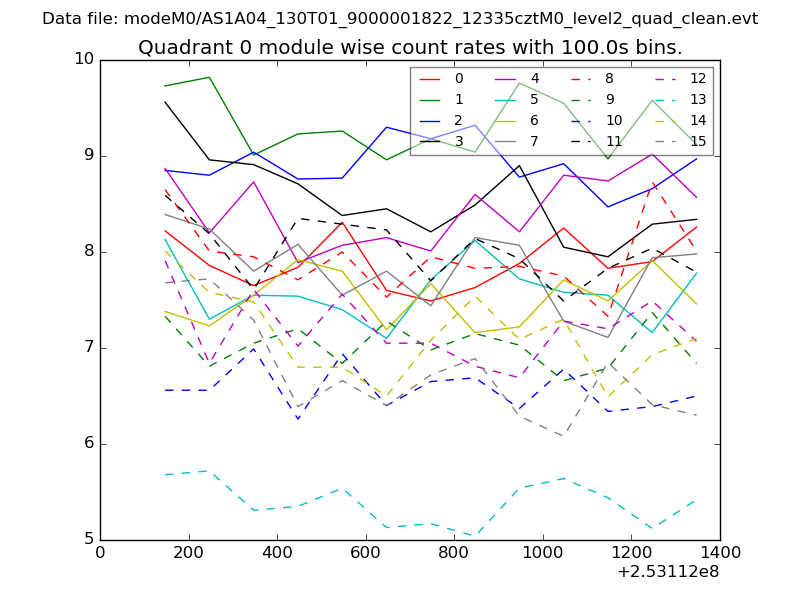 |
 |
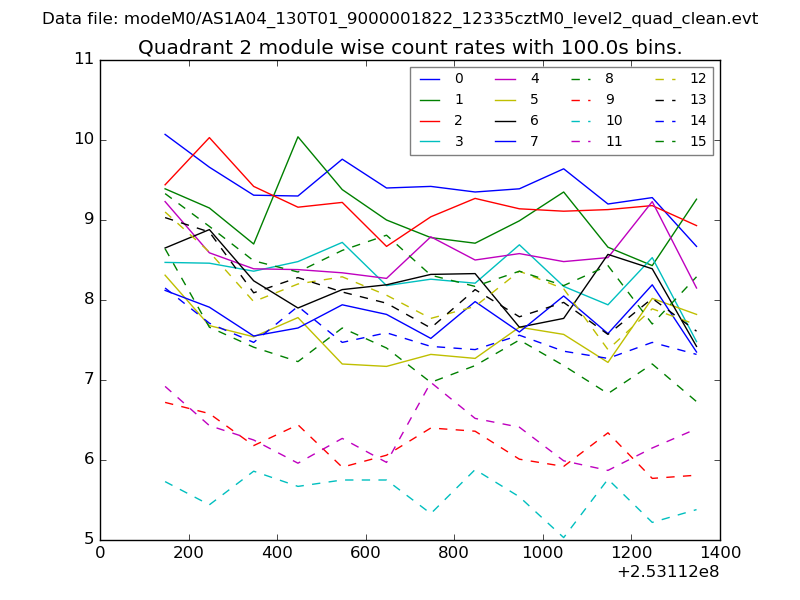
| Module-wise count rates for Quadrant B Data is divided into 100 sec bins |
 |
 |
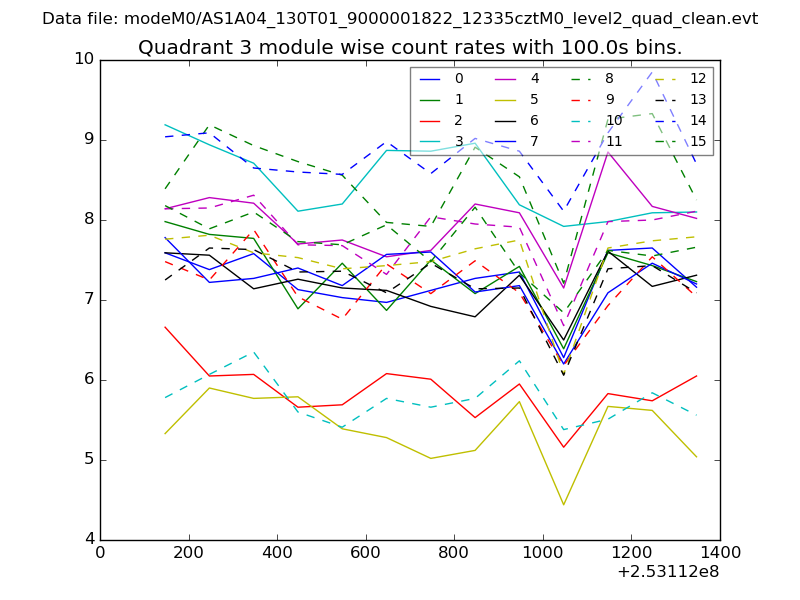
| Module-wise count rates for Quadrant C Data is divided into 100 sec bins |
 |
 |
| Module-wise count rates for Quadrant D Data is divided into 100 sec bins |
 |
 |
| Parameter | Plot |
|---|---|
| CZT HV Monitor |  |
| D_VDD | 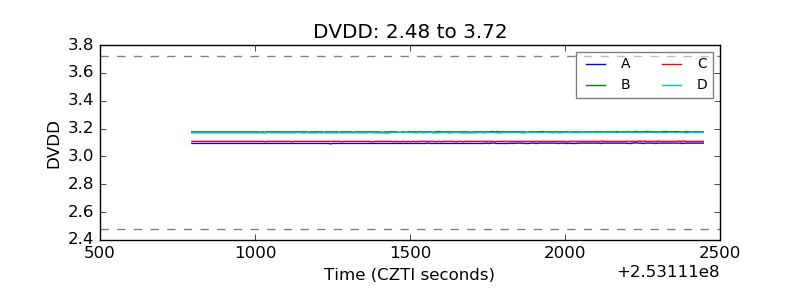 |
| Temperature 1 | 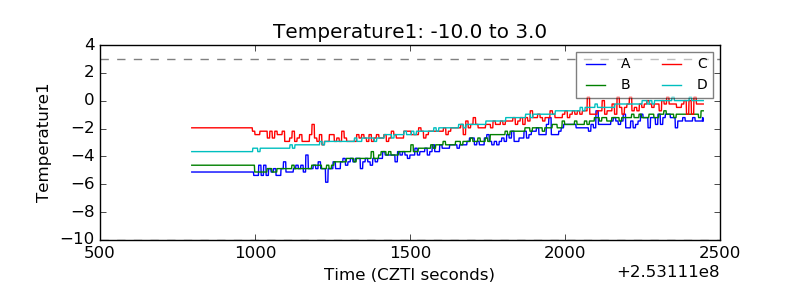 |
| Veto HV Monitor | 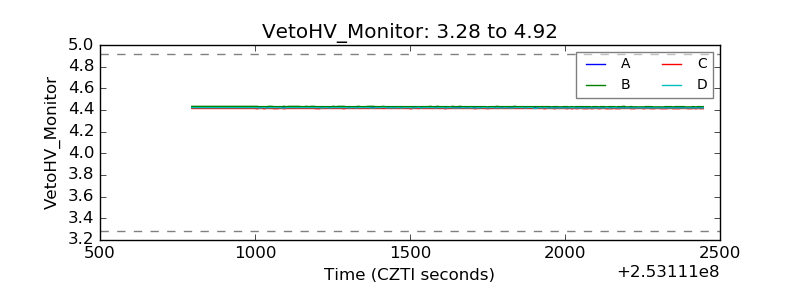 |
| Veto LLD |  |
| Alpha Counter | 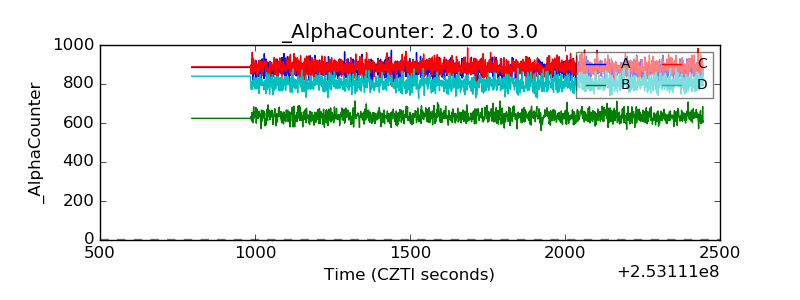 |
| _CPM_Rate | 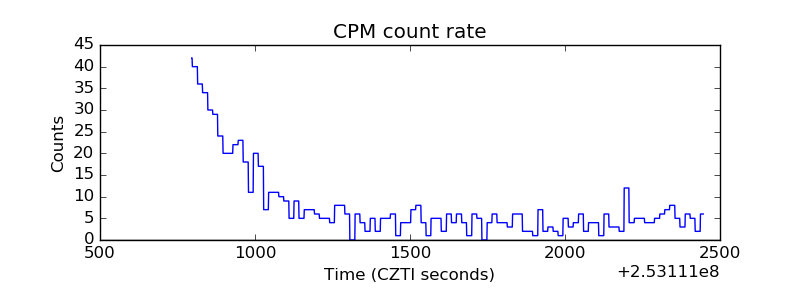 |
| CZT Counter | 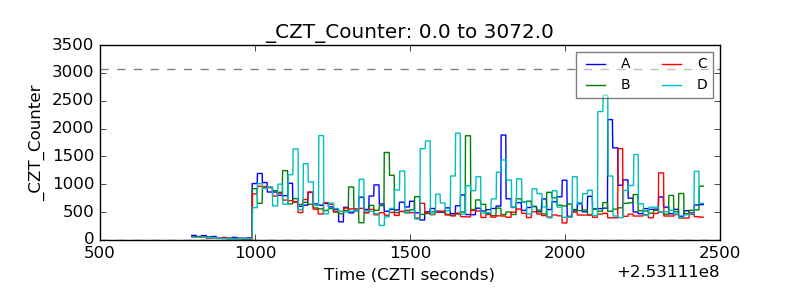 |
| +2.5 Volts monitor |  |
| +5 Volts monitor |  |
| _ROLL_ROT | 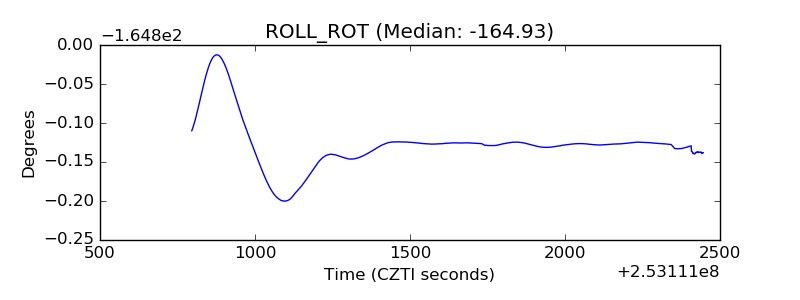 |
| _Roll_DEC | 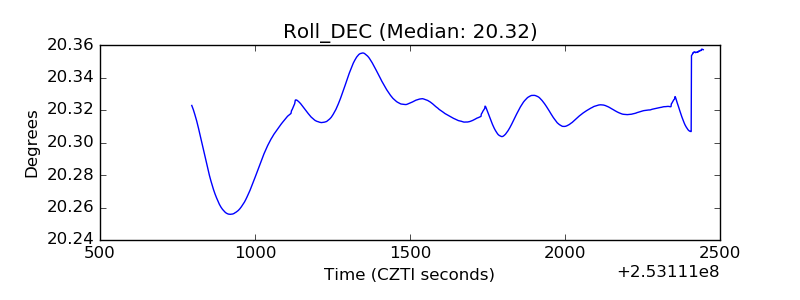 |
| _Roll_RA | 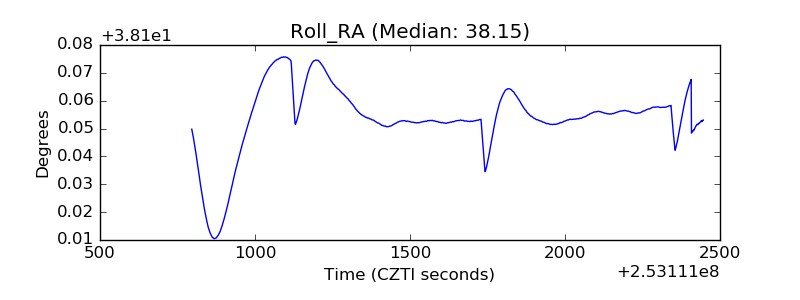 |
| Veto Counter | 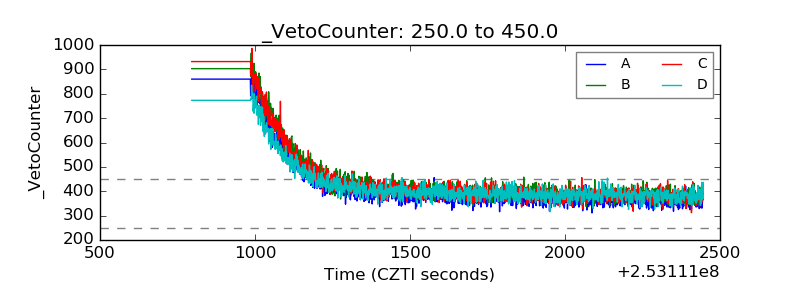 |