| Param | Original file | Final file |
|---|---|---|
| Filename | modeM0/AS1A04_130T01_9000001822_12341cztM0_level2.evt | modeM0/AS1A04_130T01_9000001822_12341cztM0_level2_quad_clean.evt |
| Size (bytes) | 585,717,120 | 87,592,320 |
| Size | 558.6 MB | 83.5 MB |
| Events in quadrant A | 4,904,186 | 546,179 |
| Events in quadrant B | 3,712,940 | 551,185 |
| Events in quadrant C | 3,919,246 | 543,311 |
| Events in quadrant D | 4,720,253 | 516,561 |
| Mode M9 | |||
|---|---|---|---|
| Quadrant | BADHDUFLAG | Total packets | Discarded packets |
| A | 0 | 18 | 0 |
| B | 0 | 18 | 0 |
| C | 0 | 18 | 0 |
| D | 0 | 18 | 0 |
| Mode M0 | |||
|---|---|---|---|
| Quadrant | BADHDUFLAG | Total packets | Discarded packets |
| A | 0 | 19493 | 3 |
| B | 0 | 15682 | 2 |
| C | 0 | 16409 | 2 |
| D | 0 | 19139 | 2 |
| Mode SS | |||
|---|---|---|---|
| Quadrant | BADHDUFLAG | Total packets | Discarded packets |
| A | 0 | 146 | 0 |
| B | 0 | 146 | 0 |
| C | 0 | 146 | 0 |
| D | 0 | 146 | 0 |
| Quadrant | Total seconds | Saturated seconds | Saturation percentage |
|---|---|---|---|
| A | 7111 | 174 | 2.446913% |
| B | 7111 | 142 | 1.996906% |
| C | 7111 | 178 | 2.503164% |
| D | 7111 | 361 | 5.076642% |
Noise dominated data is calculated using 1-second bins in cleaned event files. If a bin has >2000 counts, and if more than 50% of those come from <1% of pixels, then it is considered to be noise-dominated and hence unusable.
| Quadrant | # 1 sec bins | Bins with >0 counts | Bins with >2000 counts | High rate bins dominated by noise | Noise dominated (total time) | Noise dominated (detector-on time) | Marked lightcurve |
|---|---|---|---|---|---|---|---|
| A | 8872 | 7114 | 21 | 21 | 0.24% | 0.30% | 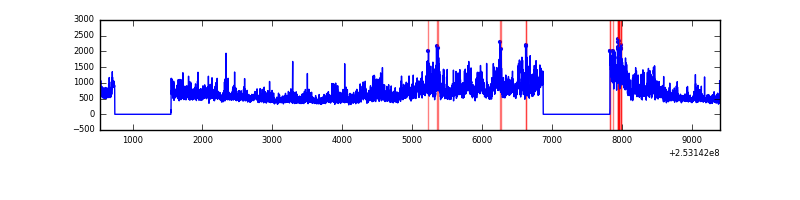 |
| B | 8872 | 7114 | 49 | 49 | 0.55% | 0.69% | 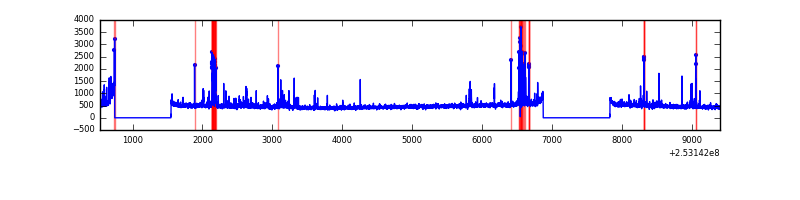 |
| C | 8872 | 7114 | 91 | 91 | 1.03% | 1.28% | 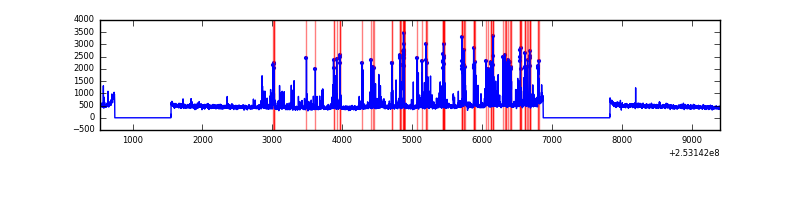 |
| D | 8872 | 7114 | 327 | 327 | 3.69% | 4.60% | 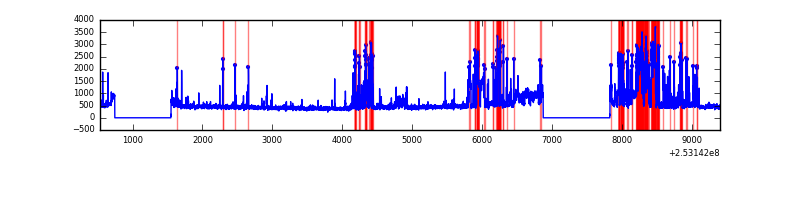 |
Top three noisy pixels from each quadrant. If the there are fewer than three noisy pixels in the level2.evt file, extra rows are filled as -1
| Pixel properties | Quadrant properties | ||||||
|---|---|---|---|---|---|---|---|
| Quadrant | DetID | PixID | Counts | Sigma | Mean | Median | Sigma |
| A | 8 | 15 | 859858 | 4992.0 | 837 | 818 | 172.1 |
| A | 13 | 251 | 364979 | 2116.19 | 837 | 818 | 172.1 |
| A | 1 | 162 | 185411 | 1072.7 | 837 | 818 | 172.1 |
| B | 4 | 239 | 186327 | 1137.54 | 841 | 818 | 163.1 |
| B | 0 | 230 | 90487 | 549.85 | 841 | 818 | 163.1 |
| B | 0 | 85 | 60960 | 368.79 | 841 | 818 | 163.1 |
| C | 4 | 254 | 679294 | 3553.3 | 814 | 818 | 190.9 |
| C | 15 | 208 | 47877 | 246.46 | 814 | 818 | 190.9 |
| C | 8 | 128 | 6618 | 30.38 | 814 | 818 | 190.9 |
| D | 1 | 52 | 1466407 | 7564.8 | 804 | 782 | 193.7 |
| D | 10 | 199 | 29986 | 150.74 | 804 | 782 | 193.7 |
| D | 7 | 80 | 28785 | 144.54 | 804 | 782 | 193.7 |
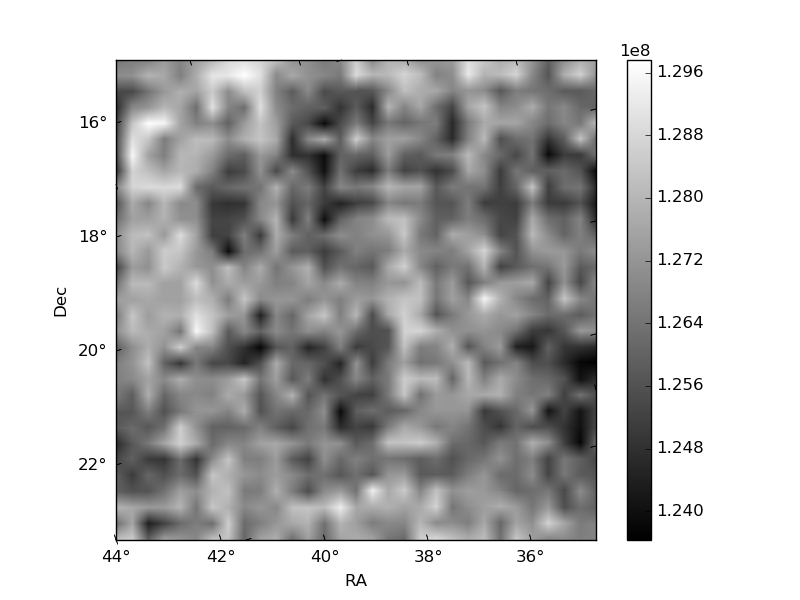
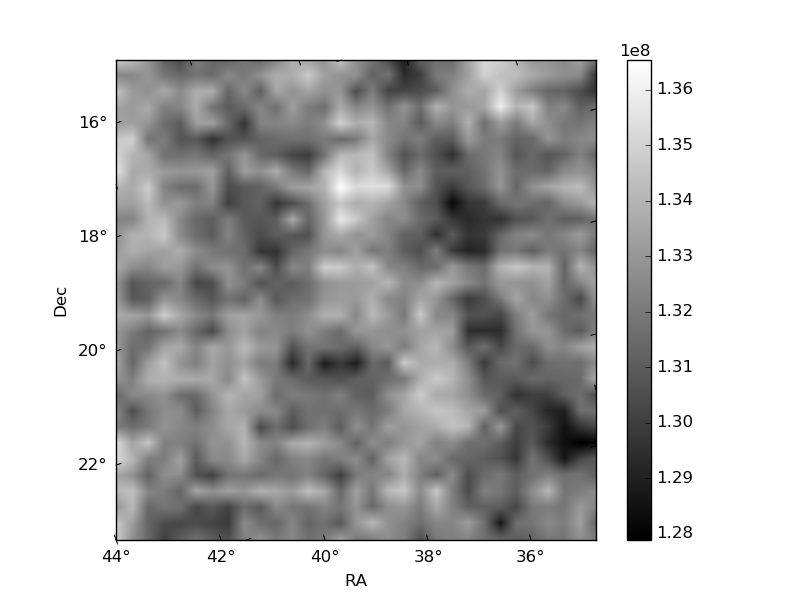
Histogram calculated using DETX and DETY for each event in the final _common_clean file
| Quadrant A | 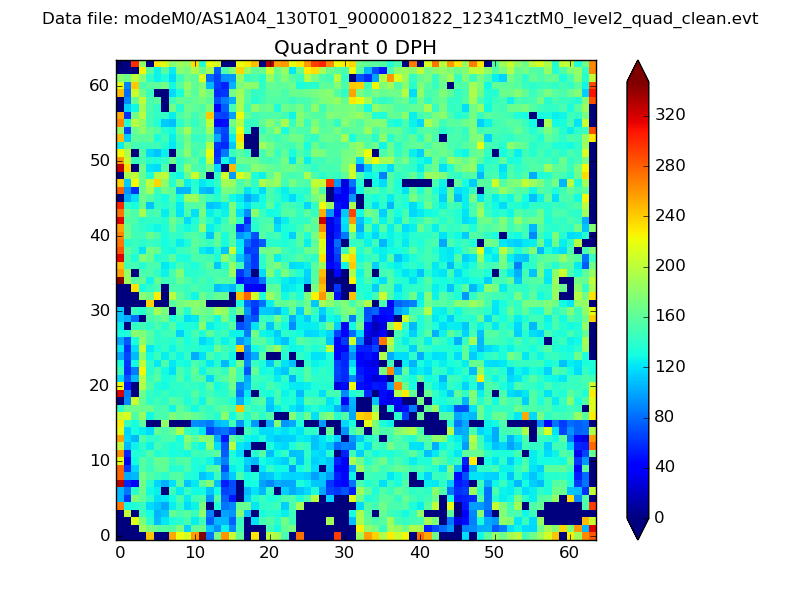 |
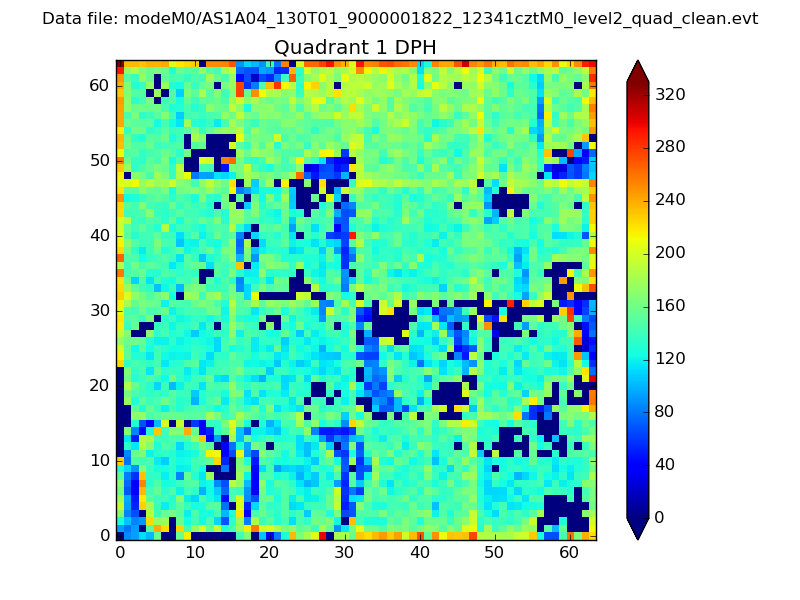 |
Quadrant B |
|---|---|---|---|
| Quadrant D | 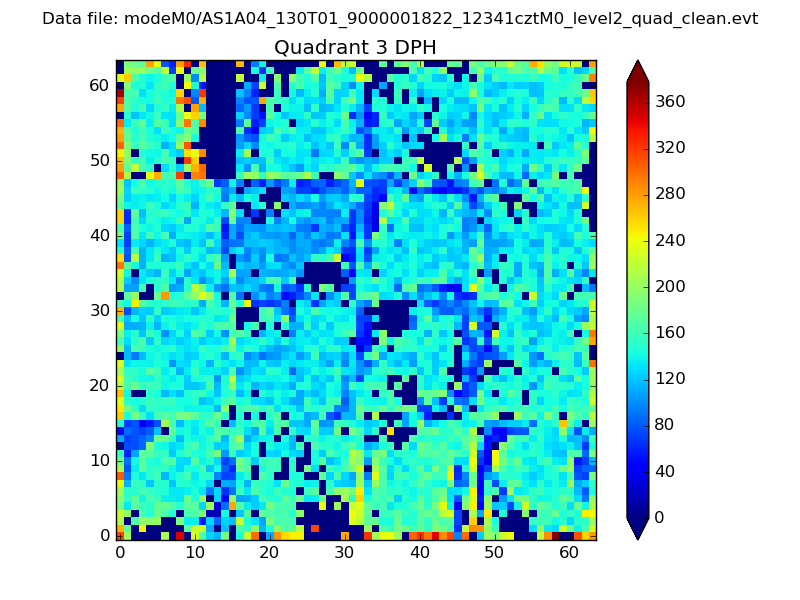 |
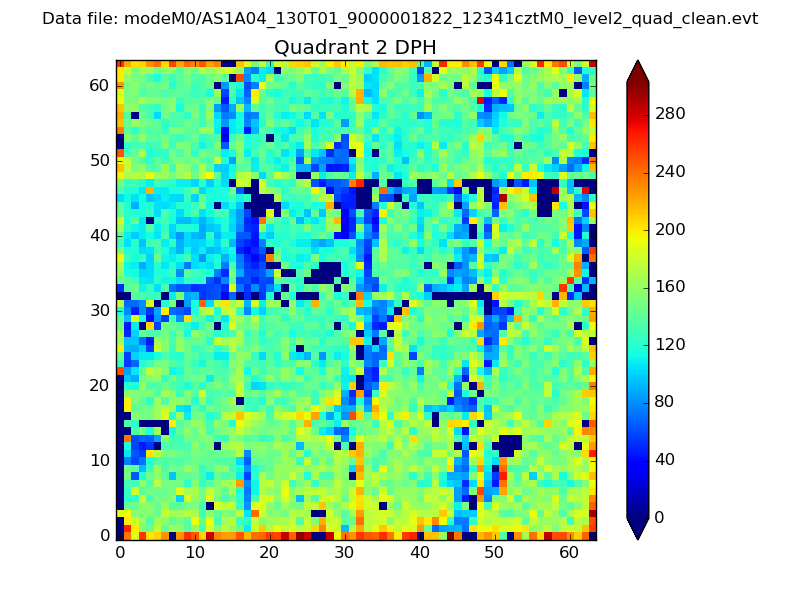 |
Quadrant C |
| Plot type | Count rate plots | Images |
|---|---|---|
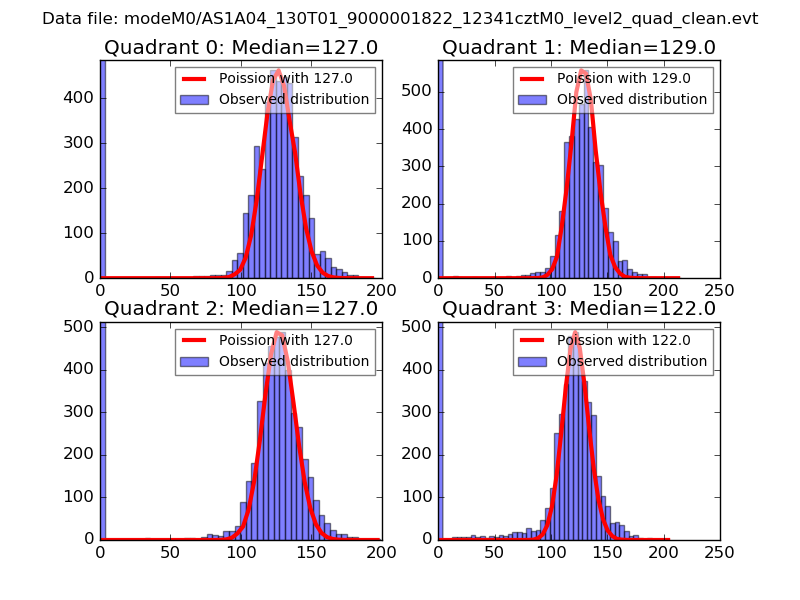
| Comparison with Poisson distribution Blue bars denote a histogram of data divided into 1 sec bins. Red curve is a Poisson curve with rate = median count rate of data. |
 |
 |
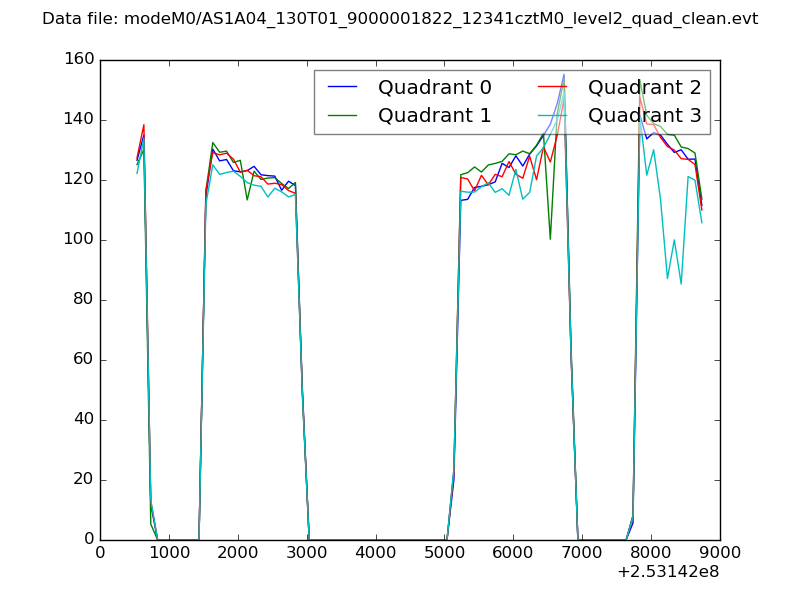
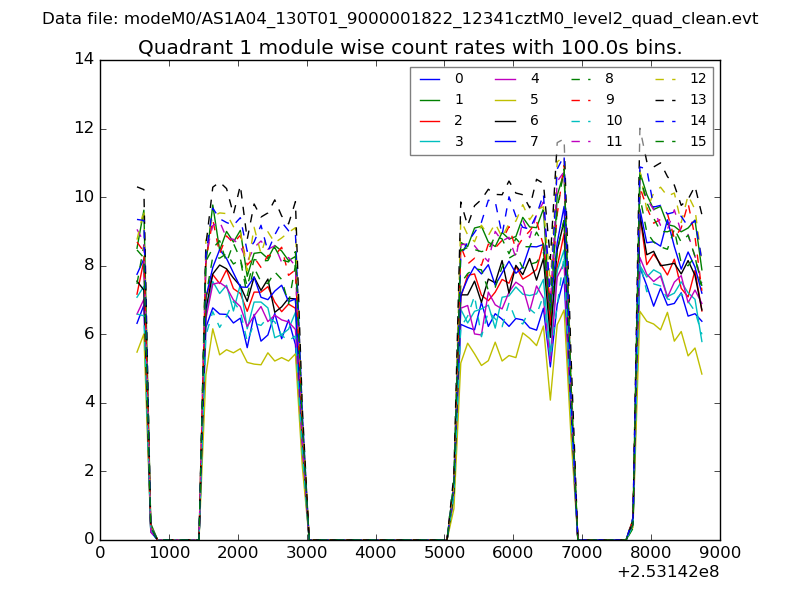
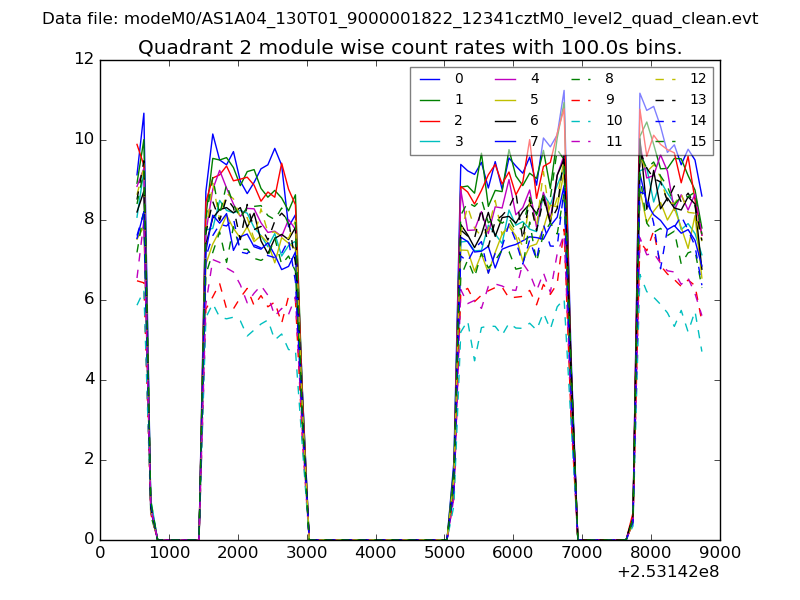
| Quadrant-wise count rates Data is divided into 100 sec bins |
 |
|
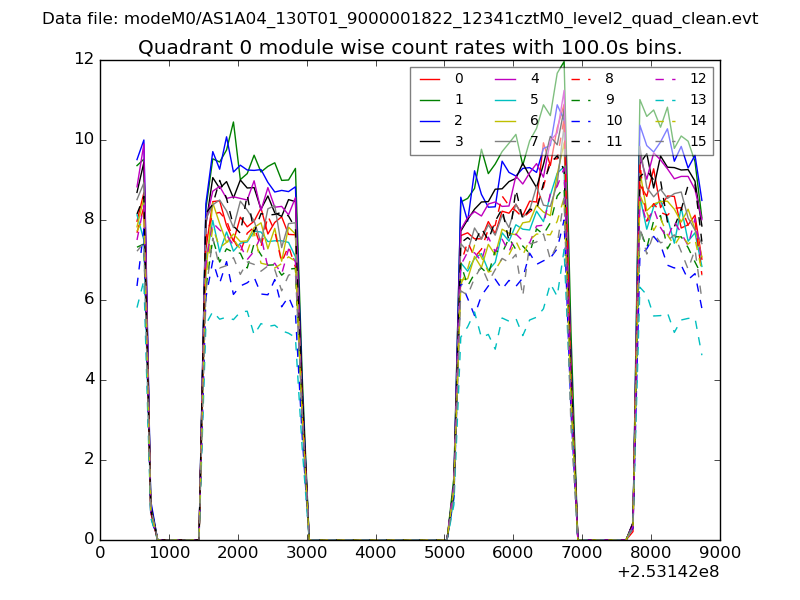
| Module-wise count rates for Quadrant A Data is divided into 100 sec bins |
 |
 |
| Module-wise count rates for Quadrant B Data is divided into 100 sec bins |
 |
 |
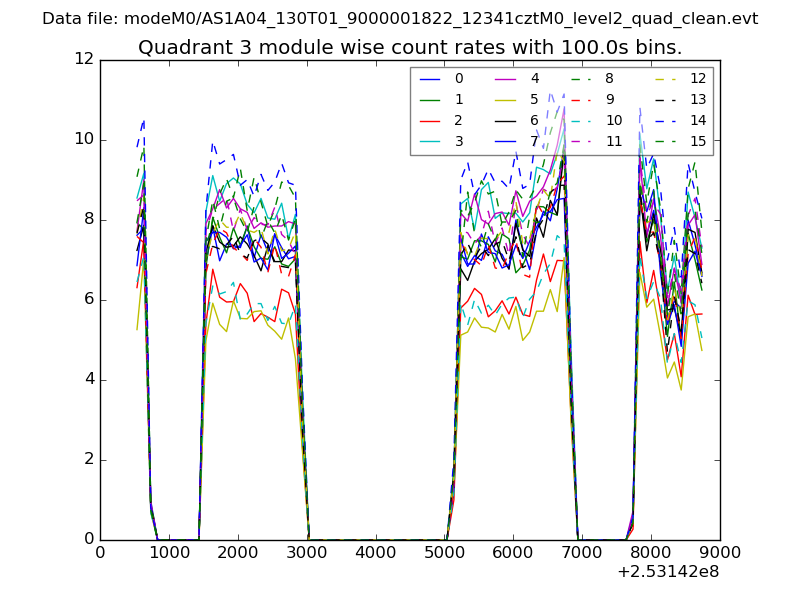
| Module-wise count rates for Quadrant C Data is divided into 100 sec bins |
 |
 |
| Module-wise count rates for Quadrant D Data is divided into 100 sec bins |
 |
 |
| Parameter | Plot |
|---|---|
| CZT HV Monitor | 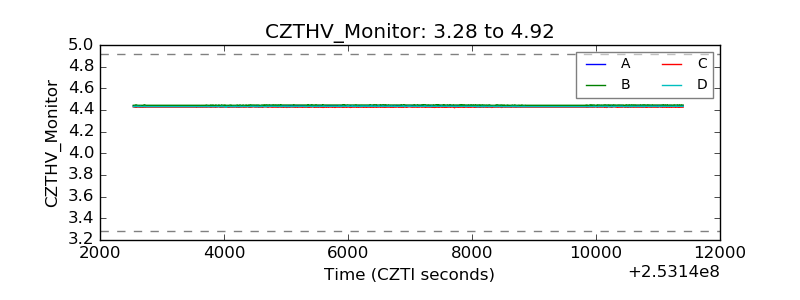 |
| D_VDD | 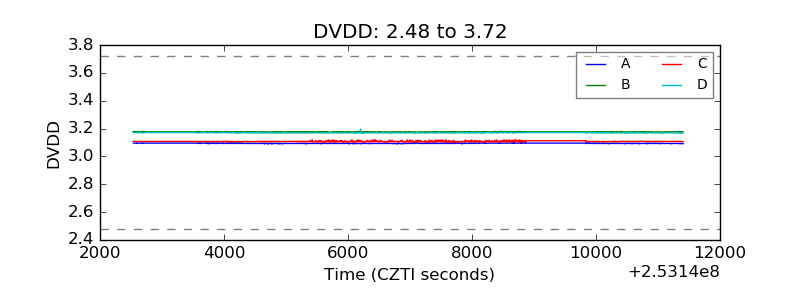 |
| Temperature 1 | 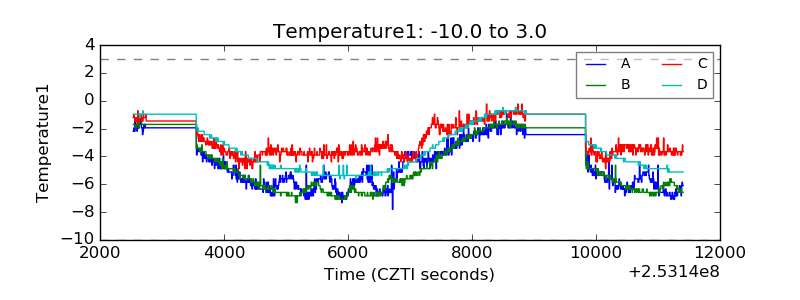 |
| Veto HV Monitor | 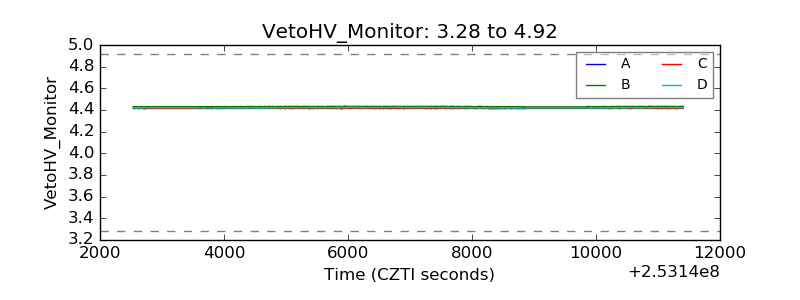 |
| Veto LLD | 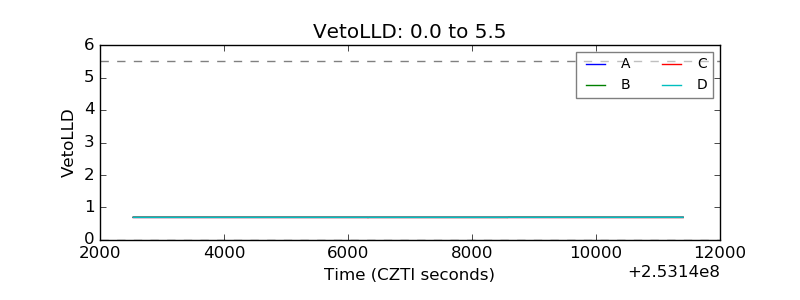 |
| Alpha Counter | 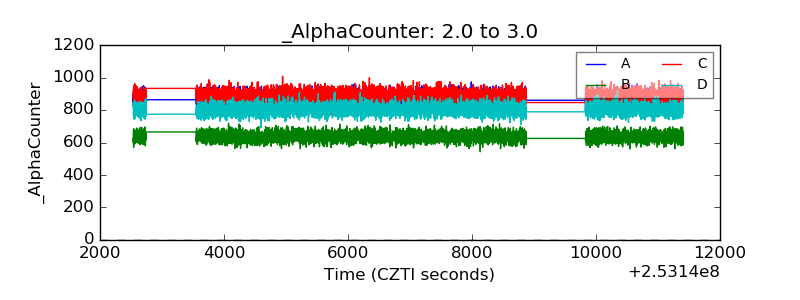 |
| _CPM_Rate | 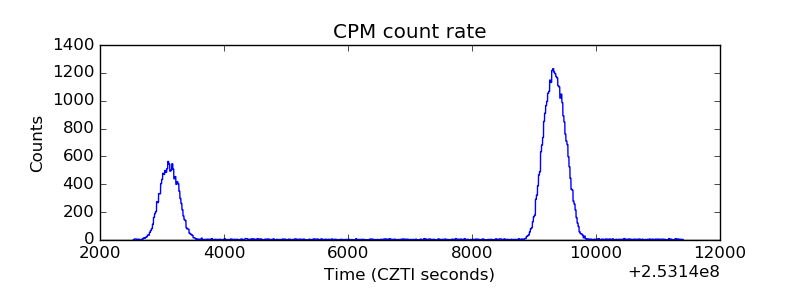 |
| CZT Counter | 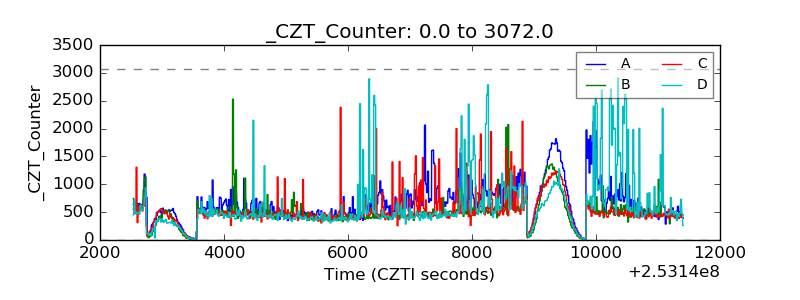 |
| +2.5 Volts monitor |  |
| +5 Volts monitor |  |
| _ROLL_ROT | 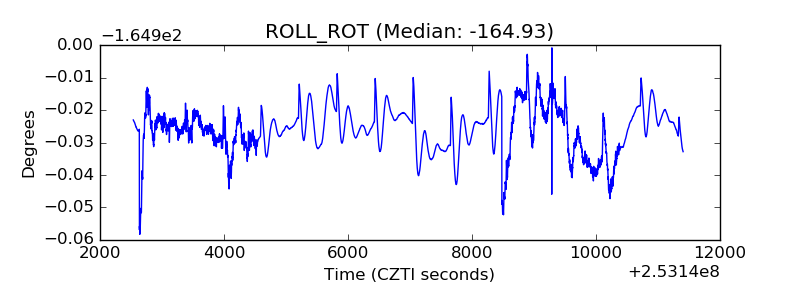 |
| _Roll_DEC | 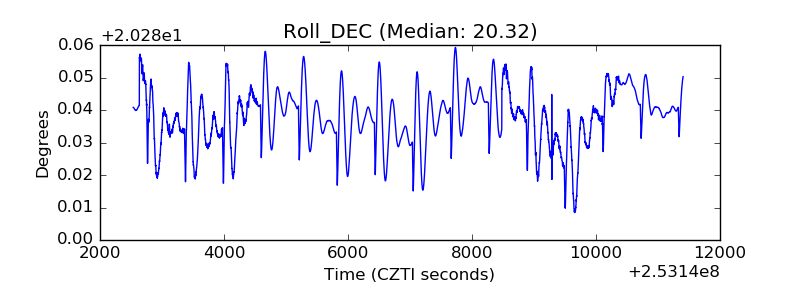 |
| _Roll_RA | 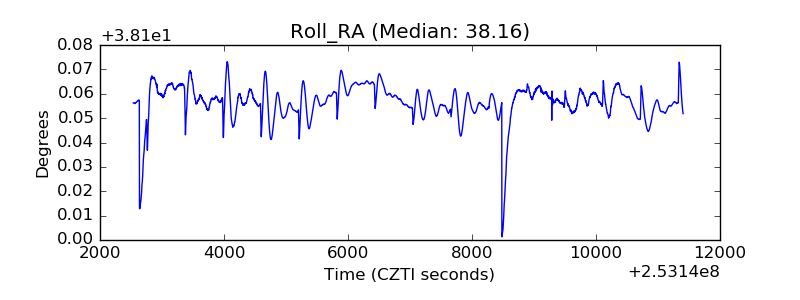 |
| Veto Counter | 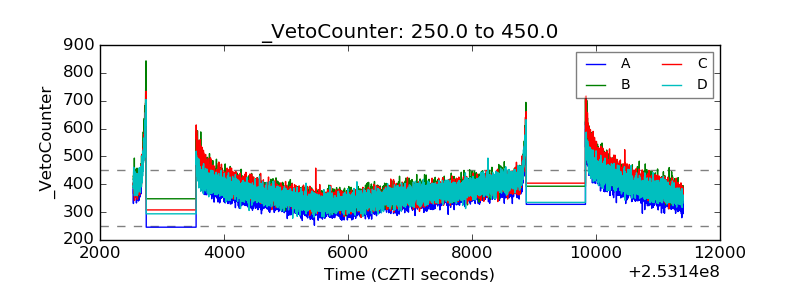 |