| Param | Original file | Final file |
|---|---|---|
| Filename | modeM0/AS1A04_130T01_9000001822_12343cztM0_level2.evt | modeM0/AS1A04_130T01_9000001822_12343cztM0_level2_quad_clean.evt |
| Size (bytes) | 566,478,720 | 76,512,960 |
| Size | 540.2 MB | 73.0 MB |
| Events in quadrant A | 4,446,271 | 469,140 |
| Events in quadrant B | 3,510,878 | 474,349 |
| Events in quadrant C | 3,134,181 | 471,232 |
| Events in quadrant D | 5,606,787 | 431,122 |
| Mode M9 | |||
|---|---|---|---|
| Quadrant | BADHDUFLAG | Total packets | Discarded packets |
| A | 0 | 21 | 0 |
| B | 0 | 21 | 0 |
| C | 0 | 21 | 0 |
| D | 0 | 21 | 0 |
| Mode M0 | |||
|---|---|---|---|
| Quadrant | BADHDUFLAG | Total packets | Discarded packets |
| A | 0 | 17786 | 3 |
| B | 0 | 14826 | 2 |
| C | 0 | 13831 | 2 |
| D | 0 | 21286 | 2 |
| Mode SS | |||
|---|---|---|---|
| Quadrant | BADHDUFLAG | Total packets | Discarded packets |
| A | 0 | 138 | 0 |
| B | 0 | 138 | 0 |
| C | 0 | 138 | 0 |
| D | 0 | 138 | 0 |
| Quadrant | Total seconds | Saturated seconds | Saturation percentage |
|---|---|---|---|
| A | 6759 | 116 | 1.716230% |
| B | 6759 | 98 | 1.449919% |
| C | 6759 | 20 | 0.295902% |
| D | 6759 | 664 | 9.823938% |
Noise dominated data is calculated using 1-second bins in cleaned event files. If a bin has >2000 counts, and if more than 50% of those come from <1% of pixels, then it is considered to be noise-dominated and hence unusable.
| Quadrant | # 1 sec bins | Bins with >0 counts | Bins with >2000 counts | High rate bins dominated by noise | Noise dominated (total time) | Noise dominated (detector-on time) | Marked lightcurve |
|---|---|---|---|---|---|---|---|
| A | 8825 | 6762 | 20 | 20 | 0.23% | 0.30% | 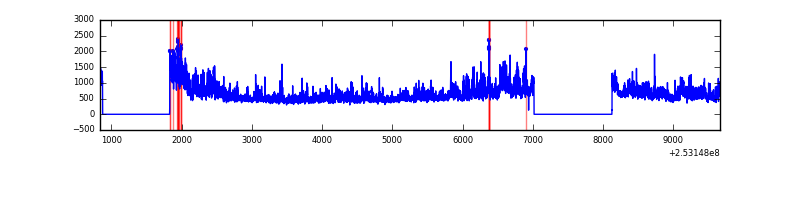 |
| B | 8825 | 6762 | 43 | 43 | 0.49% | 0.64% | 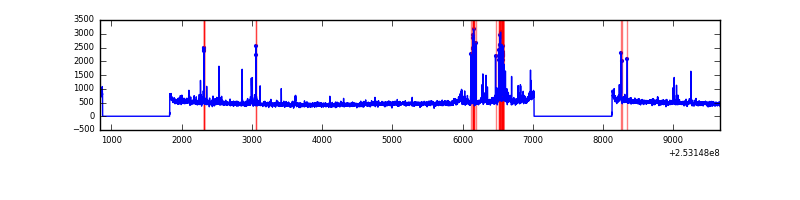 |
| C | 8825 | 6762 | 0 | 0 | 0.00% | 0.00% | 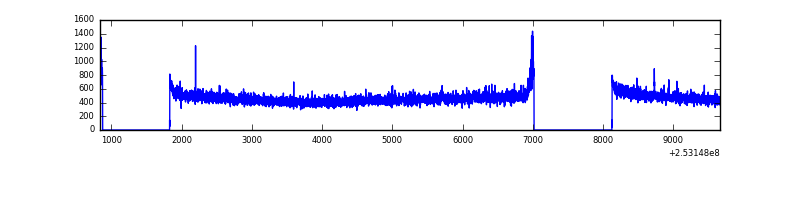 |
| D | 8825 | 6762 | 547 | 547 | 6.20% | 8.09% | 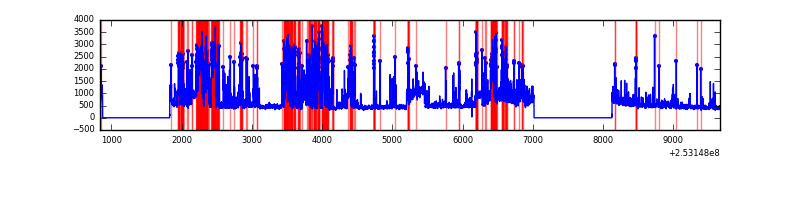 |
Top three noisy pixels from each quadrant. If the there are fewer than three noisy pixels in the level2.evt file, extra rows are filled as -1
| Pixel properties | Quadrant properties | ||||||
|---|---|---|---|---|---|---|---|
| Quadrant | DetID | PixID | Counts | Sigma | Mean | Median | Sigma |
| A | 8 | 15 | 493887 | 2964.93 | 810 | 794 | 166.3 |
| A | 13 | 251 | 322354 | 1933.52 | 810 | 794 | 166.3 |
| A | 1 | 162 | 205317 | 1229.78 | 810 | 794 | 166.3 |
| B | 4 | 239 | 189129 | 1196.84 | 816 | 797 | 157.4 |
| B | 3 | 64 | 45972 | 287.08 | 816 | 797 | 157.4 |
| B | 0 | 219 | 34379 | 213.41 | 816 | 797 | 157.4 |
| C | 4 | 112 | 24512 | 128.46 | 793 | 797 | 184.6 |
| C | 15 | 208 | 11713 | 59.13 | 793 | 797 | 184.6 |
| C | 13 | 61 | 5858 | 27.41 | 793 | 797 | 184.6 |
| D | 1 | 52 | 2366658 | 13019.67 | 755 | 735 | 181.7 |
| D | 5 | 222 | 106388 | 581.41 | 755 | 735 | 181.7 |
| D | 13 | 249 | 54280 | 294.66 | 755 | 735 | 181.7 |
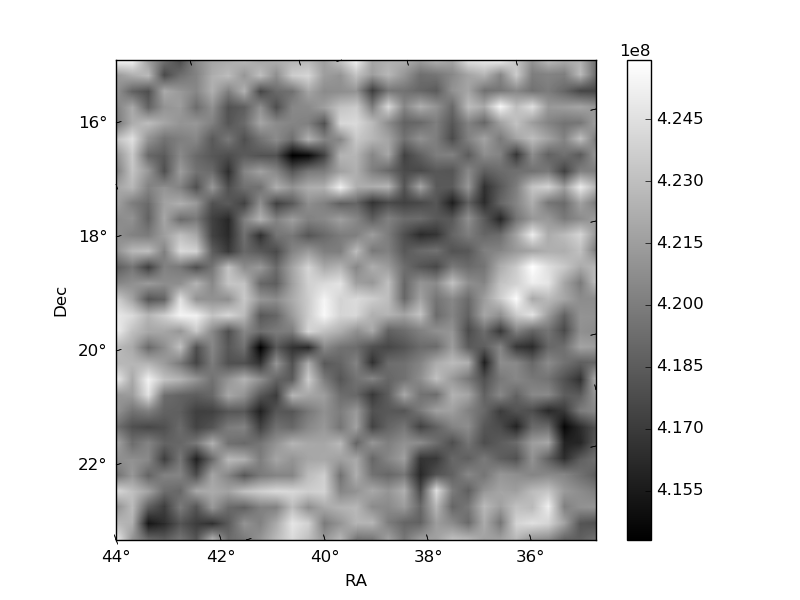
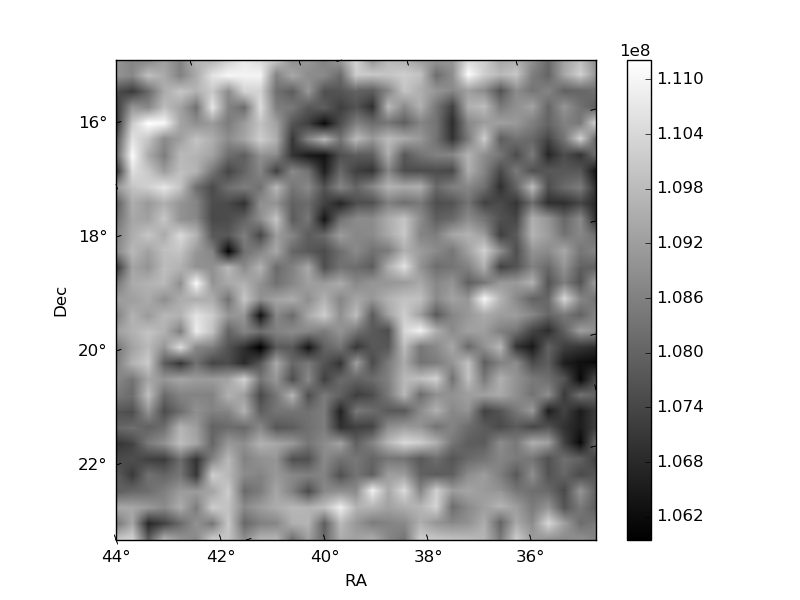
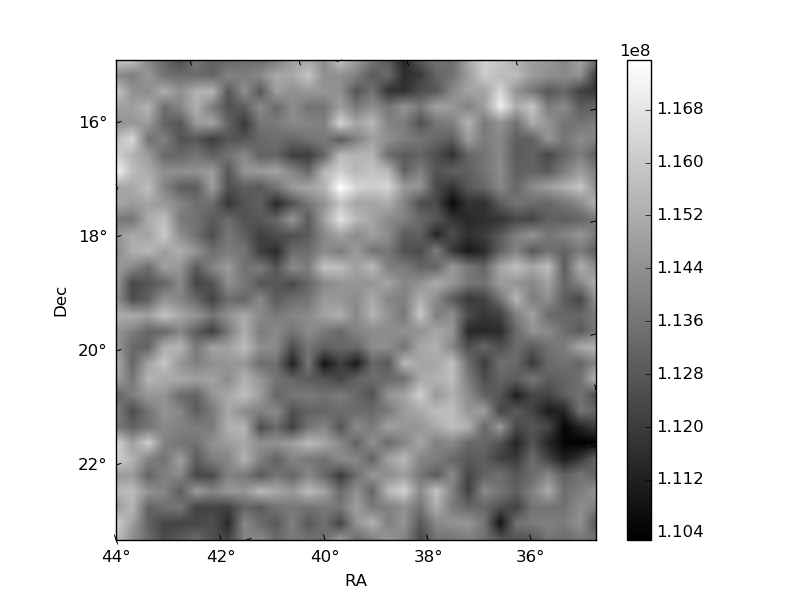
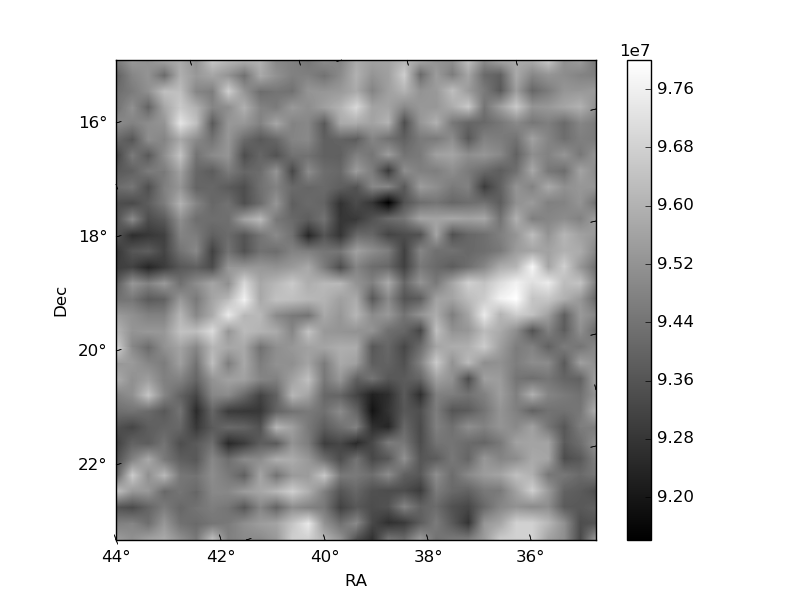
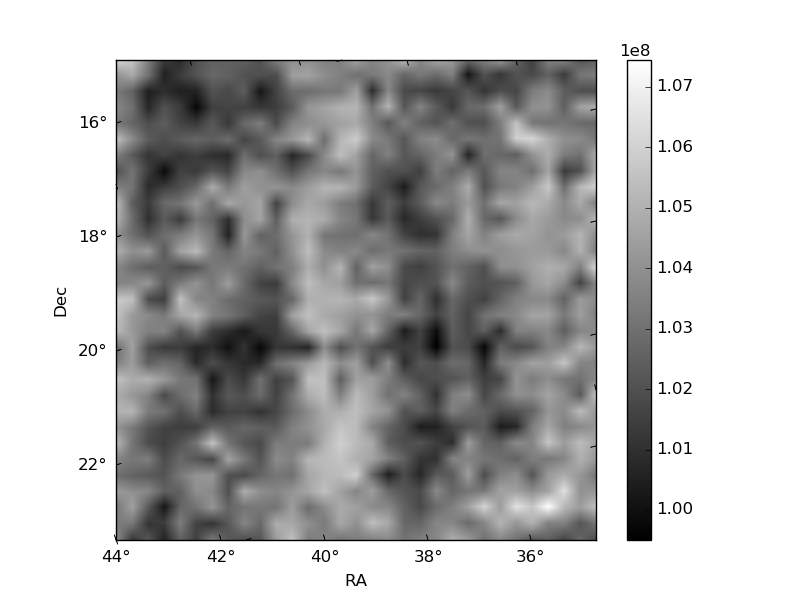
Histogram calculated using DETX and DETY for each event in the final _common_clean file
| Quadrant A | 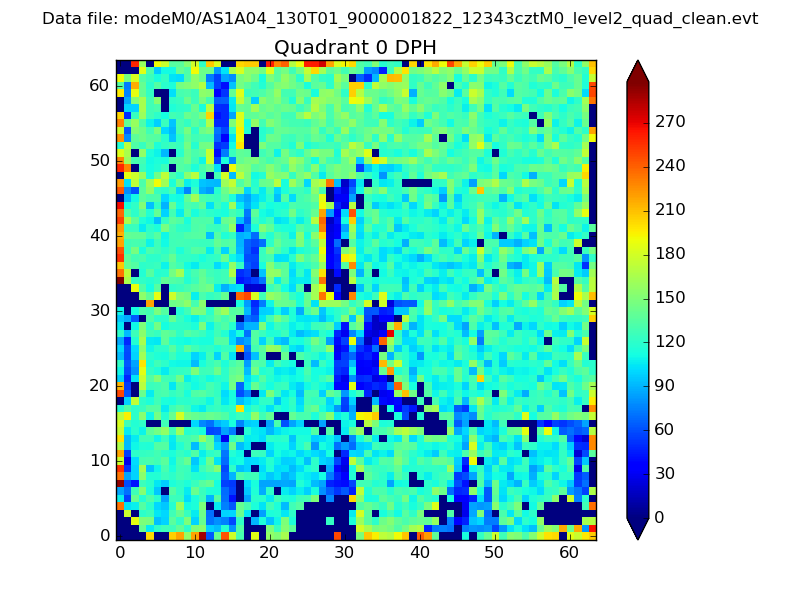 |
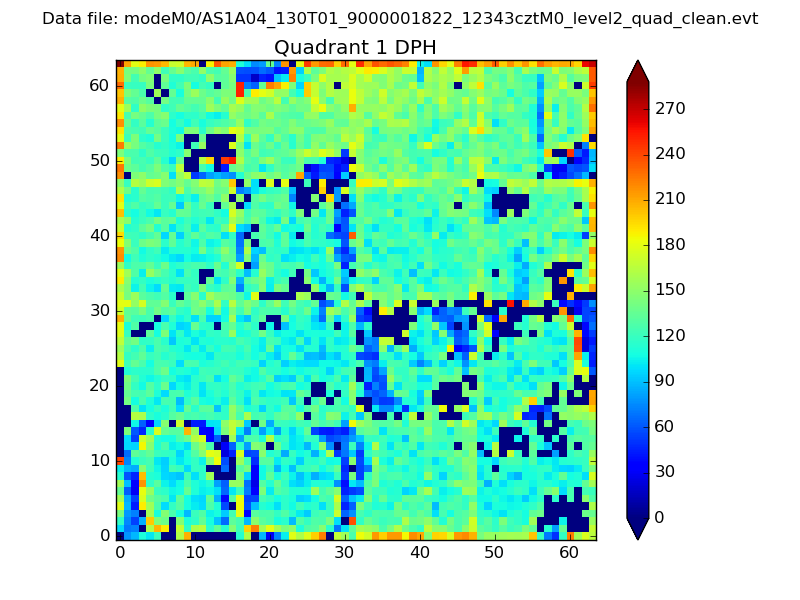 |
Quadrant B |
|---|---|---|---|
| Quadrant D | 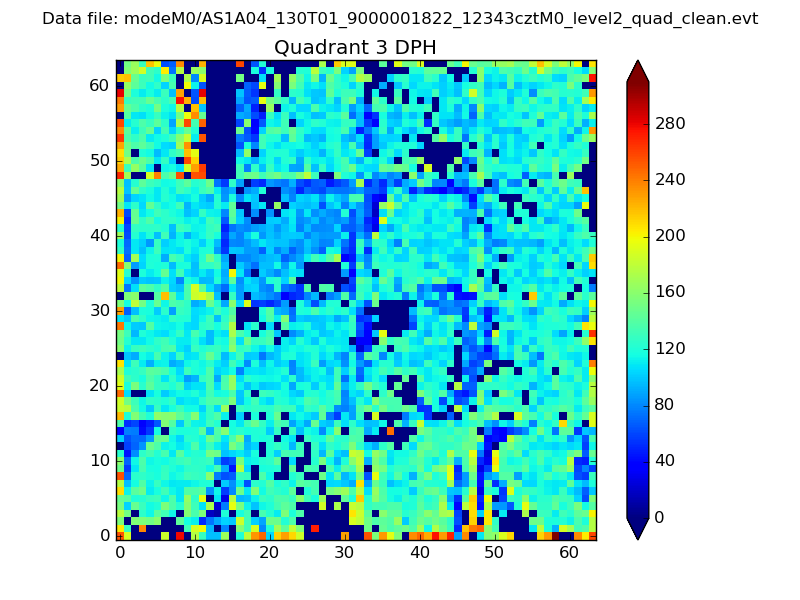 |
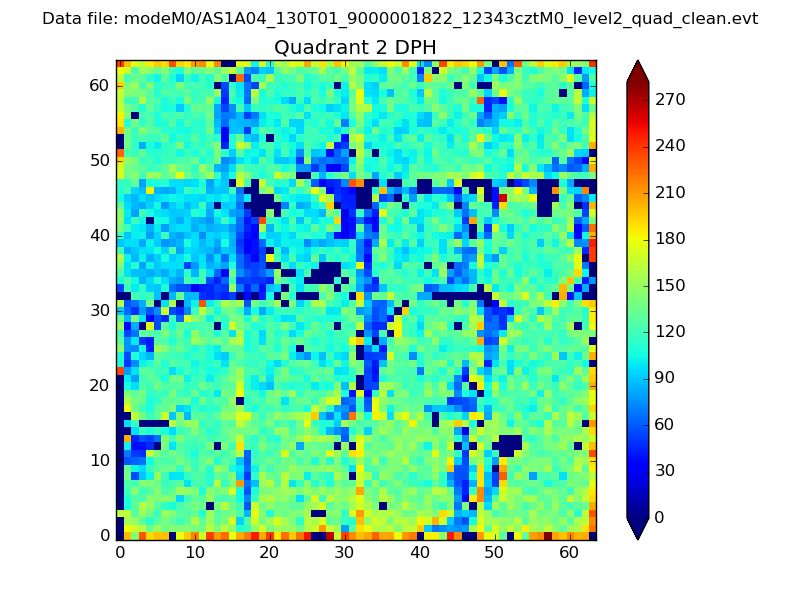 |
Quadrant C |
| Plot type | Count rate plots | Images |
|---|---|---|
| Comparison with Poisson distribution Blue bars denote a histogram of data divided into 1 sec bins. Red curve is a Poisson curve with rate = median count rate of data. |
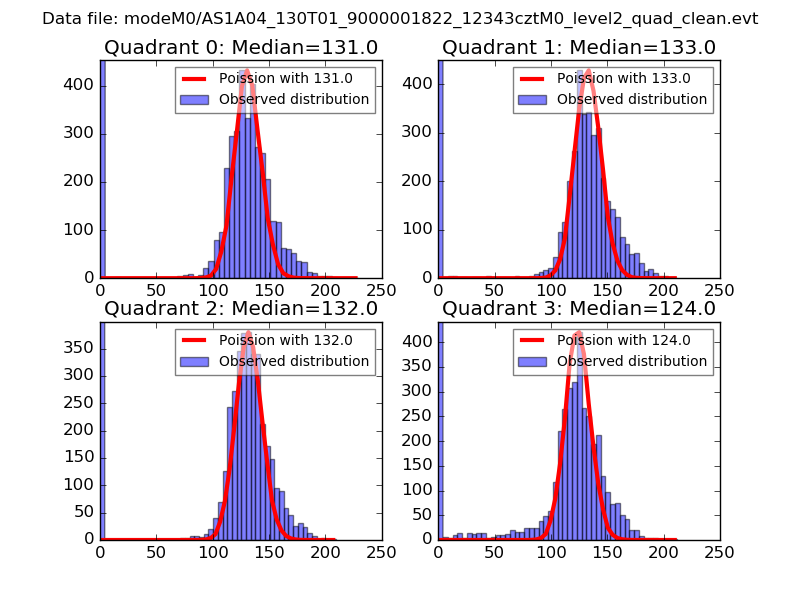 |
 |
| Quadrant-wise count rates Data is divided into 100 sec bins |
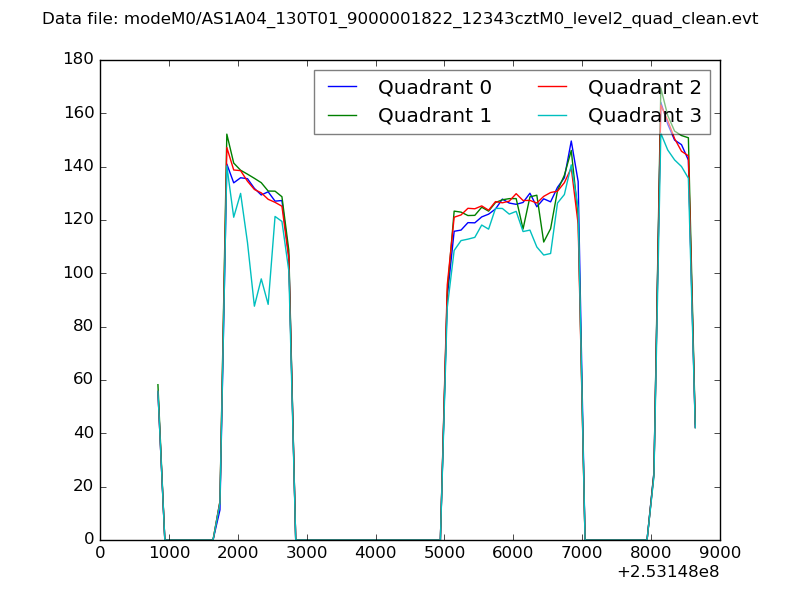 |
|
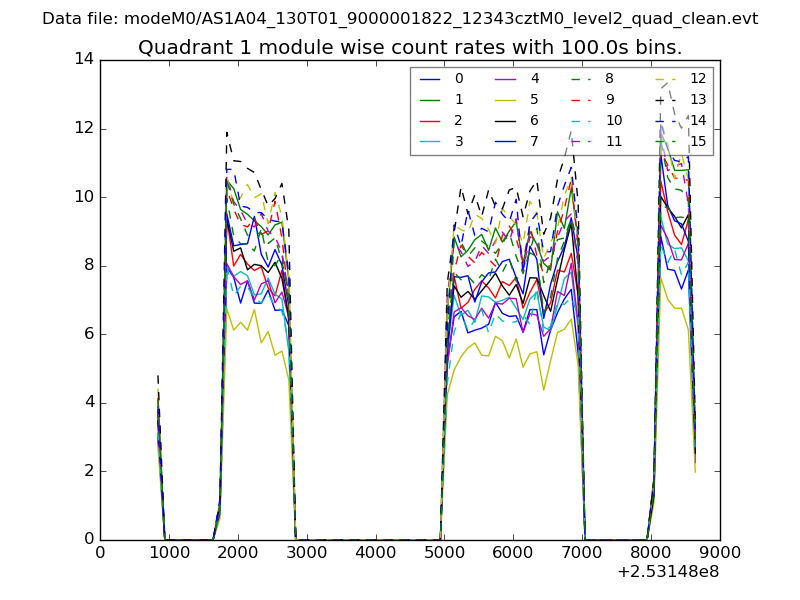
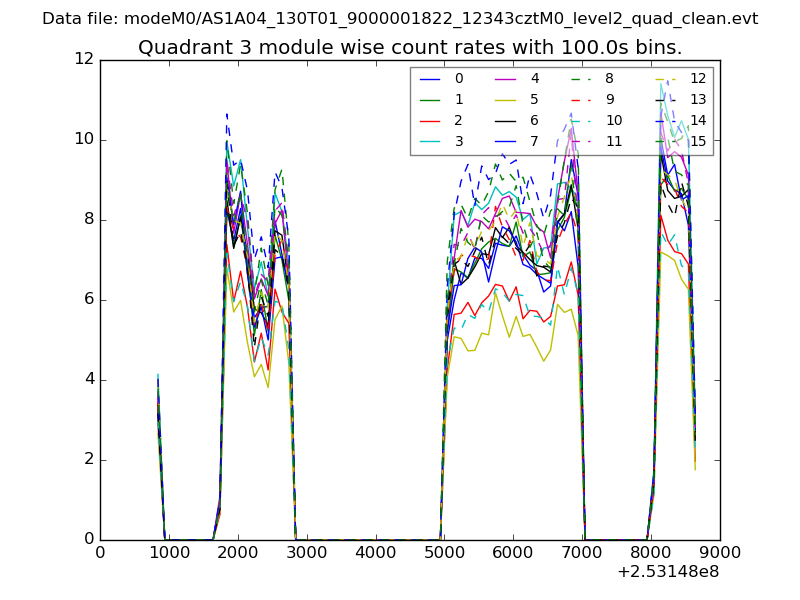
| Module-wise count rates for Quadrant A Data is divided into 100 sec bins |
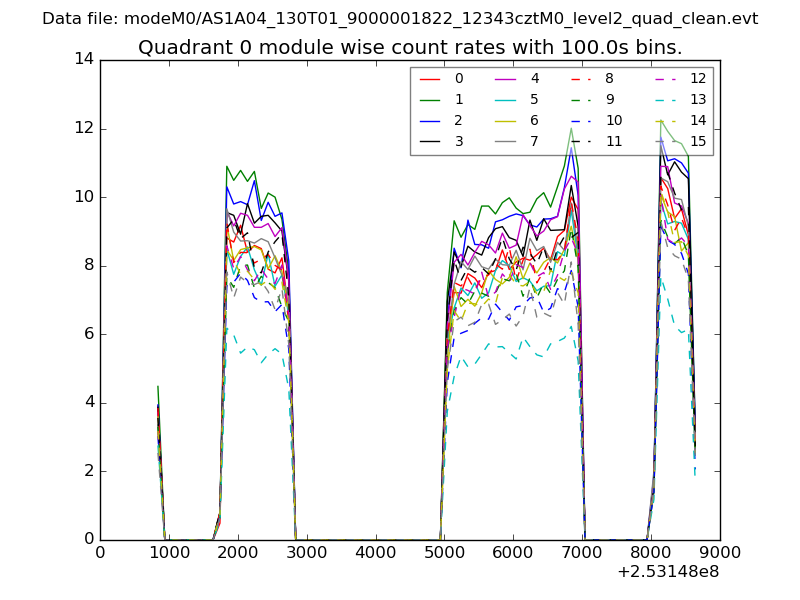 |
 |
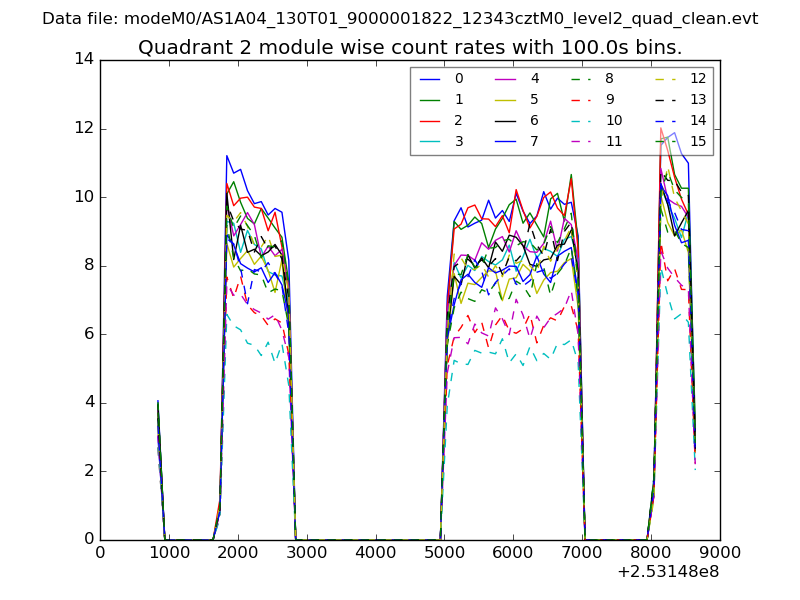
| Module-wise count rates for Quadrant B Data is divided into 100 sec bins |
 |
 |
| Module-wise count rates for Quadrant C Data is divided into 100 sec bins |
 |
 |
| Module-wise count rates for Quadrant D Data is divided into 100 sec bins |
 |
 |
| Parameter | Plot |
|---|---|
| CZT HV Monitor | 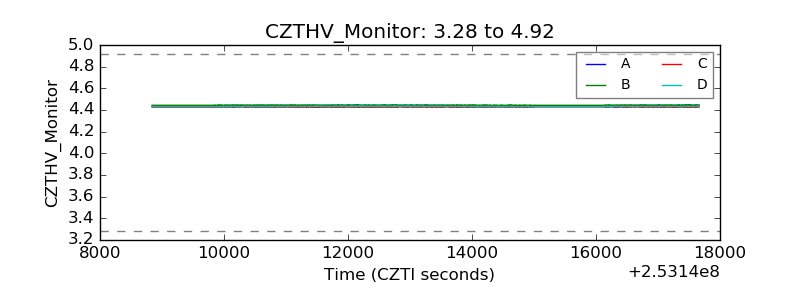 |
| D_VDD | 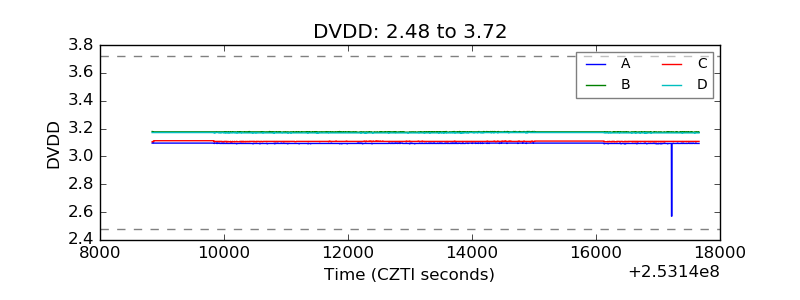 |
| Temperature 1 | 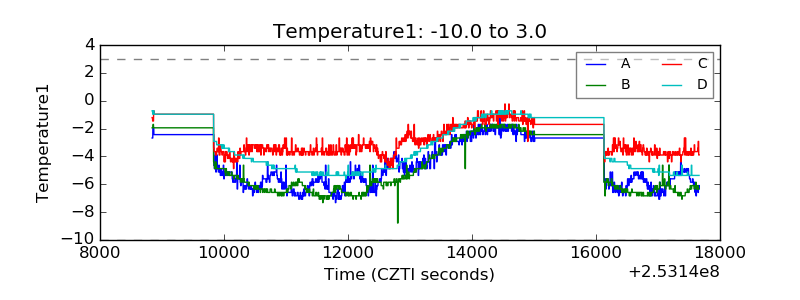 |
| Veto HV Monitor | 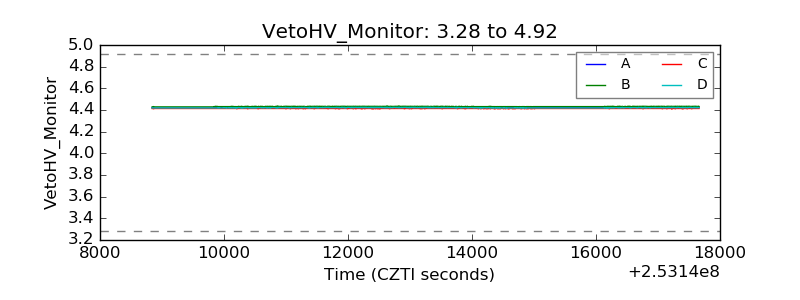 |
| Veto LLD | 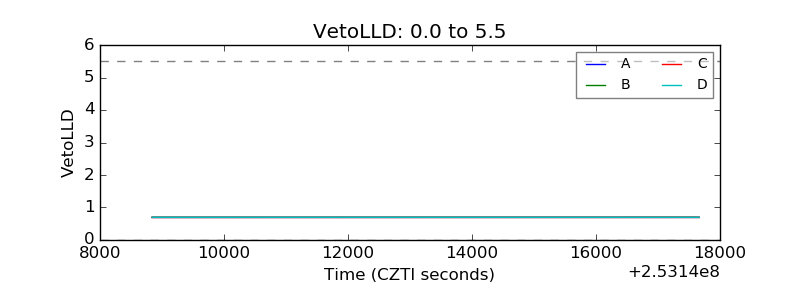 |
| Alpha Counter | 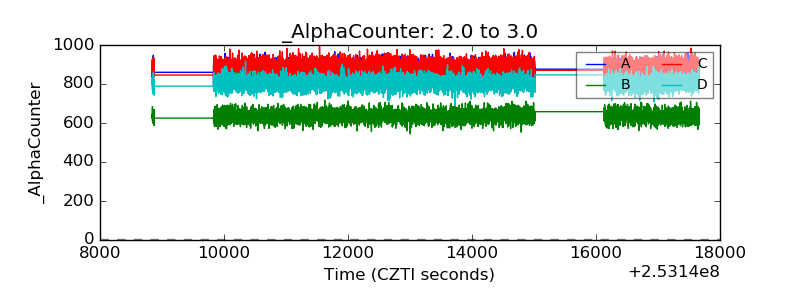 |
| _CPM_Rate | 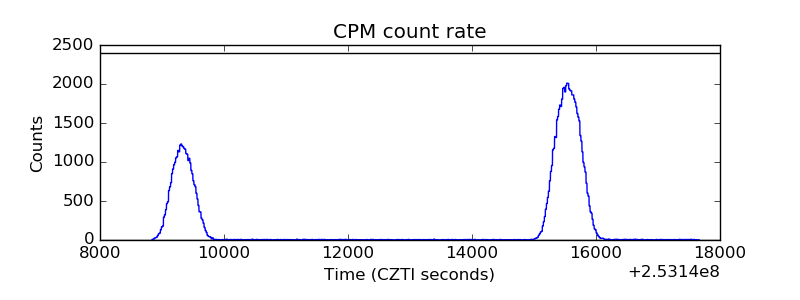 |
| CZT Counter | 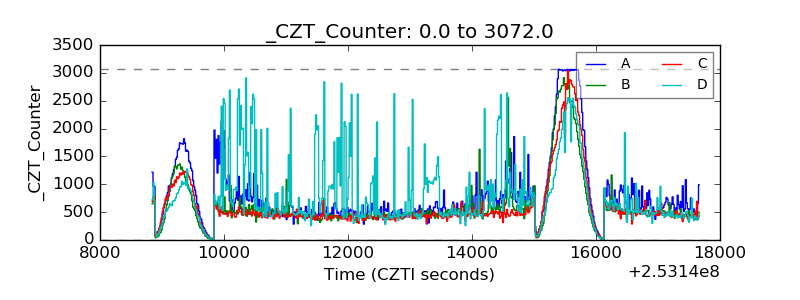 |
| +2.5 Volts monitor | 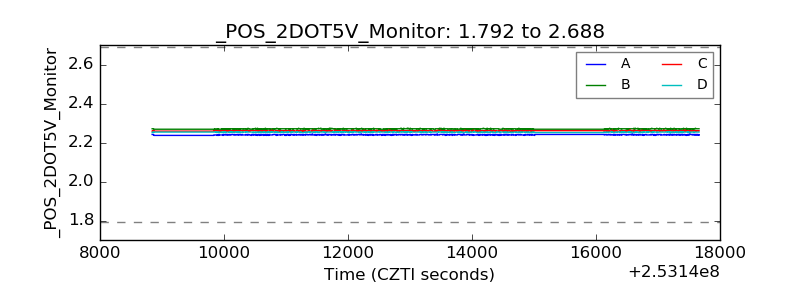 |
| +5 Volts monitor |  |
| _ROLL_ROT |  |
| _Roll_DEC |  |
| _Roll_RA | 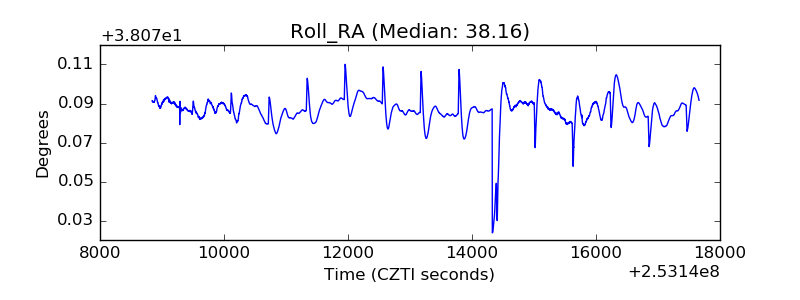 |
| Veto Counter | 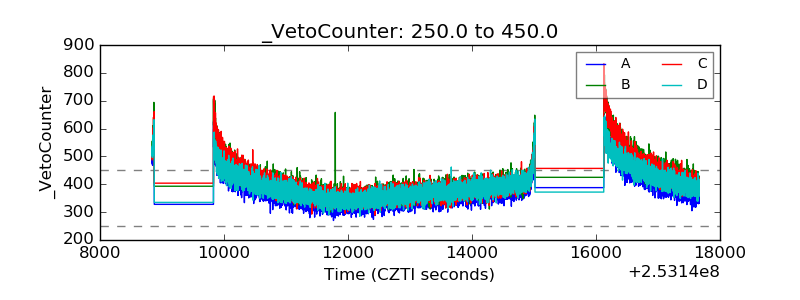 |