| Param | Original file | Final file |
|---|---|---|
| Filename | modeM0/AS1A04_130T01_9000001822_12344cztM0_level2.evt | modeM0/AS1A04_130T01_9000001822_12344cztM0_level2_quad_clean.evt |
| Size (bytes) | 492,500,160 | 66,954,240 |
| Size | 469.7 MB | 63.9 MB |
| Events in quadrant A | 4,722,188 | 394,401 |
| Events in quadrant B | 3,387,941 | 403,071 |
| Events in quadrant C | 3,054,590 | 399,256 |
| Events in quadrant D | 3,313,433 | 380,914 |
| Mode M9 | |||
|---|---|---|---|
| Quadrant | BADHDUFLAG | Total packets | Discarded packets |
| A | 0 | 20 | 0 |
| B | 0 | 20 | 0 |
| C | 0 | 20 | 0 |
| D | 0 | 21 | 0 |
| Mode M0 | |||
|---|---|---|---|
| Quadrant | BADHDUFLAG | Total packets | Discarded packets |
| A | 0 | 18492 | 3 |
| B | 0 | 14056 | 2 |
| C | 0 | 13243 | 2 |
| D | 0 | 14195 | 2 |
| Mode SS | |||
|---|---|---|---|
| Quadrant | BADHDUFLAG | Total packets | Discarded packets |
| A | 0 | 130 | 0 |
| B | 0 | 130 | 0 |
| C | 0 | 130 | 0 |
| D | 0 | 130 | 0 |
| Quadrant | Total seconds | Saturated seconds | Saturation percentage |
|---|---|---|---|
| A | 6446 | 124 | 1.923674% |
| B | 6446 | 53 | 0.822215% |
| C | 6446 | 14 | 0.217189% |
| D | 6446 | 70 | 1.085945% |
Noise dominated data is calculated using 1-second bins in cleaned event files. If a bin has >2000 counts, and if more than 50% of those come from <1% of pixels, then it is considered to be noise-dominated and hence unusable.
| Quadrant | # 1 sec bins | Bins with >0 counts | Bins with >2000 counts | High rate bins dominated by noise | Noise dominated (total time) | Noise dominated (detector-on time) | Marked lightcurve |
|---|---|---|---|---|---|---|---|
| A | 7652 | 6448 | 24 | 24 | 0.31% | 0.37% | 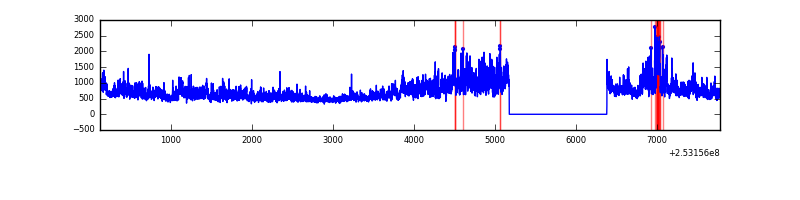 |
| B | 7652 | 6448 | 14 | 14 | 0.18% | 0.22% | 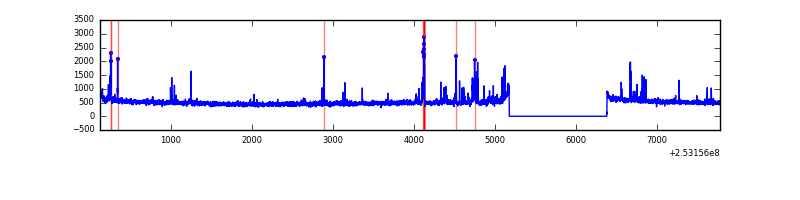 |
| C | 7652 | 6448 | 0 | 0 | 0.00% | 0.00% | 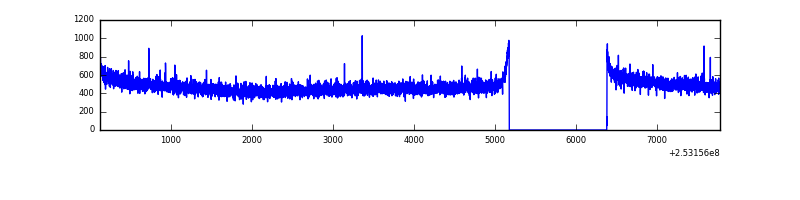 |
| D | 7652 | 6448 | 50 | 50 | 0.65% | 0.78% | 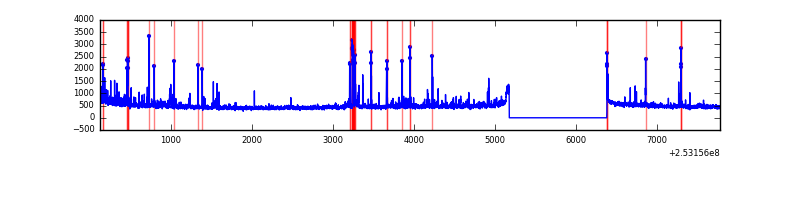 |
Top three noisy pixels from each quadrant. If the there are fewer than three noisy pixels in the level2.evt file, extra rows are filled as -1
| Pixel properties | Quadrant properties | ||||||
|---|---|---|---|---|---|---|---|
| Quadrant | DetID | PixID | Counts | Sigma | Mean | Median | Sigma |
| A | 8 | 15 | 904376 | 5589.65 | 800 | 784 | 161.7 |
| A | 13 | 251 | 291715 | 1799.71 | 800 | 784 | 161.7 |
| A | 1 | 162 | 181487 | 1117.83 | 800 | 784 | 161.7 |
| B | 4 | 239 | 126454 | 821.05 | 808 | 791 | 153.1 |
| B | 3 | 64 | 32596 | 207.81 | 808 | 791 | 153.1 |
| B | 0 | 197 | 27976 | 177.62 | 808 | 791 | 153.1 |
| C | 15 | 208 | 6472 | 31.56 | 781 | 789 | 180.1 |
| C | 13 | 61 | 5760 | 27.61 | 781 | 789 | 180.1 |
| C | 8 | 222 | 2503 | 9.52 | 781 | 789 | 180.1 |
| D | 1 | 52 | 186659 | 1016.42 | 772 | 753 | 182.9 |
| D | 10 | 253 | 52177 | 281.16 | 772 | 753 | 182.9 |
| D | 5 | 222 | 35393 | 189.39 | 772 | 753 | 182.9 |
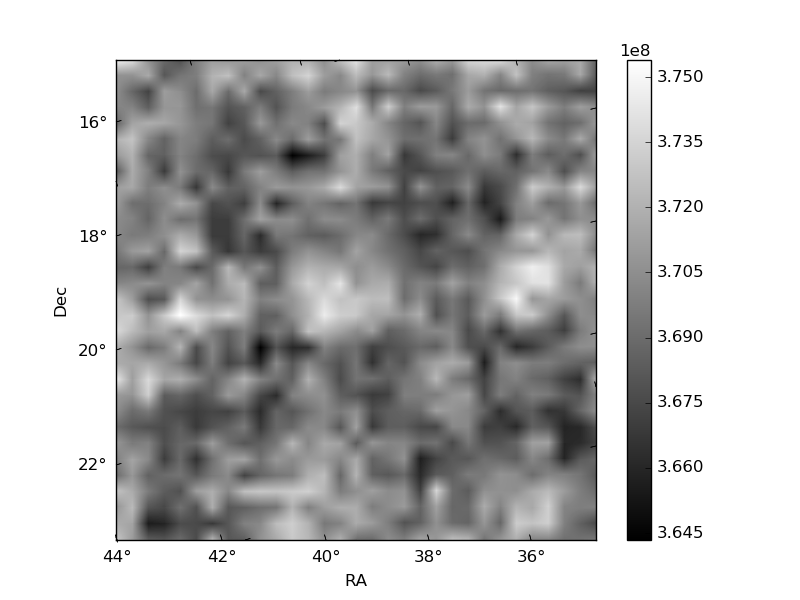
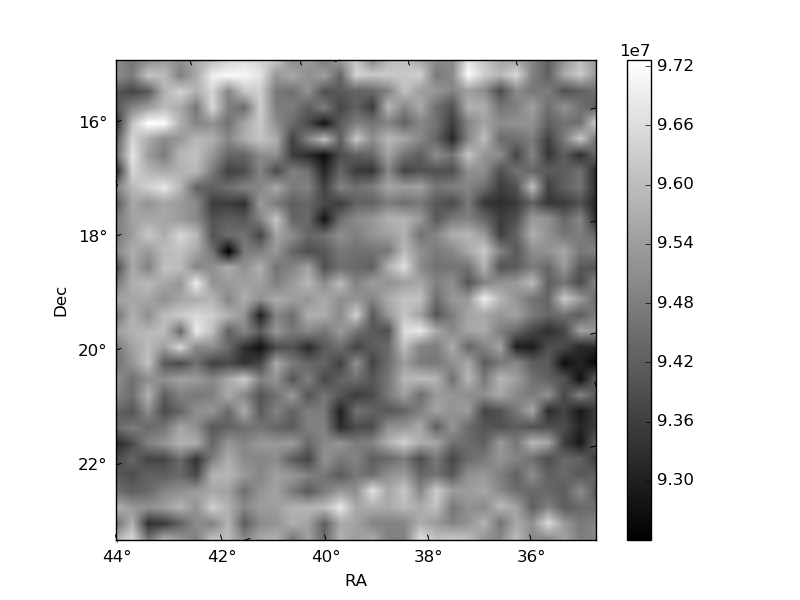
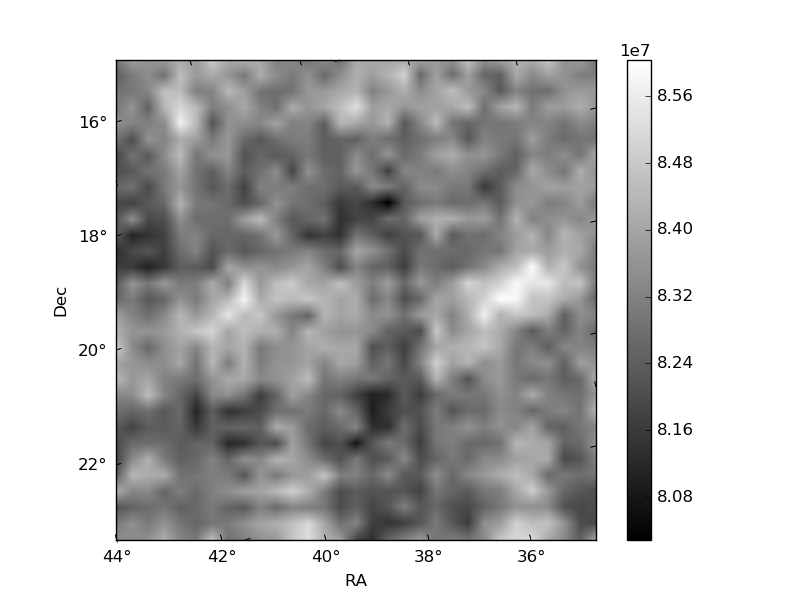
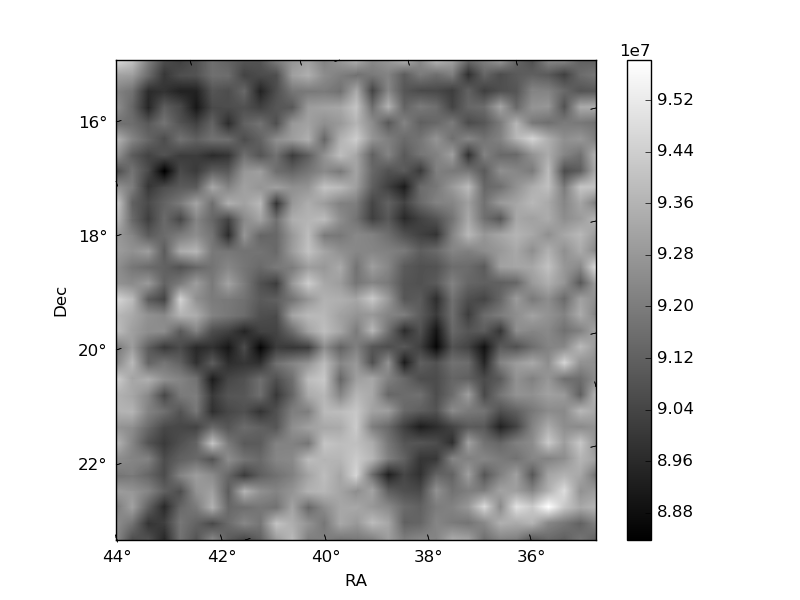
Histogram calculated using DETX and DETY for each event in the final _common_clean file
| Quadrant A | 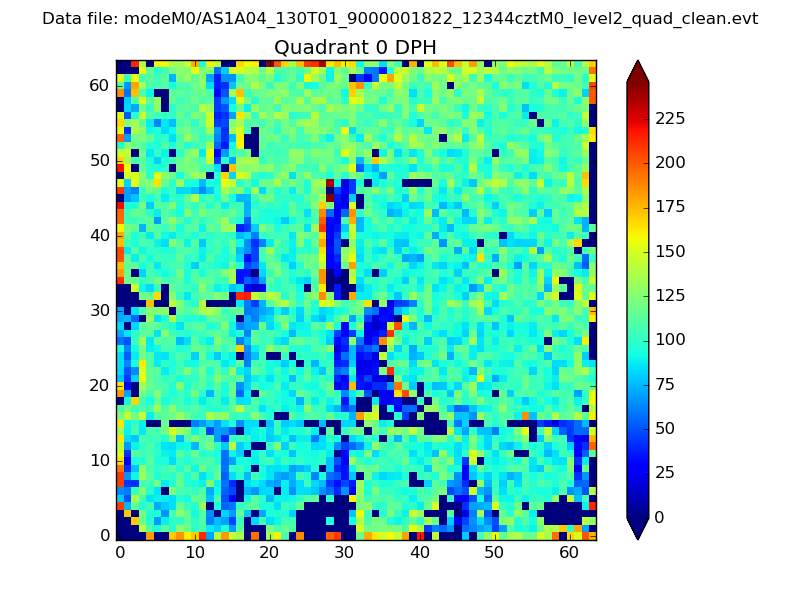 |
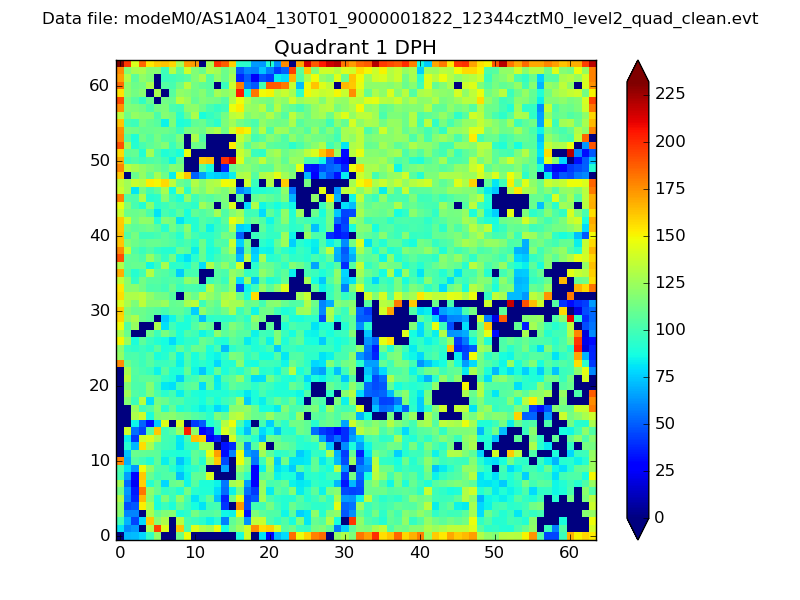 |
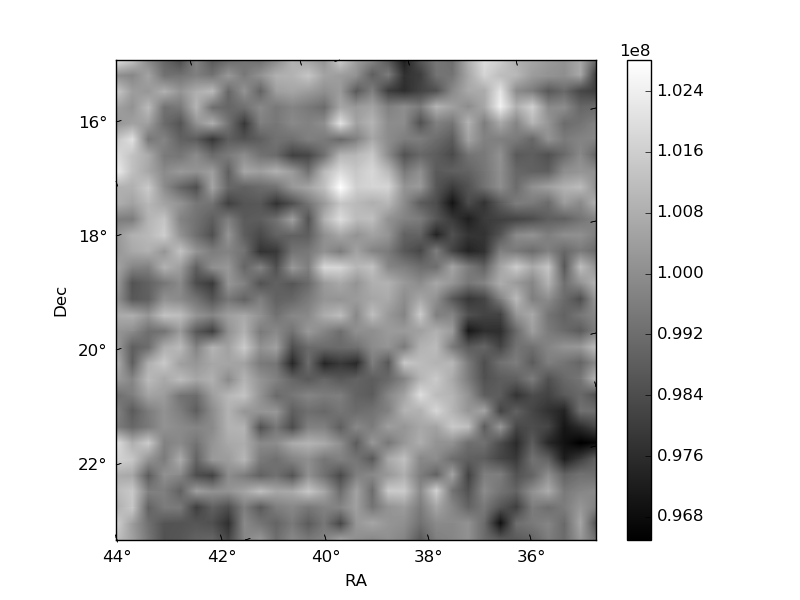
Quadrant B |
|---|---|---|---|
| Quadrant D | 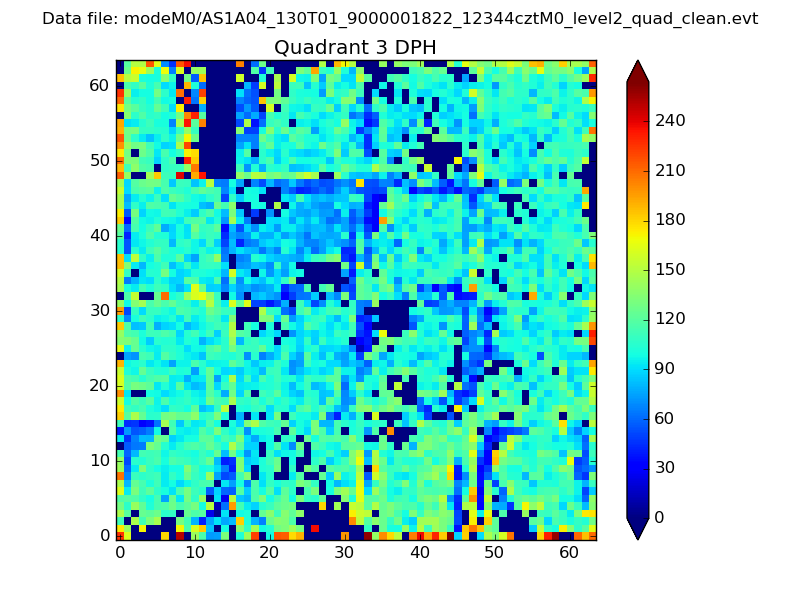 |
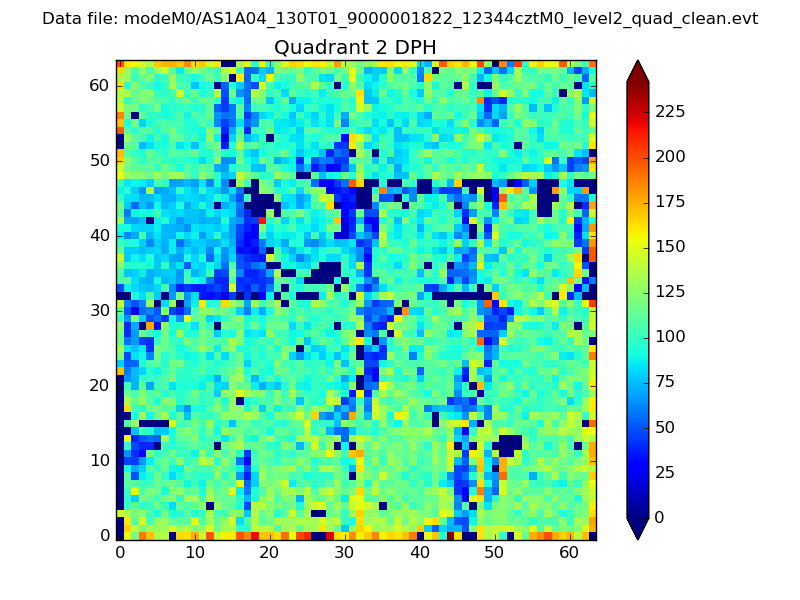 |
Quadrant C |
| Plot type | Count rate plots | Images |
|---|---|---|
| Comparison with Poisson distribution Blue bars denote a histogram of data divided into 1 sec bins. Red curve is a Poisson curve with rate = median count rate of data. |
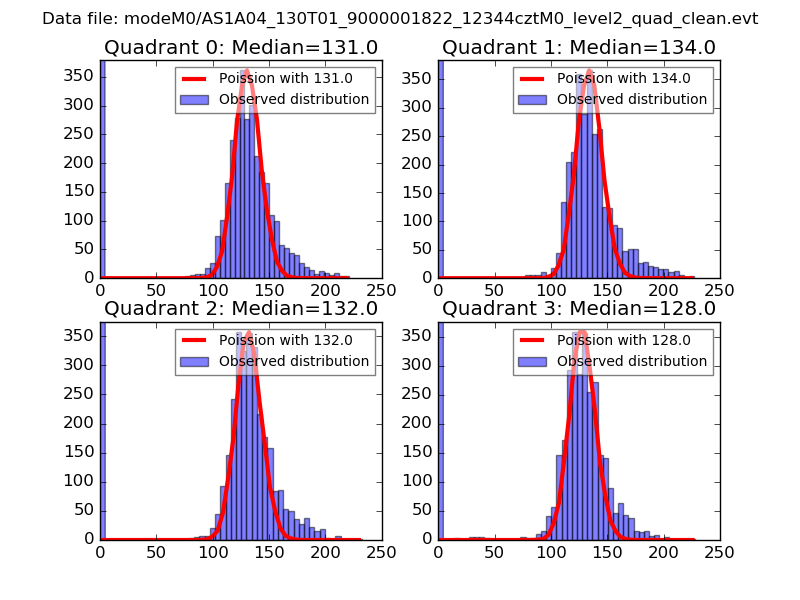 |
 |
| Quadrant-wise count rates Data is divided into 100 sec bins |
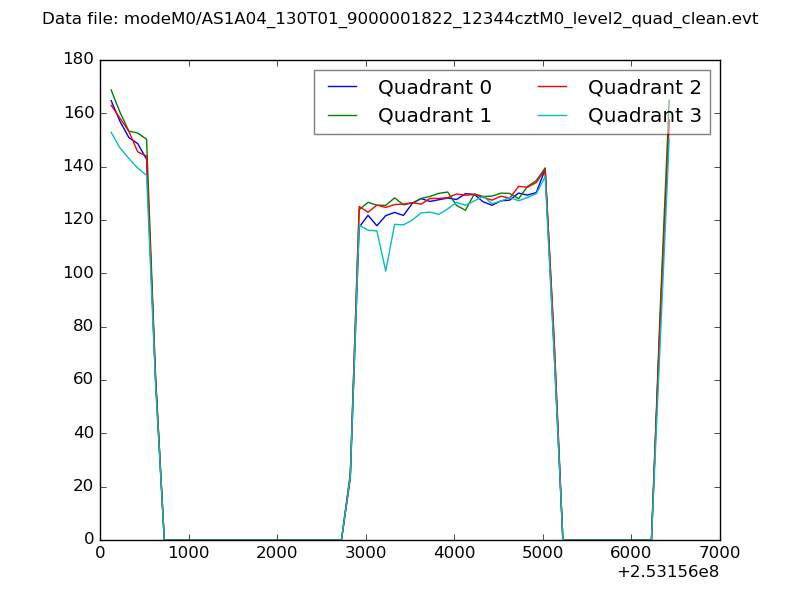 |
|
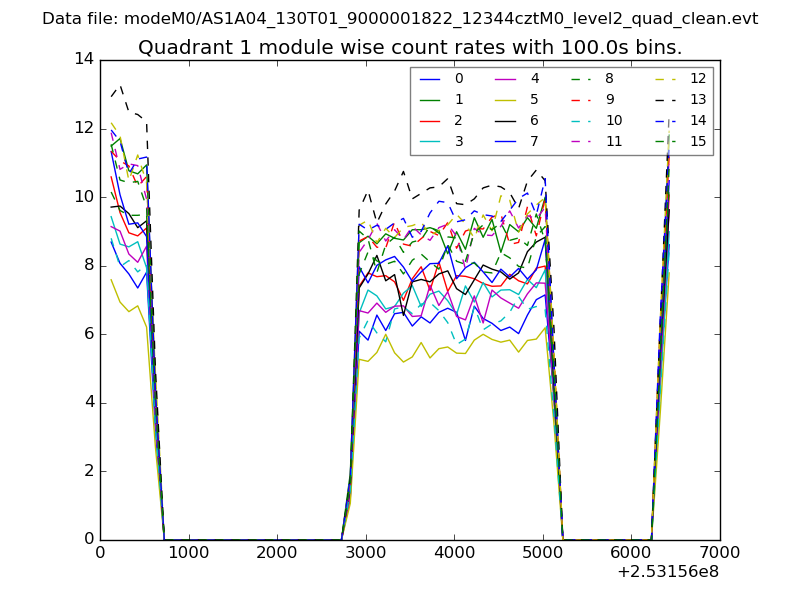
| Module-wise count rates for Quadrant A Data is divided into 100 sec bins |
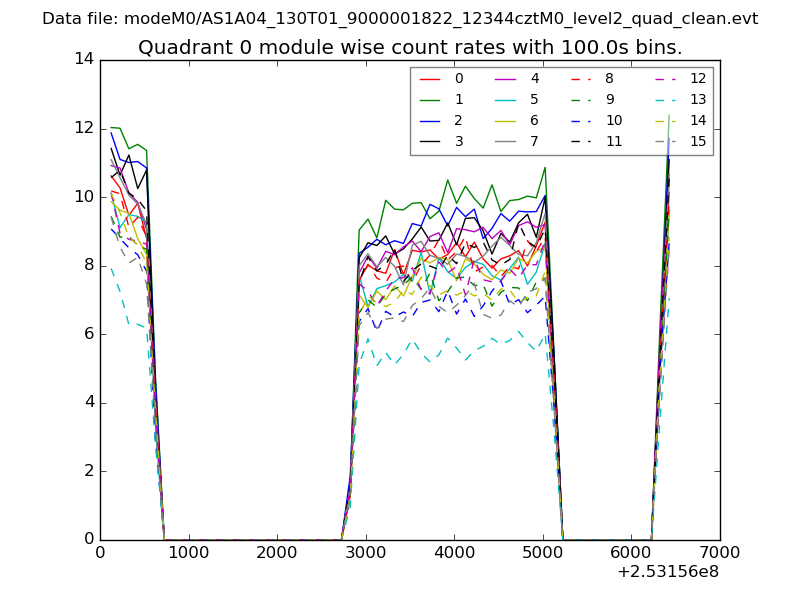 |
 |
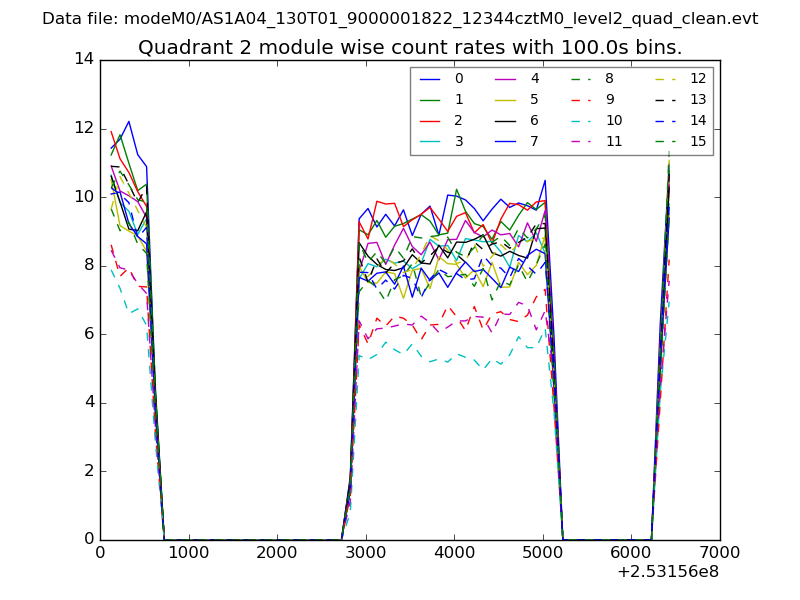
| Module-wise count rates for Quadrant B Data is divided into 100 sec bins |
 |
 |
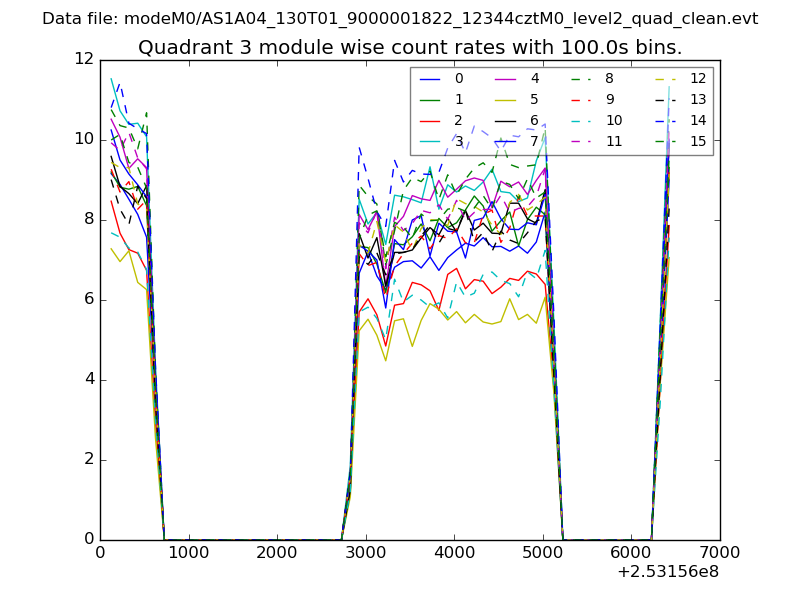
| Module-wise count rates for Quadrant C Data is divided into 100 sec bins |
 |
 |
| Module-wise count rates for Quadrant D Data is divided into 100 sec bins |
 |
 |
| Parameter | Plot |
|---|---|
| CZT HV Monitor | 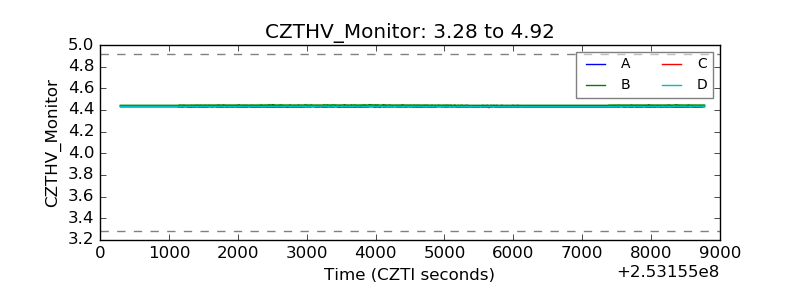 |
| D_VDD | 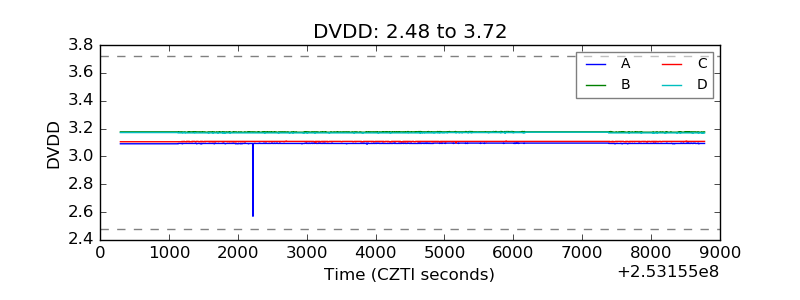 |
| Temperature 1 | 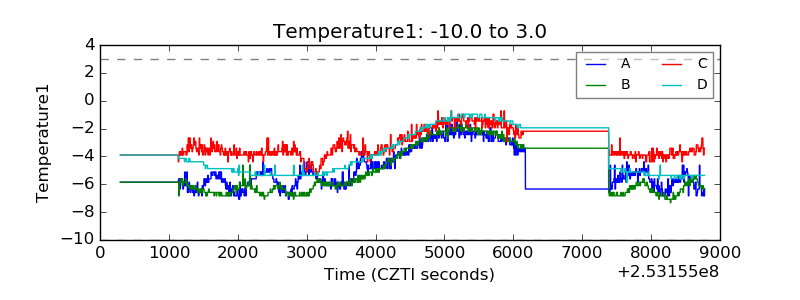 |
| Veto HV Monitor |  |
| Veto LLD | 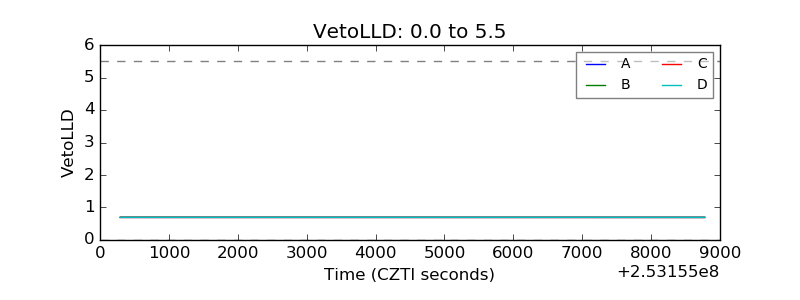 |
| Alpha Counter | 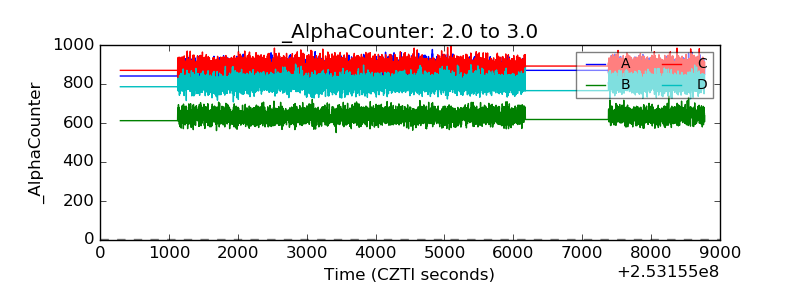 |
| _CPM_Rate | 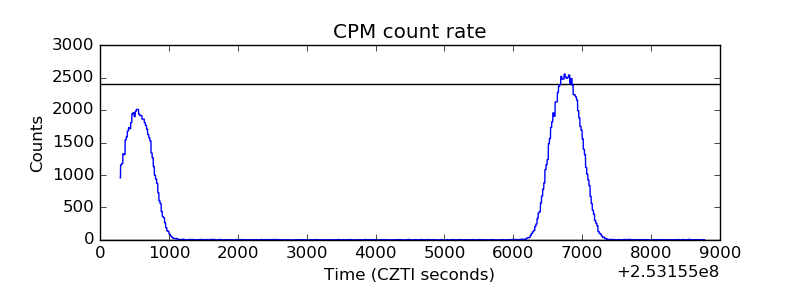 |
| CZT Counter | 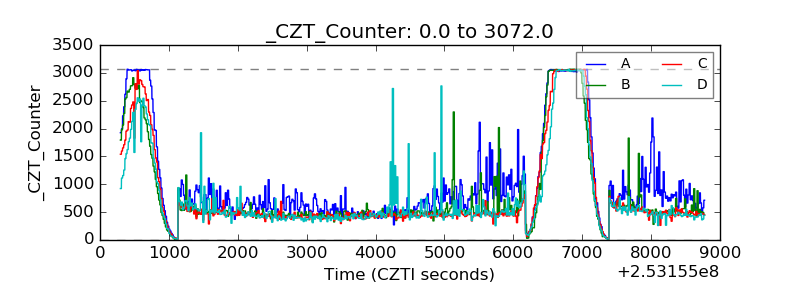 |
| +2.5 Volts monitor |  |
| +5 Volts monitor |  |
| _ROLL_ROT | 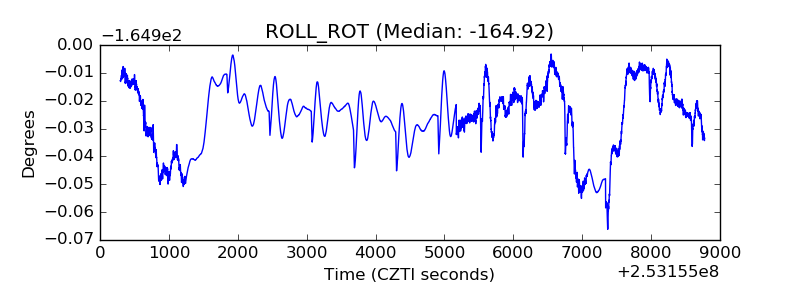 |
| _Roll_DEC | 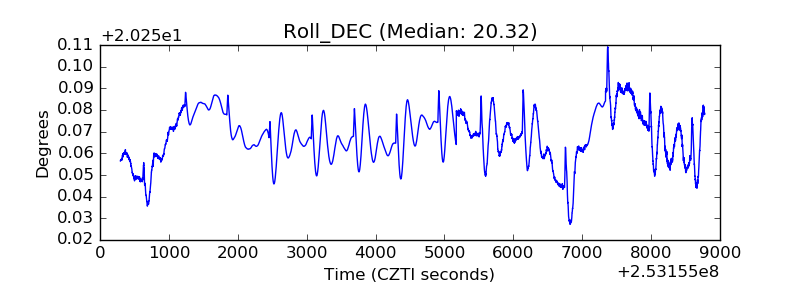 |
| _Roll_RA | 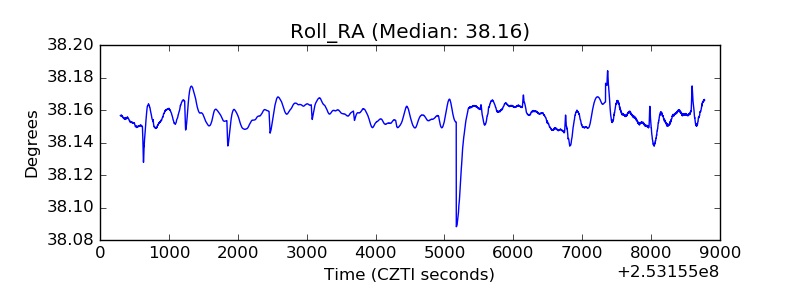 |
| Veto Counter | 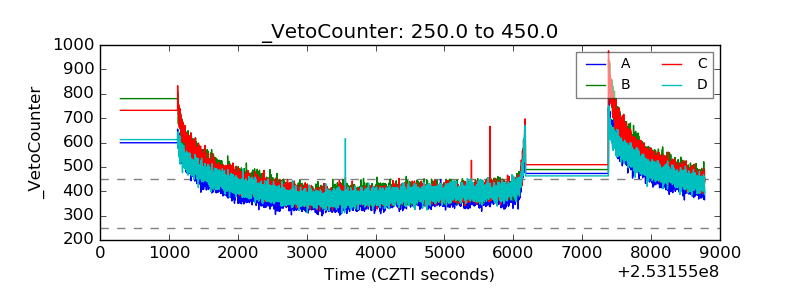 |