| Param | Original file | Final file |
|---|---|---|
| Filename | modeM0/AS1A04_130T01_9000001822_12345cztM0_level2.evt | modeM0/AS1A04_130T01_9000001822_12345cztM0_level2_quad_clean.evt |
| Size (bytes) | 533,658,240 | 62,464,320 |
| Size | 508.9 MB | 59.6 MB |
| Events in quadrant A | 5,417,726 | 358,282 |
| Events in quadrant B | 3,504,269 | 373,409 |
| Events in quadrant C | 3,093,395 | 369,408 |
| Events in quadrant D | 3,720,095 | 350,791 |
| Mode M9 | |||
|---|---|---|---|
| Quadrant | BADHDUFLAG | Total packets | Discarded packets |
| A | 0 | 20 | 0 |
| B | 0 | 20 | 0 |
| C | 0 | 20 | 0 |
| D | 0 | 21 | 0 |
| Mode M0 | |||
|---|---|---|---|
| Quadrant | BADHDUFLAG | Total packets | Discarded packets |
| A | 0 | 20666 | 3 |
| B | 0 | 14218 | 2 |
| C | 0 | 13094 | 2 |
| D | 0 | 15119 | 2 |
| Mode SS | |||
|---|---|---|---|
| Quadrant | BADHDUFLAG | Total packets | Discarded packets |
| A | 0 | 128 | 0 |
| B | 0 | 128 | 0 |
| C | 0 | 128 | 0 |
| D | 0 | 128 | 0 |
| Quadrant | Total seconds | Saturated seconds | Saturation percentage |
|---|---|---|---|
| A | 6291 | 270 | 4.291845% |
| B | 6291 | 96 | 1.525990% |
| C | 6291 | 38 | 0.604038% |
| D | 6291 | 141 | 2.241297% |
Noise dominated data is calculated using 1-second bins in cleaned event files. If a bin has >2000 counts, and if more than 50% of those come from <1% of pixels, then it is considered to be noise-dominated and hence unusable.
| Quadrant | # 1 sec bins | Bins with >0 counts | Bins with >2000 counts | High rate bins dominated by noise | Noise dominated (total time) | Noise dominated (detector-on time) | Marked lightcurve |
|---|---|---|---|---|---|---|---|
| A | 7557 | 6293 | 74 | 74 | 0.98% | 1.18% | 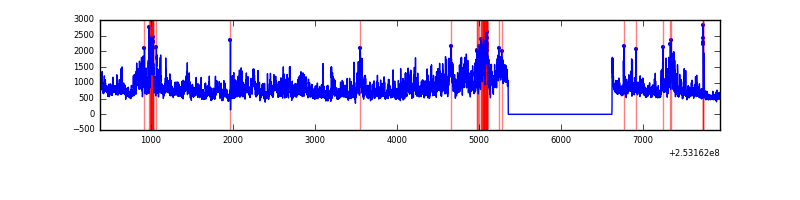 |
| B | 7557 | 6293 | 25 | 25 | 0.33% | 0.40% | 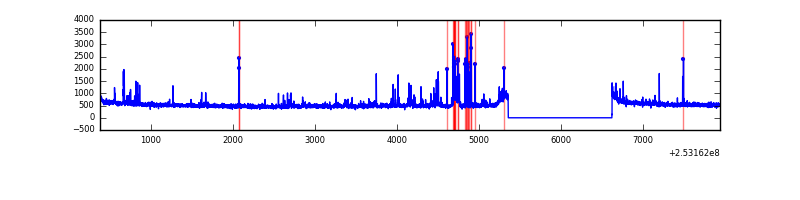 |
| C | 7557 | 6293 | 0 | 0 | 0.00% | 0.00% | 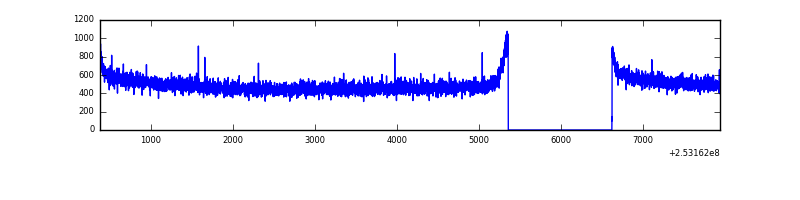 |
| D | 7557 | 6293 | 88 | 88 | 1.16% | 1.40% | 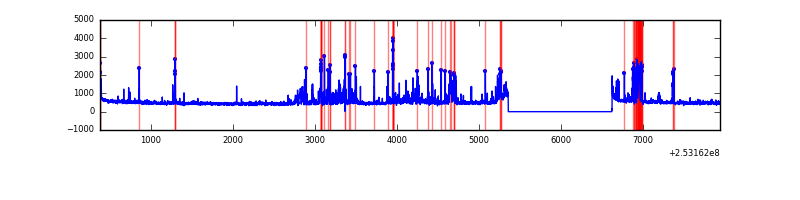 |
Top three noisy pixels from each quadrant. If the there are fewer than three noisy pixels in the level2.evt file, extra rows are filled as -1
| Pixel properties | Quadrant properties | ||||||
|---|---|---|---|---|---|---|---|
| Quadrant | DetID | PixID | Counts | Sigma | Mean | Median | Sigma |
| A | 8 | 15 | 1714813 | 10556.96 | 811 | 797 | 162.4 |
| A | 1 | 162 | 159146 | 975.3 | 811 | 797 | 162.4 |
| A | 13 | 251 | 134025 | 820.57 | 811 | 797 | 162.4 |
| B | 4 | 239 | 181070 | 1172.54 | 822 | 806 | 153.7 |
| B | 0 | 190 | 45345 | 289.71 | 822 | 806 | 153.7 |
| B | 0 | 197 | 40847 | 260.45 | 822 | 806 | 153.7 |
| C | 13 | 61 | 5760 | 27.16 | 793 | 798 | 182.7 |
| C | 8 | 222 | 2880 | 11.4 | 793 | 798 | 182.7 |
| C | 3 | 202 | 1931 | 6.2 | 793 | 798 | 182.7 |
| D | 1 | 52 | 440282 | 2348.55 | 781 | 763 | 187.1 |
| D | 10 | 253 | 215809 | 1149.09 | 781 | 763 | 187.1 |
| D | 10 | 199 | 34907 | 182.45 | 781 | 763 | 187.1 |
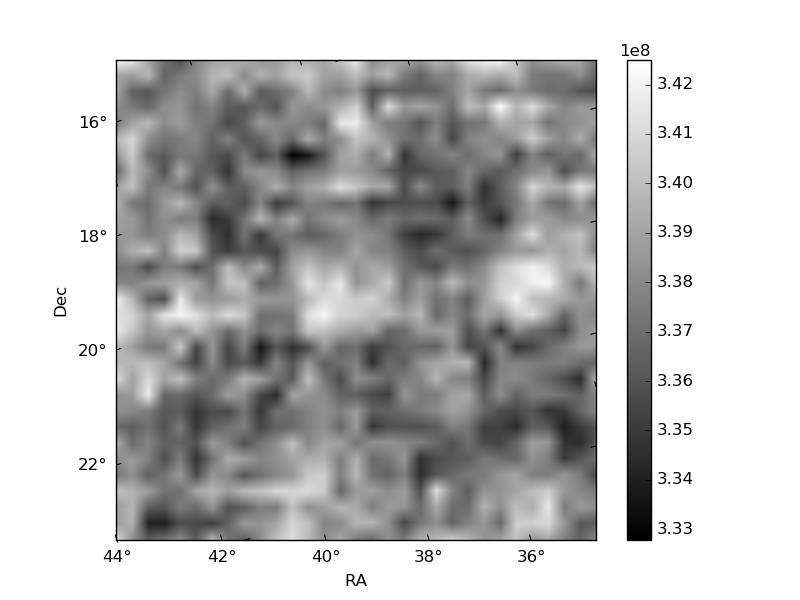
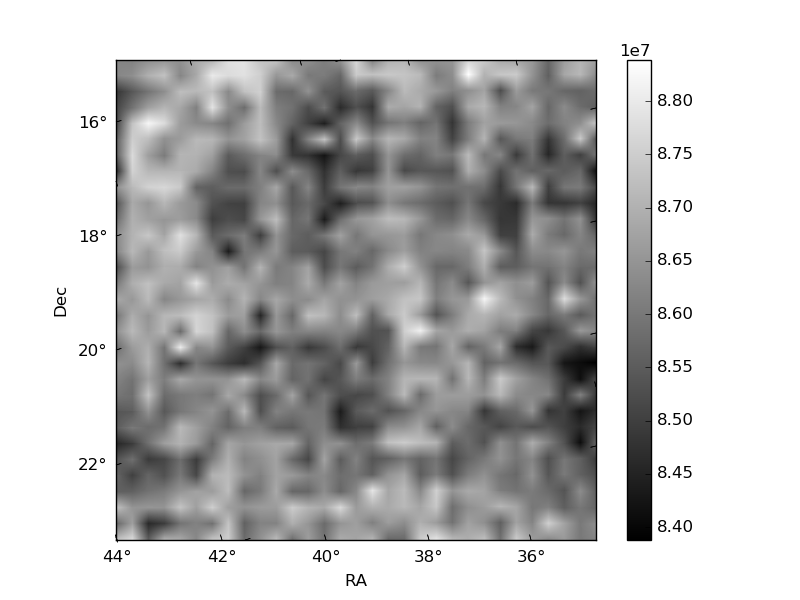
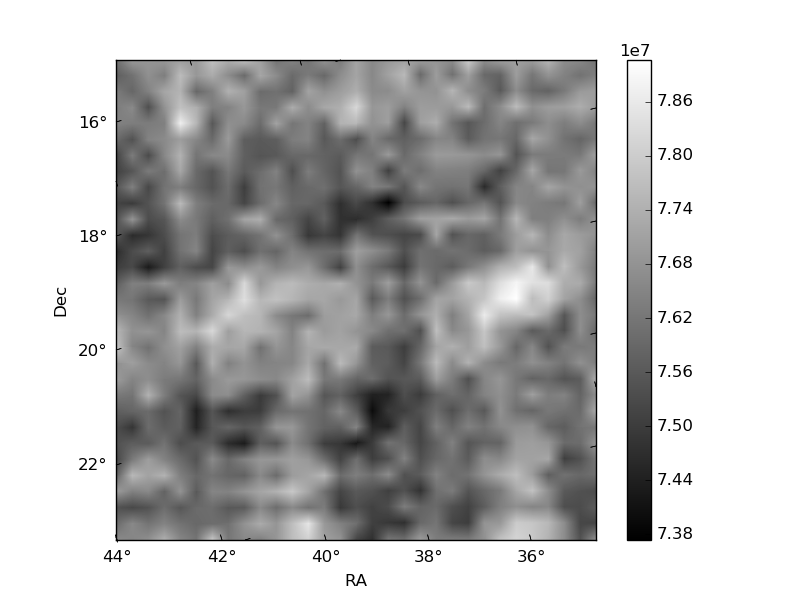
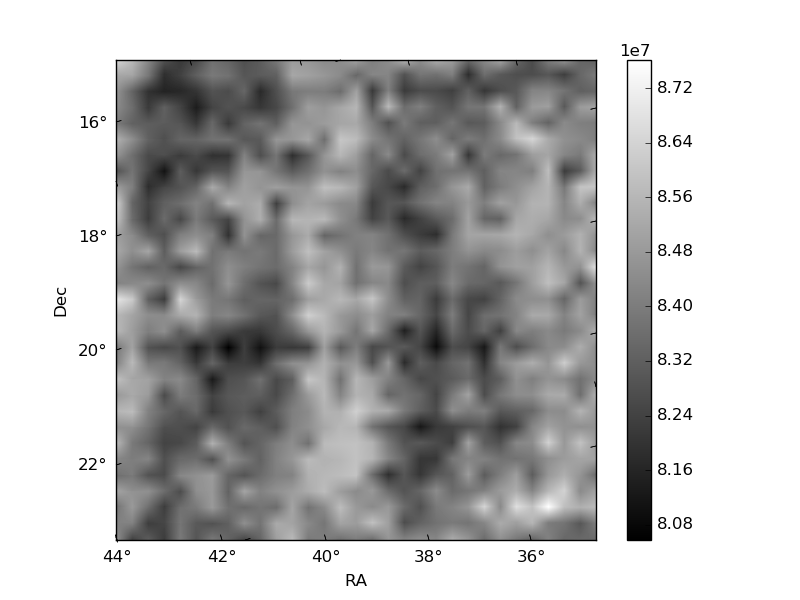
Histogram calculated using DETX and DETY for each event in the final _common_clean file
| Quadrant A | 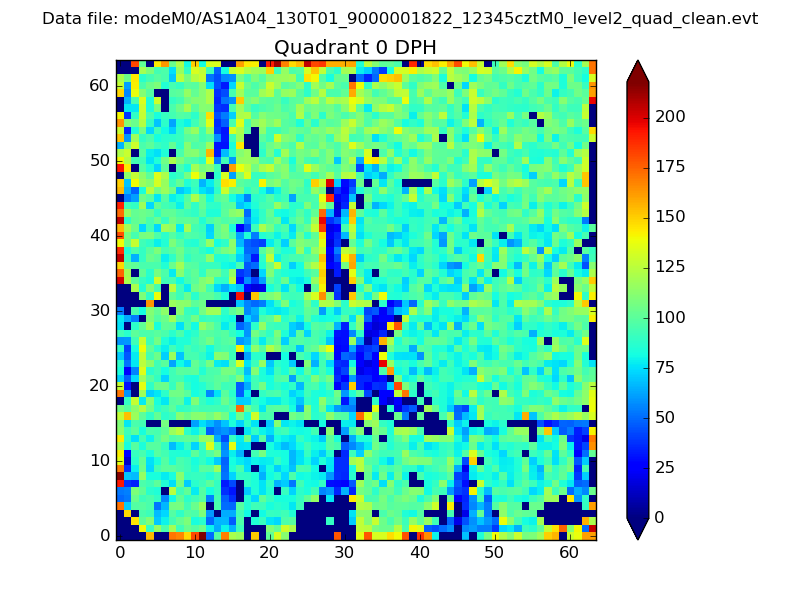 |
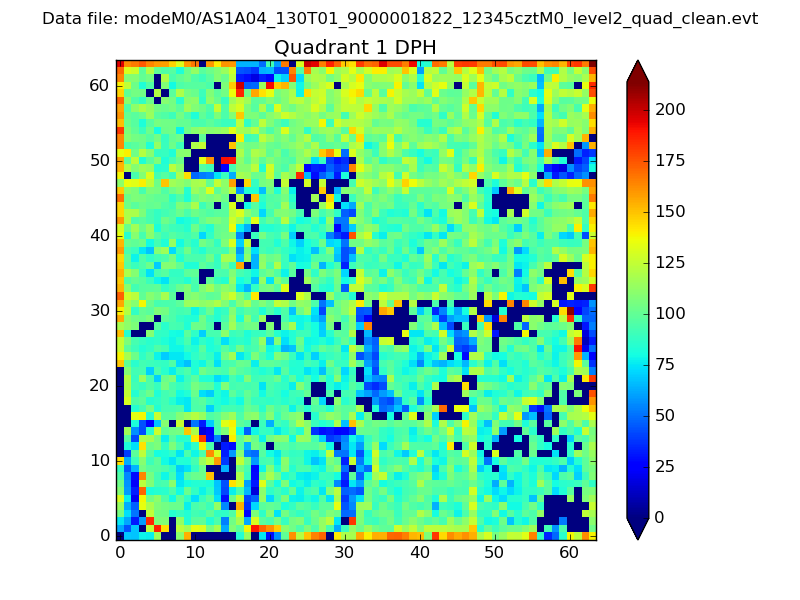 |
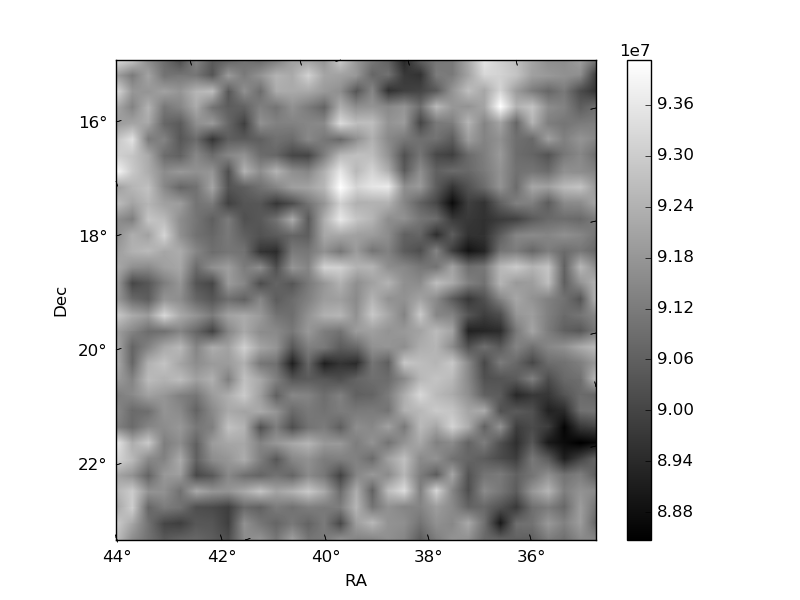
Quadrant B |
|---|---|---|---|
| Quadrant D | 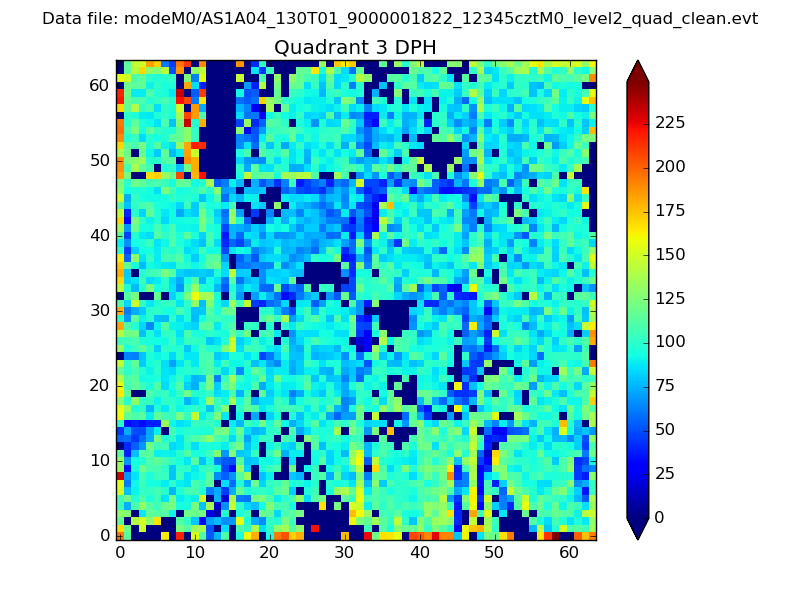 |
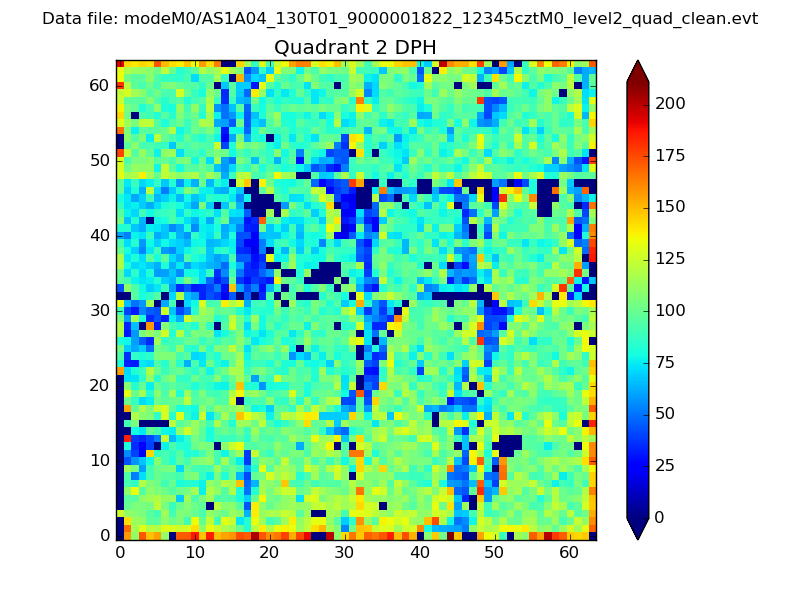 |
Quadrant C |
| Plot type | Count rate plots | Images |
|---|---|---|
| Comparison with Poisson distribution Blue bars denote a histogram of data divided into 1 sec bins. Red curve is a Poisson curve with rate = median count rate of data. |
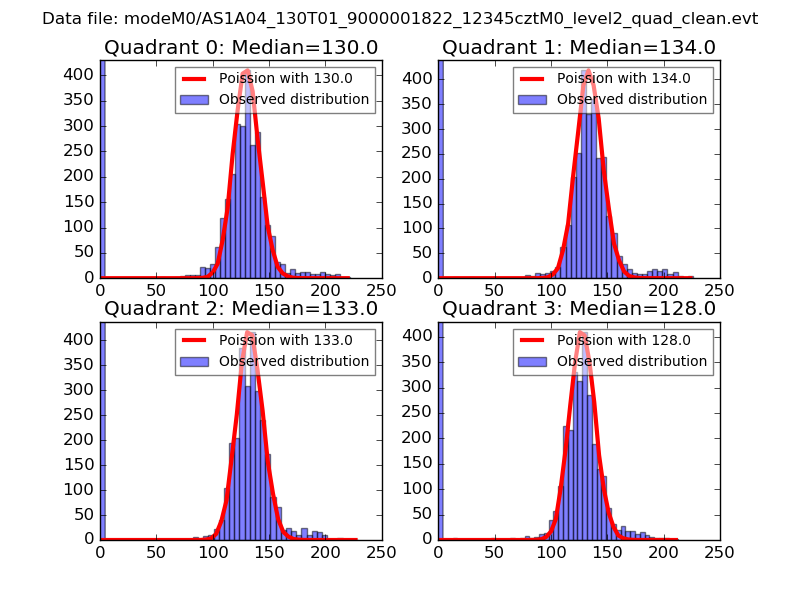 |
 |
| Quadrant-wise count rates Data is divided into 100 sec bins |
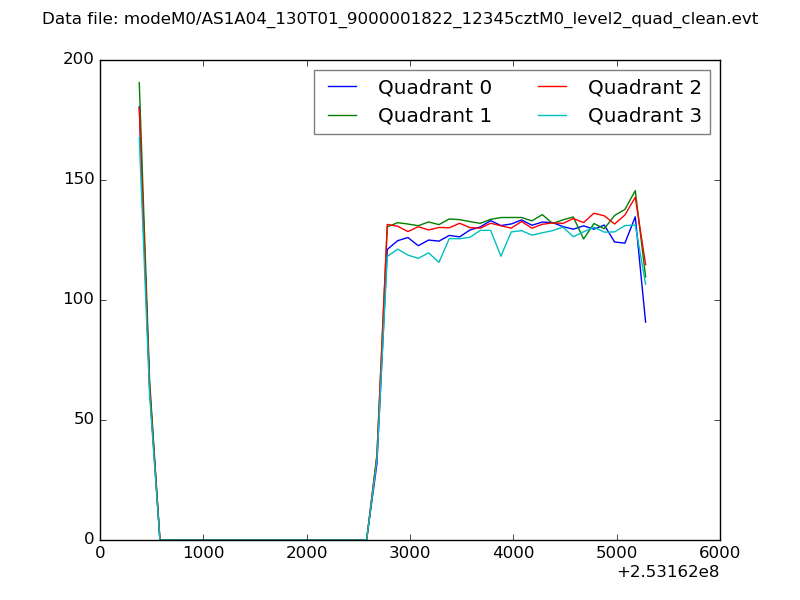 |
|
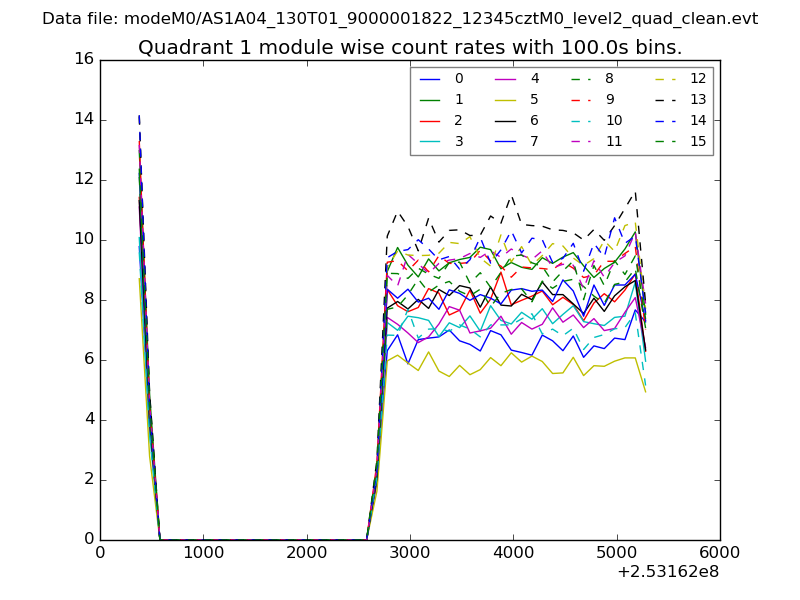
| Module-wise count rates for Quadrant A Data is divided into 100 sec bins |
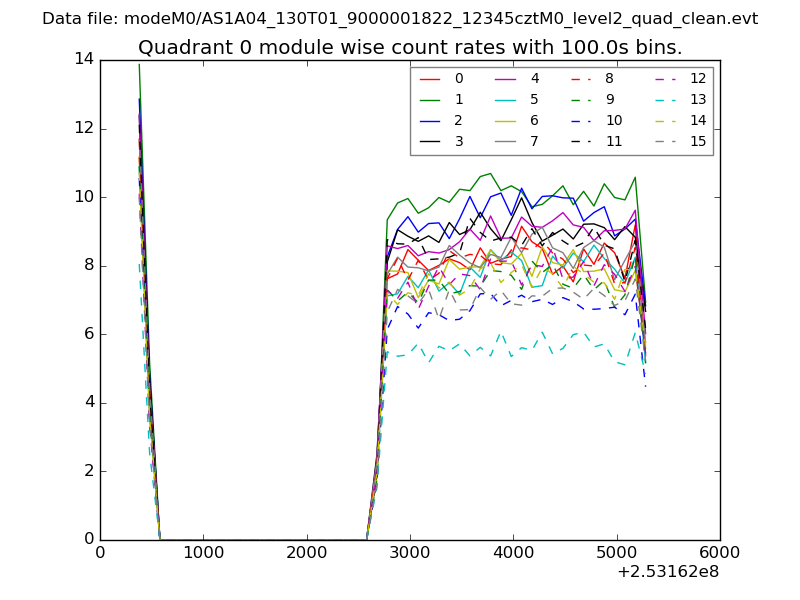 |
 |
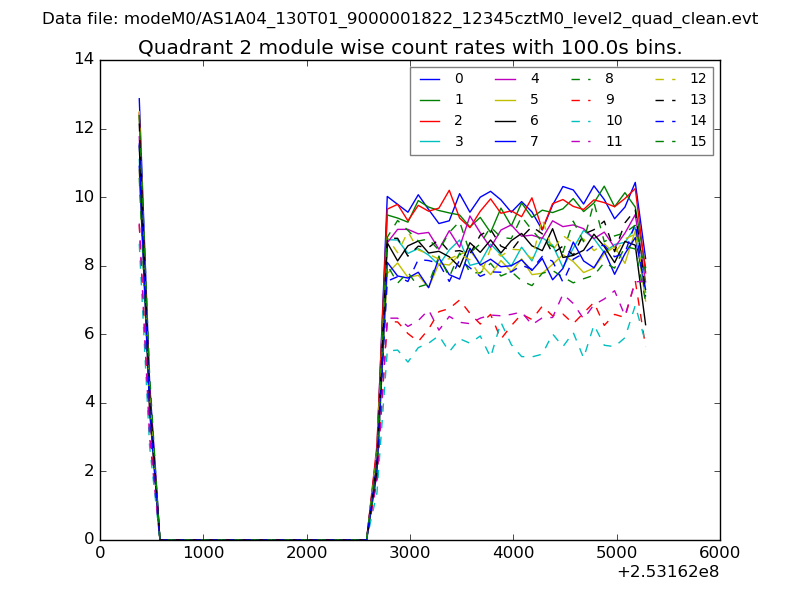
| Module-wise count rates for Quadrant B Data is divided into 100 sec bins |
 |
 |
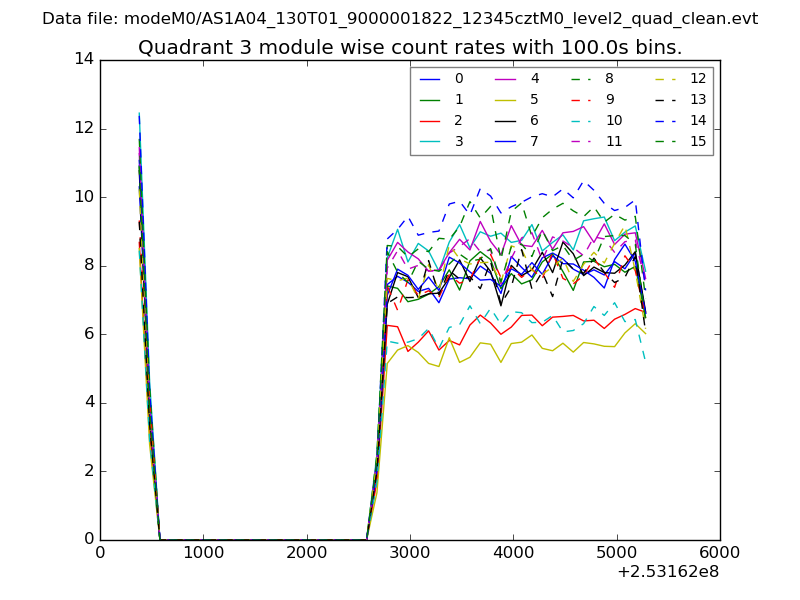
| Module-wise count rates for Quadrant C Data is divided into 100 sec bins |
 |
 |
| Module-wise count rates for Quadrant D Data is divided into 100 sec bins |
 |
 |
| Parameter | Plot |
|---|---|
| CZT HV Monitor | 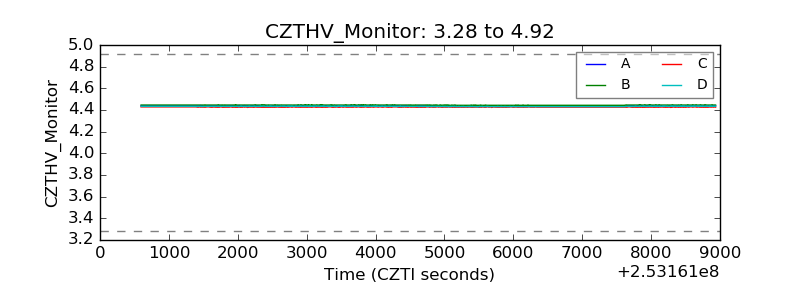 |
| D_VDD | 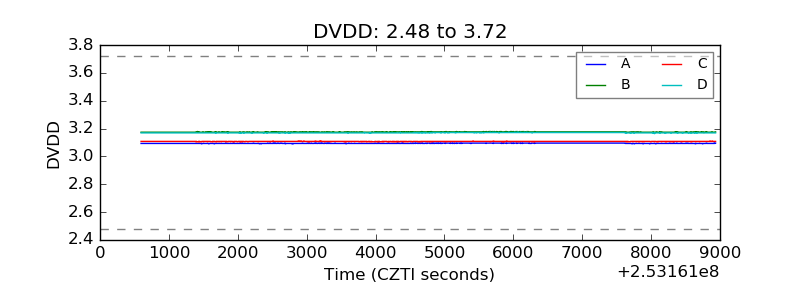 |
| Temperature 1 | 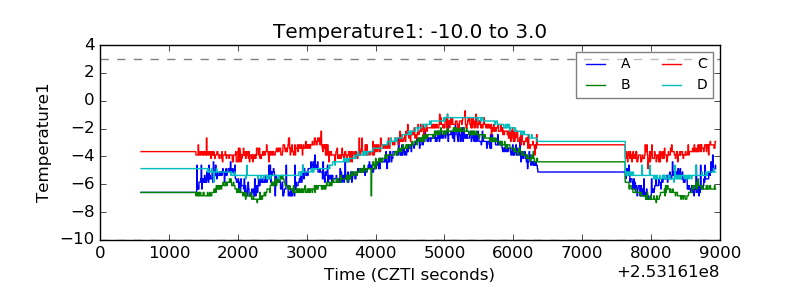 |
| Veto HV Monitor | 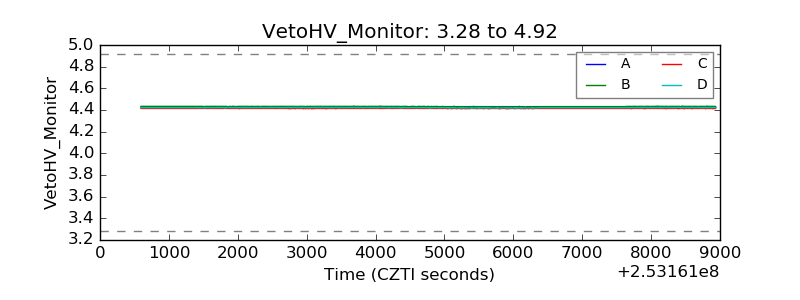 |
| Veto LLD | 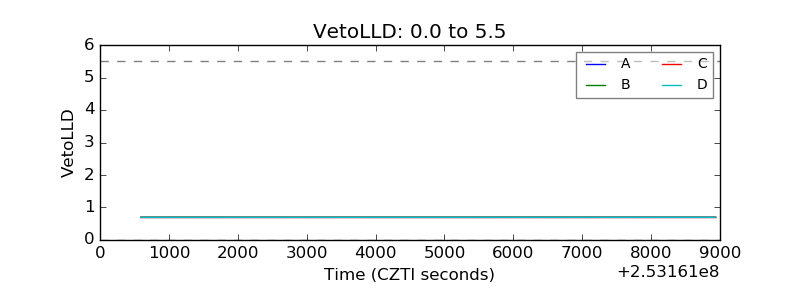 |
| Alpha Counter | 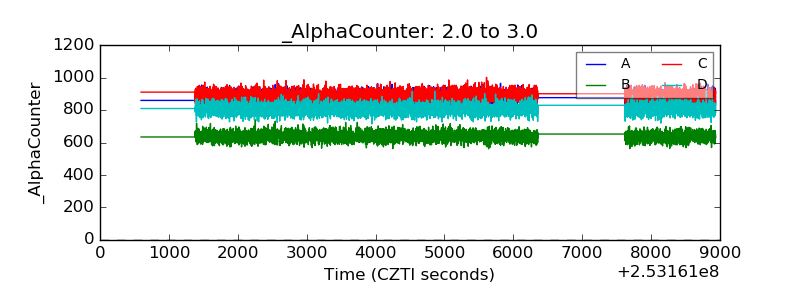 |
| _CPM_Rate | 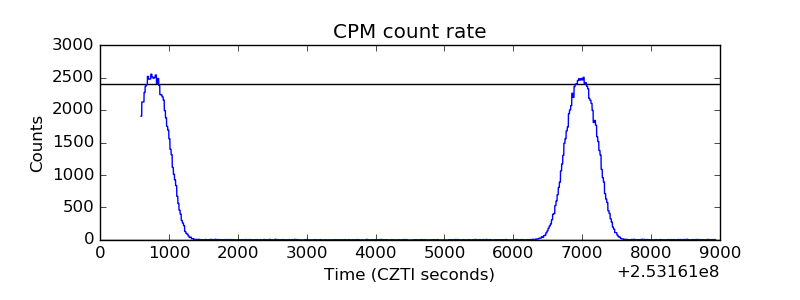 |
| CZT Counter | 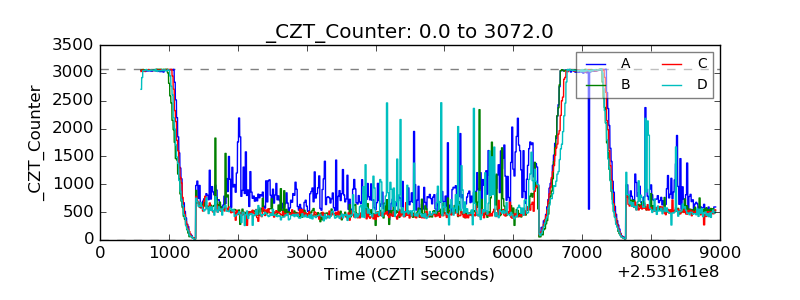 |
| +2.5 Volts monitor |  |
| +5 Volts monitor |  |
| _ROLL_ROT | 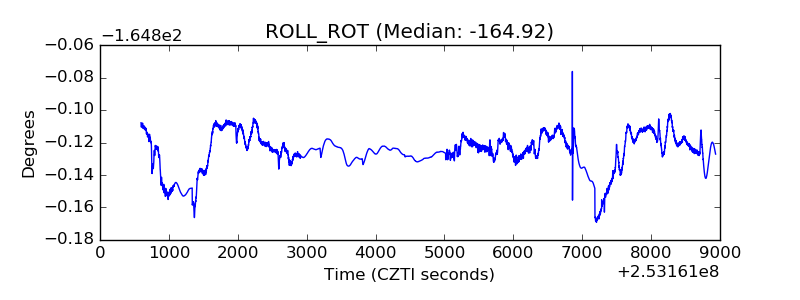 |
| _Roll_DEC | 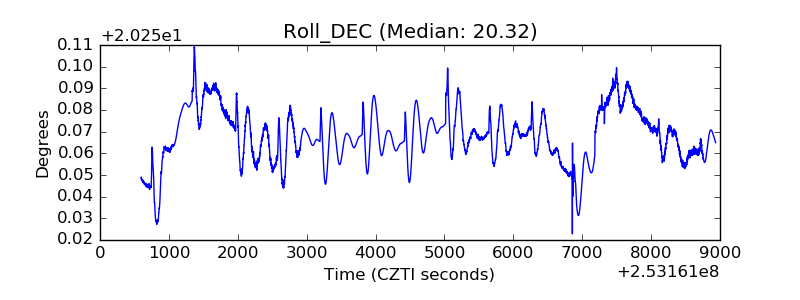 |
| _Roll_RA | 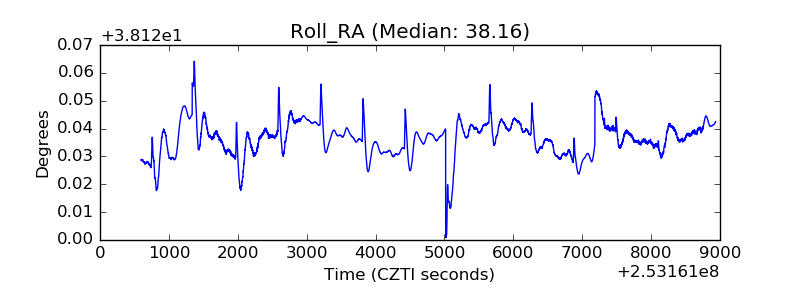 |
| Veto Counter | 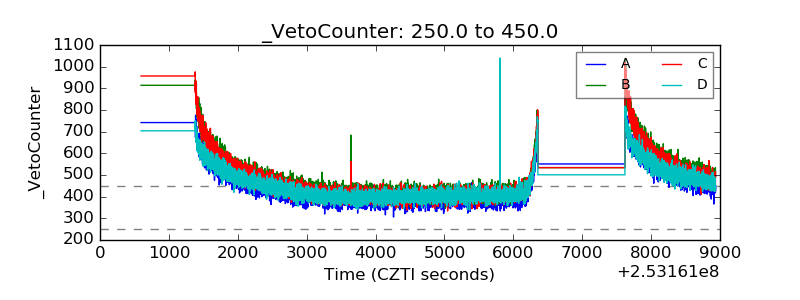 |