| Param | Original file | Final file |
|---|---|---|
| Filename | modeM0/AS1A04_130T01_9000001822_12346cztM0_level2.evt | modeM0/AS1A04_130T01_9000001822_12346cztM0_level2_quad_clean.evt |
| Size (bytes) | 333,584,640 | 50,711,040 |
| Size | 318.1 MB | 48.4 MB |
| Events in quadrant A | 2,903,519 | 310,288 |
| Events in quadrant B | 2,344,301 | 314,680 |
| Events in quadrant C | 2,060,434 | 310,740 |
| Events in quadrant D | 2,501,374 | 296,646 |
| Mode M9 | |||
|---|---|---|---|
| Quadrant | BADHDUFLAG | Total packets | Discarded packets |
| A | 0 | 10 | 0 |
| B | 0 | 10 | 0 |
| C | 0 | 10 | 0 |
| D | 0 | 11 | 0 |
| Mode M0 | |||
|---|---|---|---|
| Quadrant | BADHDUFLAG | Total packets | Discarded packets |
| A | 0 | 11572 | 1 |
| B | 0 | 9550 | 1 |
| C | 0 | 8810 | 1 |
| D | 0 | 10173 | 1 |
| Mode SS | |||
|---|---|---|---|
| Quadrant | BADHDUFLAG | Total packets | Discarded packets |
| A | 0 | 86 | 0 |
| B | 0 | 86 | 0 |
| C | 0 | 86 | 0 |
| D | 0 | 86 | 0 |
| Quadrant | Total seconds | Saturated seconds | Saturation percentage |
|---|---|---|---|
| A | 4301 | 45 | 1.046268% |
| B | 4301 | 46 | 1.069519% |
| C | 4301 | 3 | 0.069751% |
| D | 4301 | 68 | 1.581028% |
Noise dominated data is calculated using 1-second bins in cleaned event files. If a bin has >2000 counts, and if more than 50% of those come from <1% of pixels, then it is considered to be noise-dominated and hence unusable.
| Quadrant | # 1 sec bins | Bins with >0 counts | Bins with >2000 counts | High rate bins dominated by noise | Noise dominated (total time) | Noise dominated (detector-on time) | Marked lightcurve |
|---|---|---|---|---|---|---|---|
| A | 4302 | 4302 | 10 | 10 | 0.23% | 0.23% | 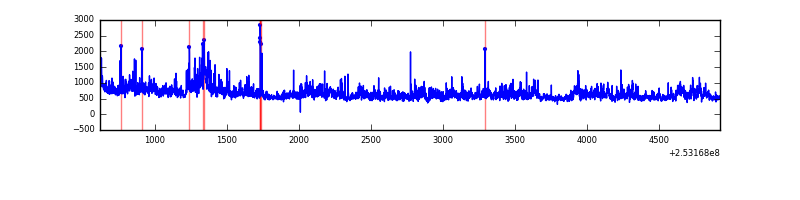 |
| B | 4302 | 4302 | 31 | 31 | 0.72% | 0.72% | 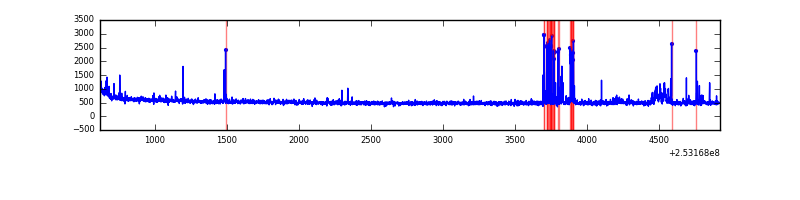 |
| C | 4302 | 4302 | 0 | 0 | 0.00% | 0.00% | 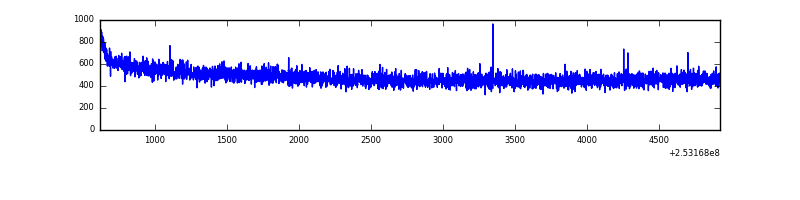 |
| D | 4302 | 4302 | 64 | 64 | 1.49% | 1.49% | 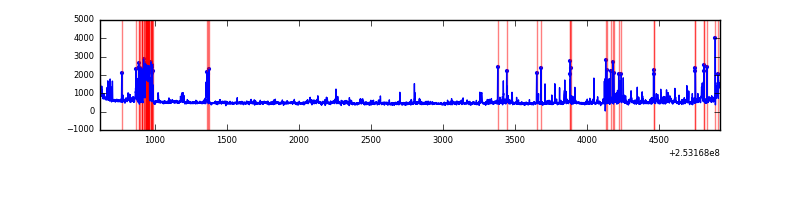 |
Top three noisy pixels from each quadrant. If the there are fewer than three noisy pixels in the level2.evt file, extra rows are filled as -1
| Pixel properties | Quadrant properties | ||||||
|---|---|---|---|---|---|---|---|
| Quadrant | DetID | PixID | Counts | Sigma | Mean | Median | Sigma |
| A | 8 | 15 | 397000 | 3586.57 | 550 | 541 | 110.5 |
| A | 13 | 251 | 114625 | 1032.06 | 550 | 541 | 110.5 |
| A | 1 | 162 | 92906 | 835.58 | 550 | 541 | 110.5 |
| B | 4 | 239 | 73511 | 701.65 | 552 | 541 | 104.0 |
| B | 0 | 85 | 72322 | 690.22 | 552 | 541 | 104.0 |
| B | 0 | 190 | 28791 | 271.64 | 552 | 541 | 104.0 |
| C | 13 | 61 | 3885 | 27.58 | 528 | 533 | 121.6 |
| C | 3 | 202 | 1256 | 5.95 | 528 | 533 | 121.6 |
| C | 3 | 203 | 1157 | 5.13 | 528 | 533 | 121.6 |
| D | 1 | 52 | 303059 | 2421.73 | 523 | 511 | 124.9 |
| D | 10 | 253 | 150558 | 1201.04 | 523 | 511 | 124.9 |
| D | 10 | 199 | 22176 | 173.42 | 523 | 511 | 124.9 |
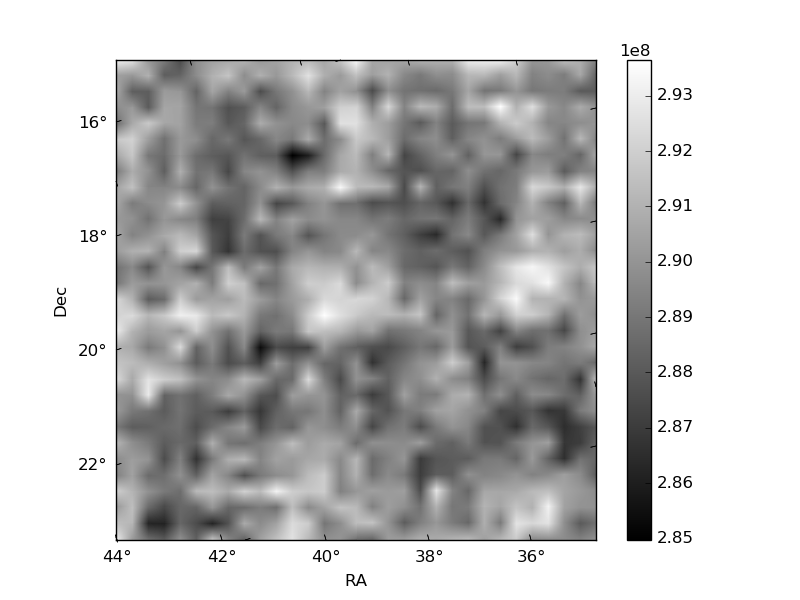
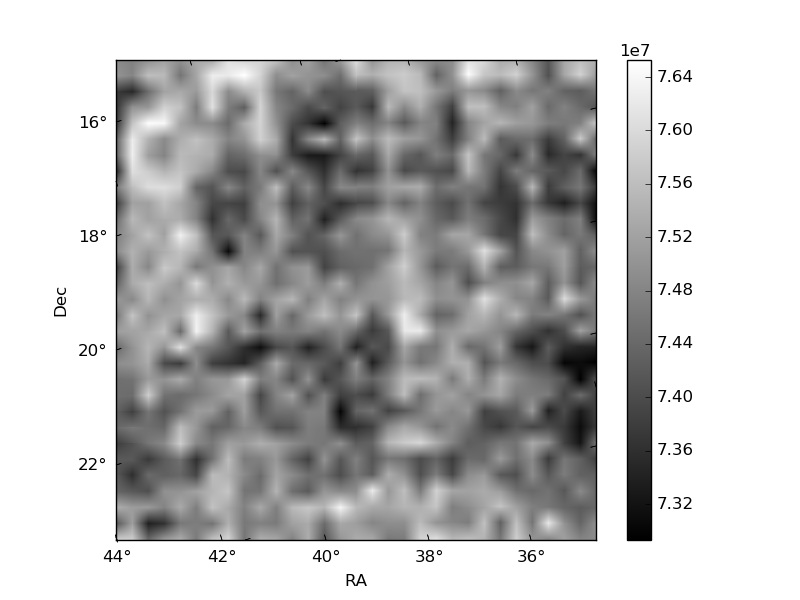
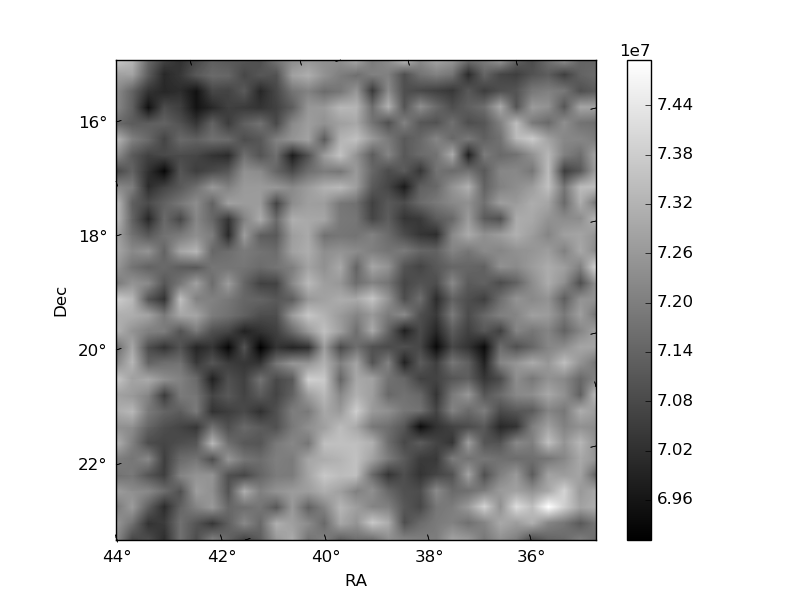
Histogram calculated using DETX and DETY for each event in the final _common_clean file
| Quadrant A | 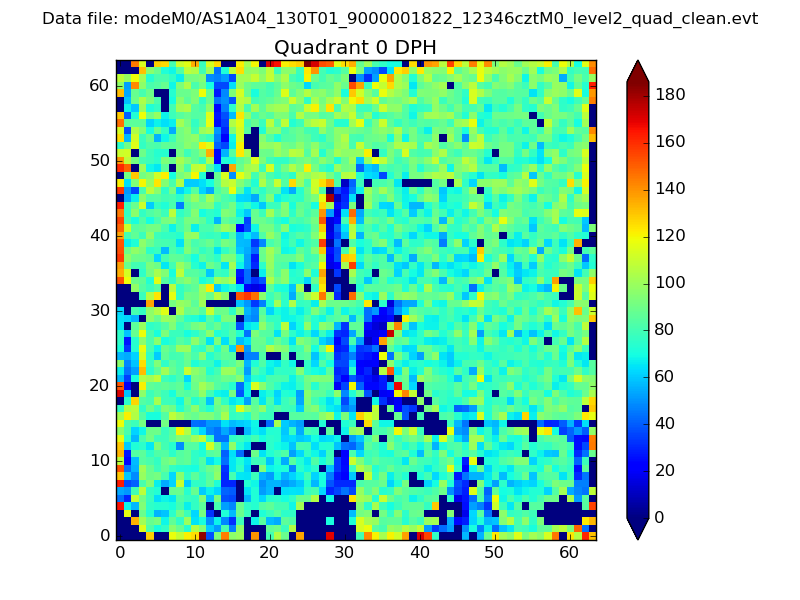 |
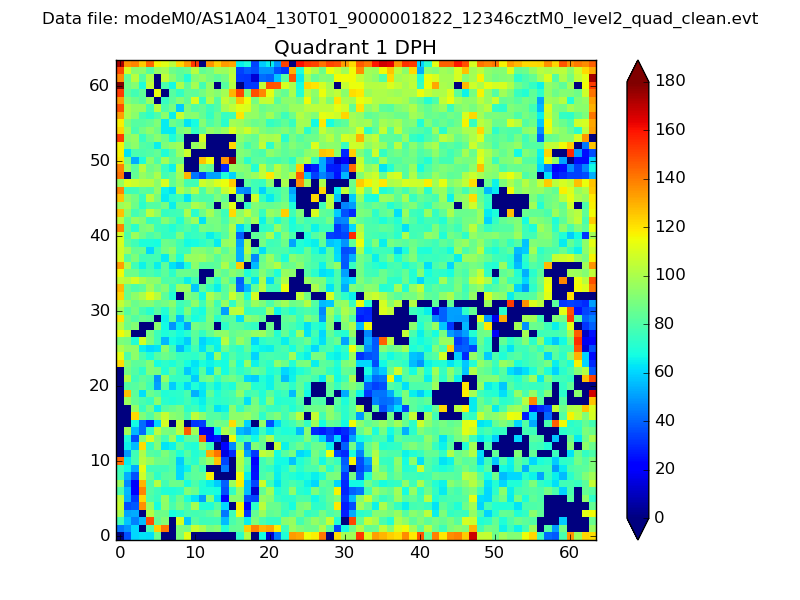 |
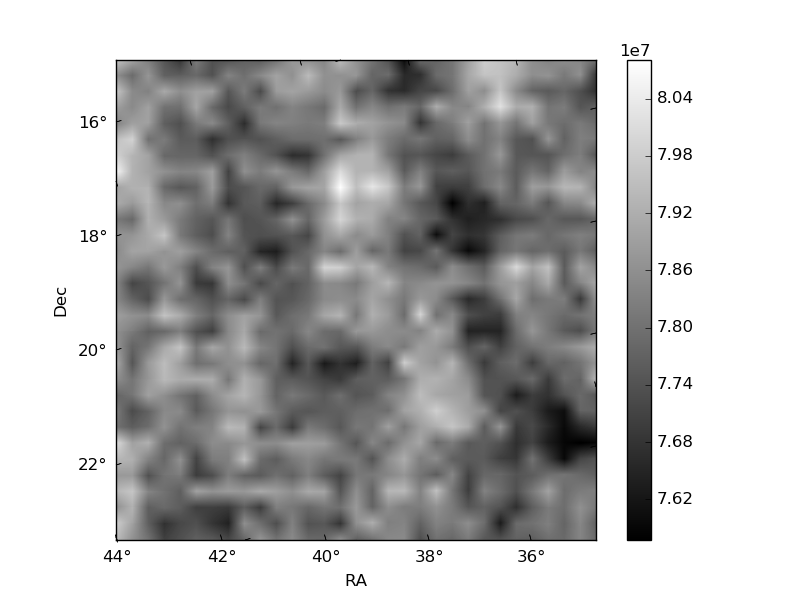
Quadrant B |
|---|---|---|---|
| Quadrant D | 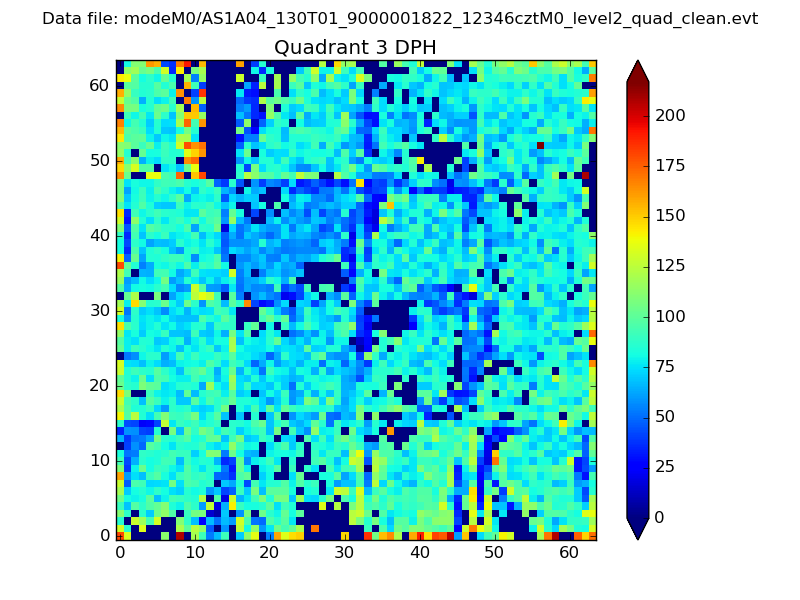 |
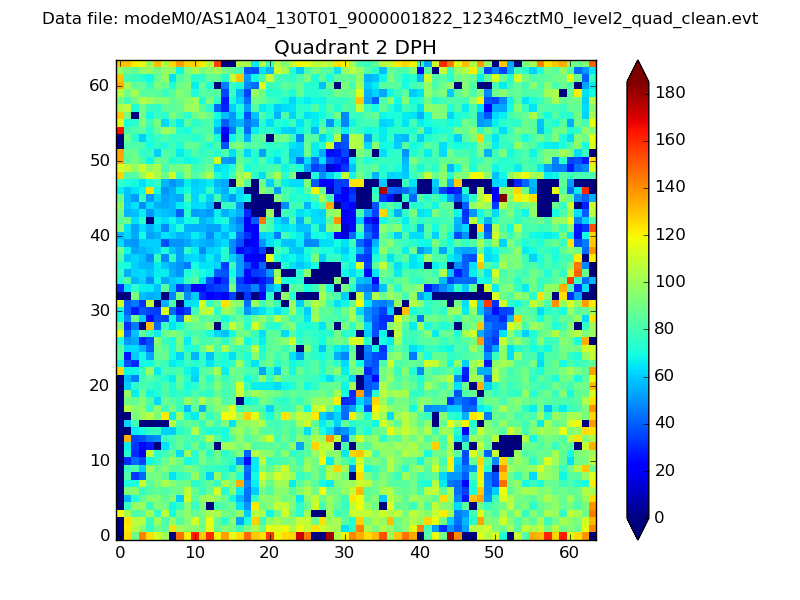 |
Quadrant C |
| Plot type | Count rate plots | Images |
|---|---|---|
| Comparison with Poisson distribution Blue bars denote a histogram of data divided into 1 sec bins. Red curve is a Poisson curve with rate = median count rate of data. |
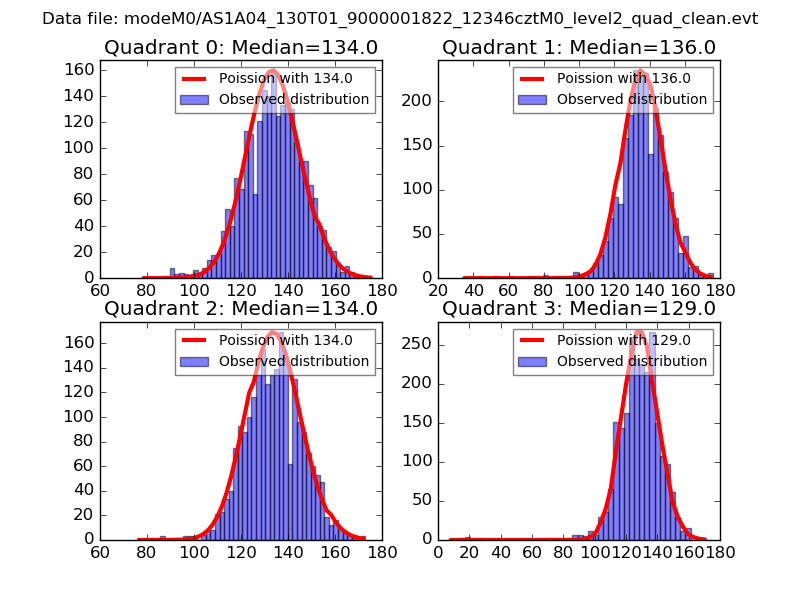 |
 |
| Quadrant-wise count rates Data is divided into 100 sec bins |
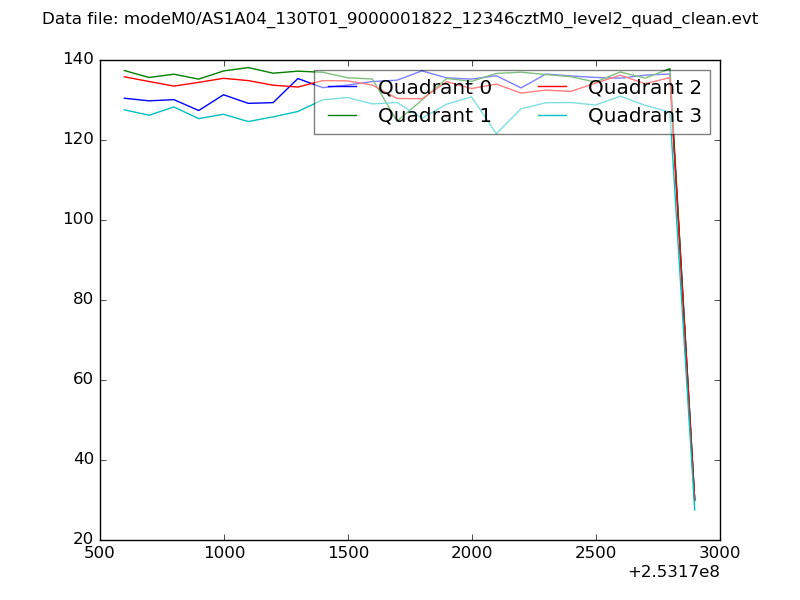 |
|
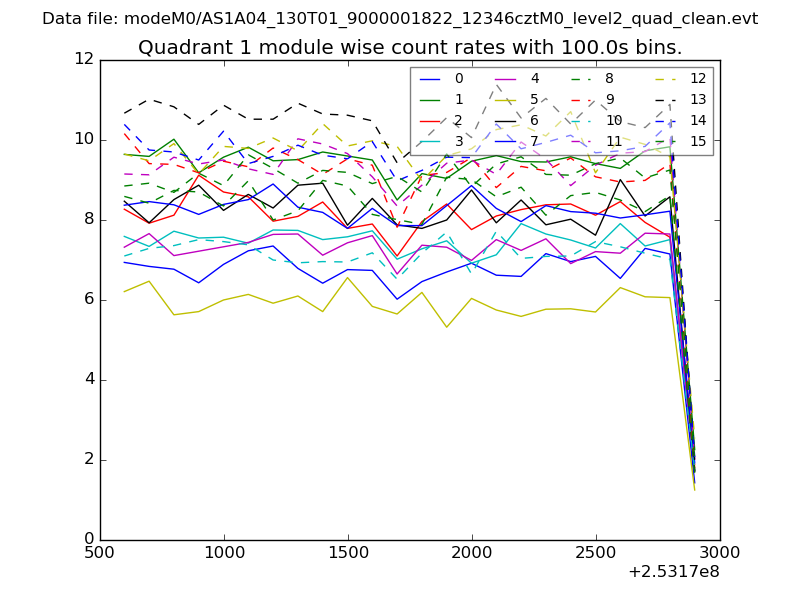
| Module-wise count rates for Quadrant A Data is divided into 100 sec bins |
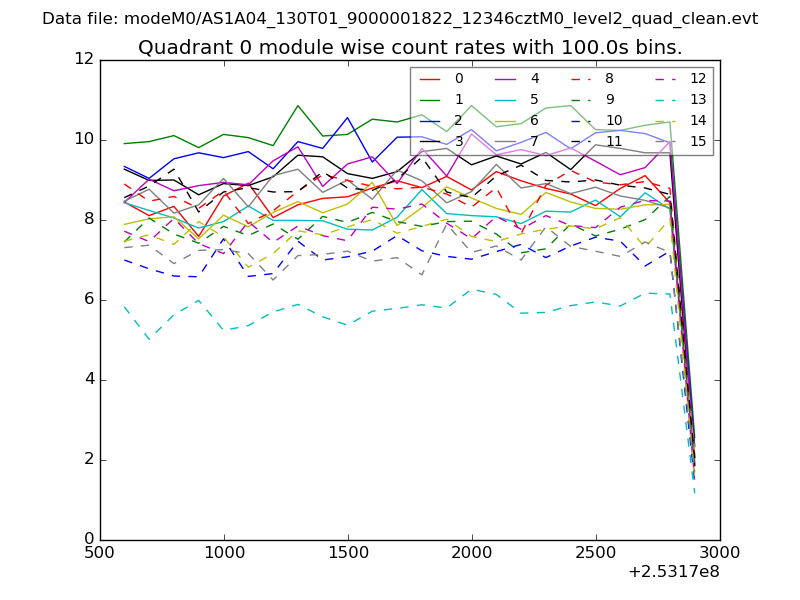 |
 |
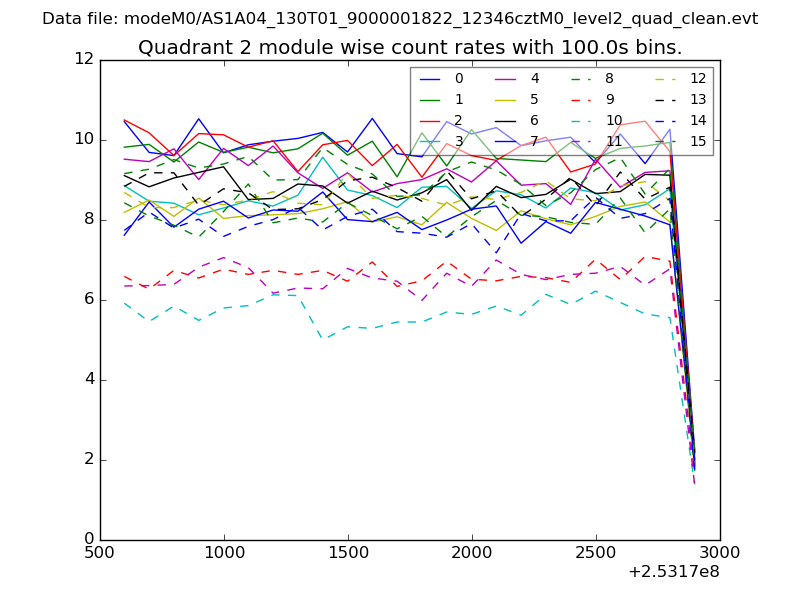
| Module-wise count rates for Quadrant B Data is divided into 100 sec bins |
 |
 |
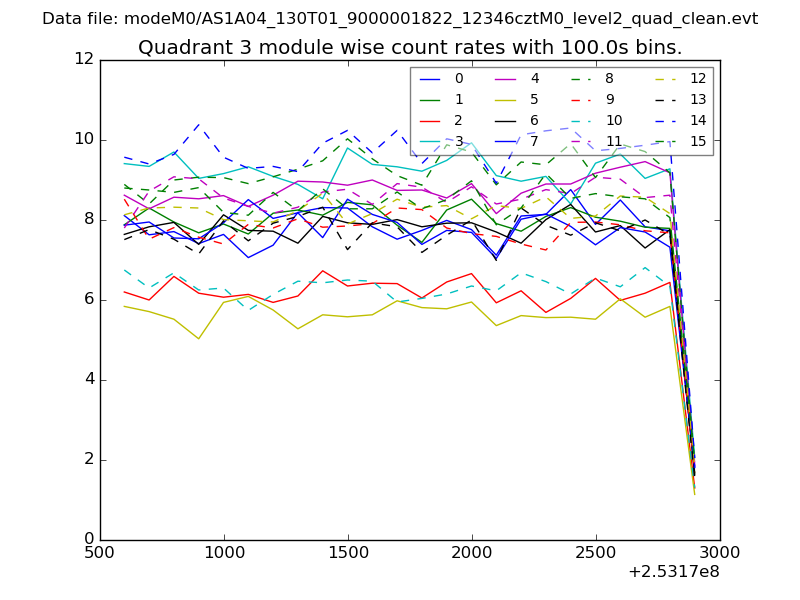
| Module-wise count rates for Quadrant C Data is divided into 100 sec bins |
 |
 |
| Module-wise count rates for Quadrant D Data is divided into 100 sec bins |
 |
 |
| Parameter | Plot |
|---|---|
| CZT HV Monitor |  |
| D_VDD | 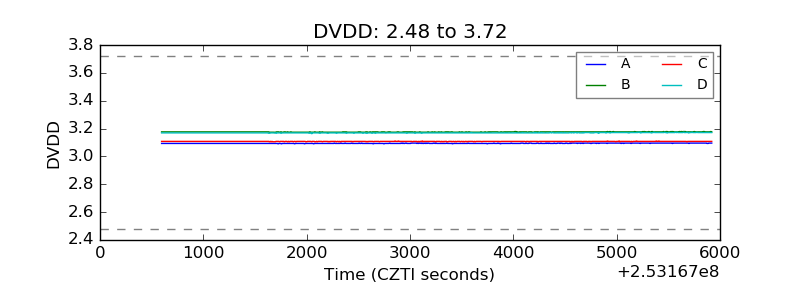 |
| Temperature 1 | 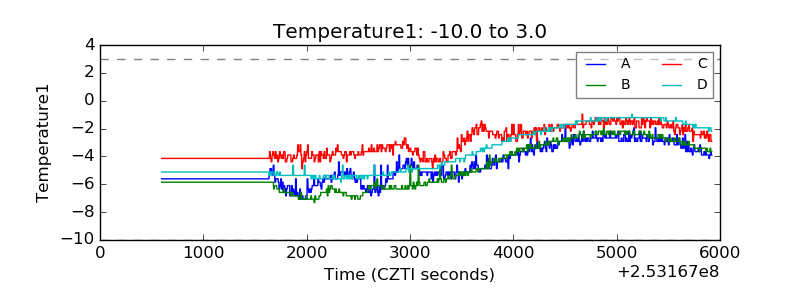 |
| Veto HV Monitor | 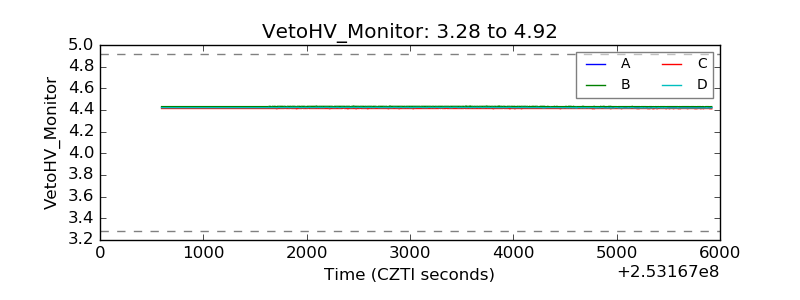 |
| Veto LLD |  |
| Alpha Counter | 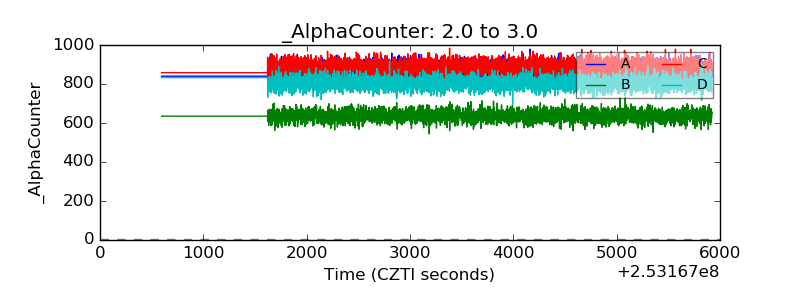 |
| _CPM_Rate | 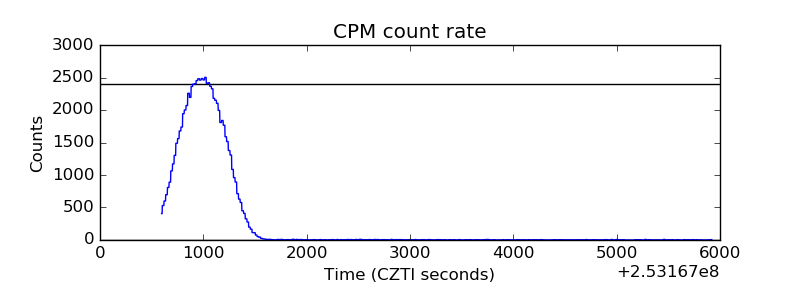 |
| CZT Counter | 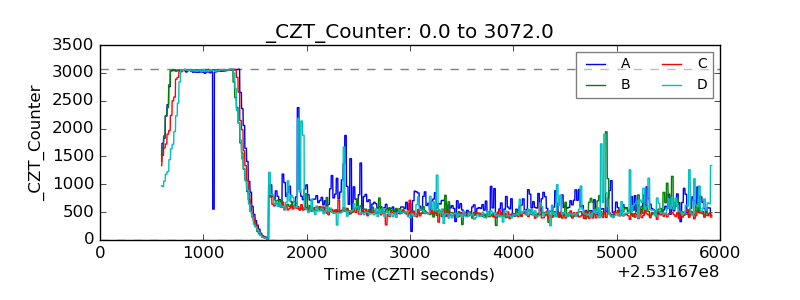 |
| +2.5 Volts monitor |  |
| +5 Volts monitor |  |
| _ROLL_ROT | 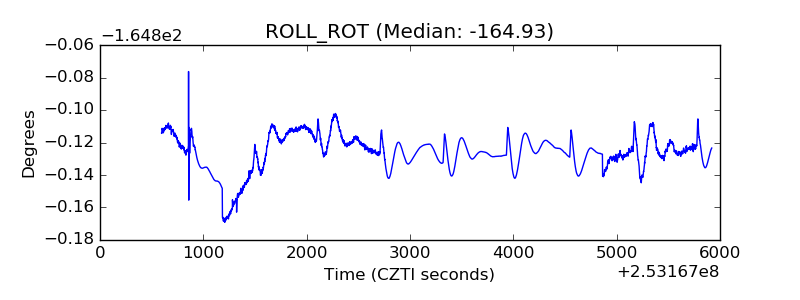 |
| _Roll_DEC | 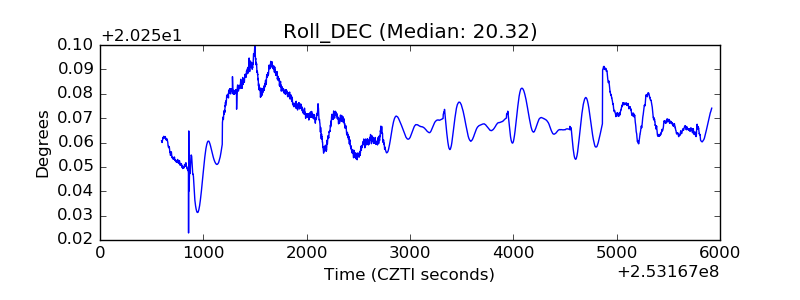 |
| _Roll_RA | 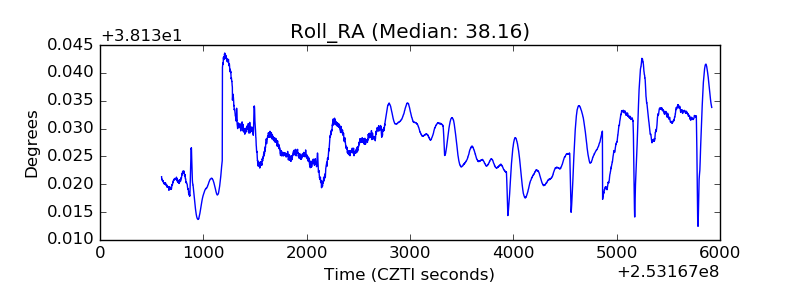 |
| Veto Counter | 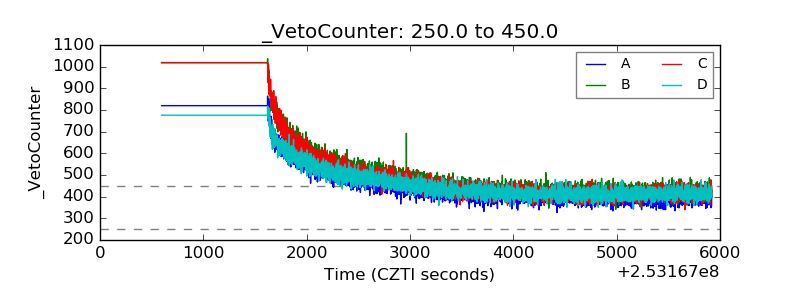 |