| Param | Original file | Final file |
|---|---|---|
| Filename | modeM0/AS1A04_210T01_9000001824_12346cztM0_level2.evt | modeM0/AS1A04_210T01_9000001824_12346cztM0_level2_quad_clean.evt |
| Size (bytes) | 160,470,720 | 5,247,360 |
| Size | 153.0 MB | 5.0 MB |
| Events in quadrant A | 1,063,649 | 9,742 |
| Events in quadrant B | 1,293,171 | 10,139 |
| Events in quadrant C | 847,975 | 10,607 |
| Events in quadrant D | 1,544,001 | 9,282 |
| Mode SS | |||
|---|---|---|---|
| Quadrant | BADHDUFLAG | Total packets | Discarded packets |
| A | 0 | 34 | 0 |
| B | 0 | 34 | 0 |
| C | 0 | 34 | 0 |
| D | 0 | 34 | 0 |
| Mode M9 | |||
|---|---|---|---|
| Quadrant | BADHDUFLAG | Total packets | Discarded packets |
| A | 0 | 13 | 0 |
| B | 0 | 13 | 0 |
| C | 0 | 13 | 0 |
| D | 0 | 13 | 0 |
| Mode M0 | |||
|---|---|---|---|
| Quadrant | BADHDUFLAG | Total packets | Discarded packets |
| A | 0 | 4334 | 2 |
| B | 0 | 4824 | 1 |
| C | 0 | 3429 | 1 |
| D | 0 | 5664 | 1 |
| Quadrant | Total seconds | Saturated seconds | Saturation percentage |
|---|---|---|---|
| A | 1602 | 62 | 3.870162% |
| B | 1602 | 191 | 11.922597% |
| C | 1602 | 25 | 1.560549% |
| D | 1602 | 141 | 8.801498% |
Noise dominated data is calculated using 1-second bins in cleaned event files. If a bin has >2000 counts, and if more than 50% of those come from <1% of pixels, then it is considered to be noise-dominated and hence unusable.
| Quadrant | # 1 sec bins | Bins with >0 counts | Bins with >2000 counts | High rate bins dominated by noise | Noise dominated (total time) | Noise dominated (detector-on time) | Marked lightcurve |
|---|---|---|---|---|---|---|---|
| A | 2903 | 1604 | 0 | 0 | 0.00% | 0.00% | 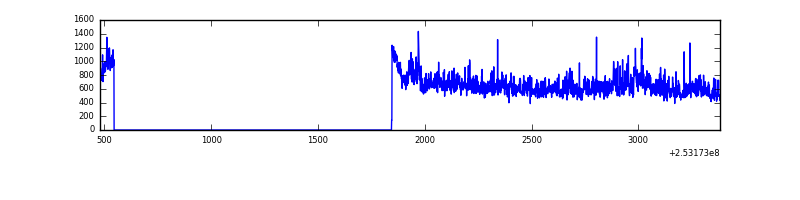 |
| B | 2903 | 1604 | 108 | 108 | 3.72% | 6.73% | 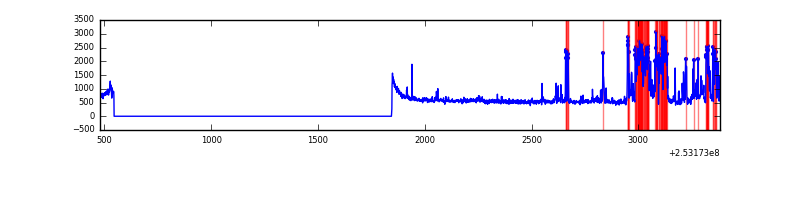 |
| C | 2903 | 1604 | 0 | 0 | 0.00% | 0.00% | 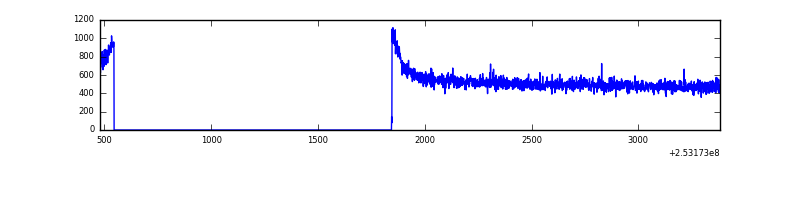 |
| D | 2903 | 1604 | 105 | 105 | 3.62% | 6.55% |  |
Top three noisy pixels from each quadrant. If the there are fewer than three noisy pixels in the level2.evt file, extra rows are filled as -1
| Pixel properties | Quadrant properties | ||||||
|---|---|---|---|---|---|---|---|
| Quadrant | DetID | PixID | Counts | Sigma | Mean | Median | Sigma |
| A | 8 | 15 | 61533 | 1313.52 | 222 | 219 | 46.7 |
| A | 1 | 162 | 48861 | 1042.05 | 222 | 219 | 46.7 |
| A | 1 | 178 | 27152 | 576.98 | 222 | 219 | 46.7 |
| B | 15 | 201 | 287601 | 6750.62 | 219 | 214 | 42.6 |
| B | 4 | 239 | 143959 | 3376.52 | 219 | 214 | 42.6 |
| B | 12 | 111 | 4553 | 101.92 | 219 | 214 | 42.6 |
| C | 13 | 61 | 1636 | 27.62 | 217 | 219 | 51.3 |
| C | 12 | 4 | 519 | 5.85 | 217 | 219 | 51.3 |
| C | 3 | 202 | 518 | 5.83 | 217 | 219 | 51.3 |
| D | 1 | 52 | 433240 | 8530.88 | 204 | 198 | 50.8 |
| D | 13 | 170 | 221624 | 4362.07 | 204 | 198 | 50.8 |
| D | 9 | 85 | 69855 | 1372.23 | 204 | 198 | 50.8 |
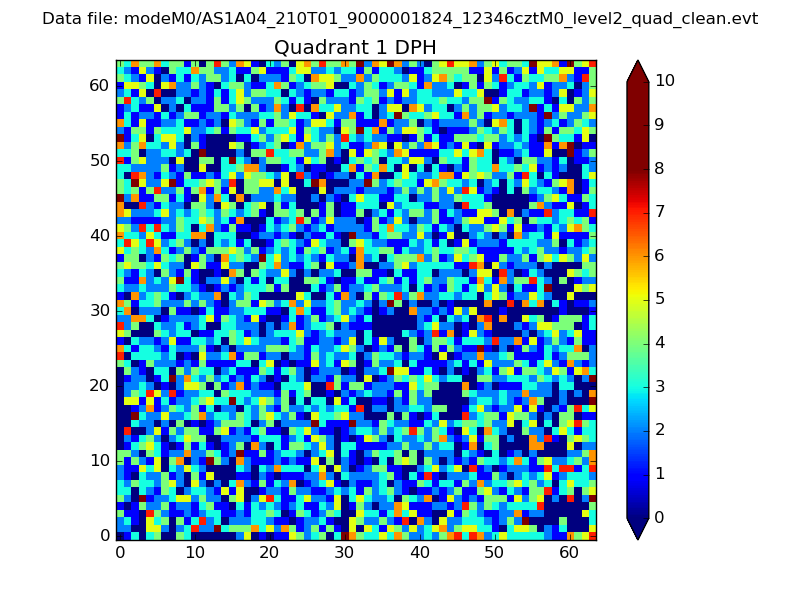
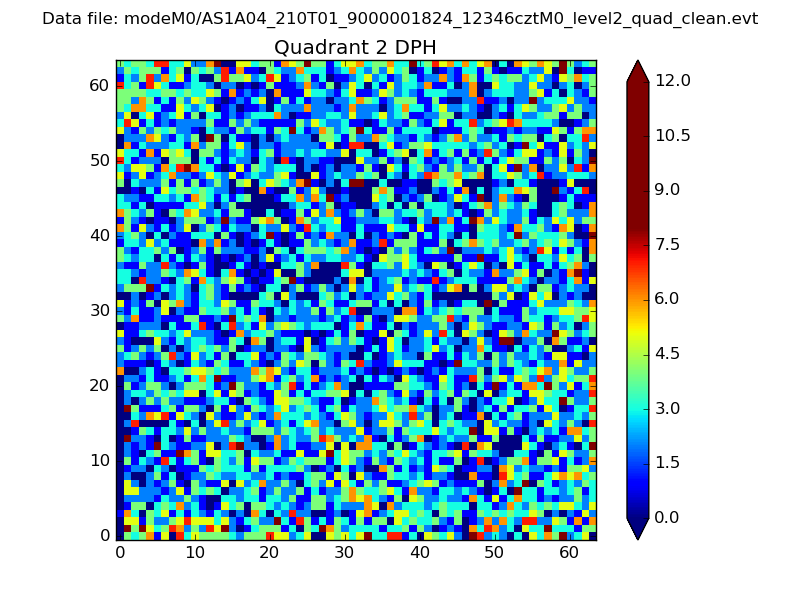
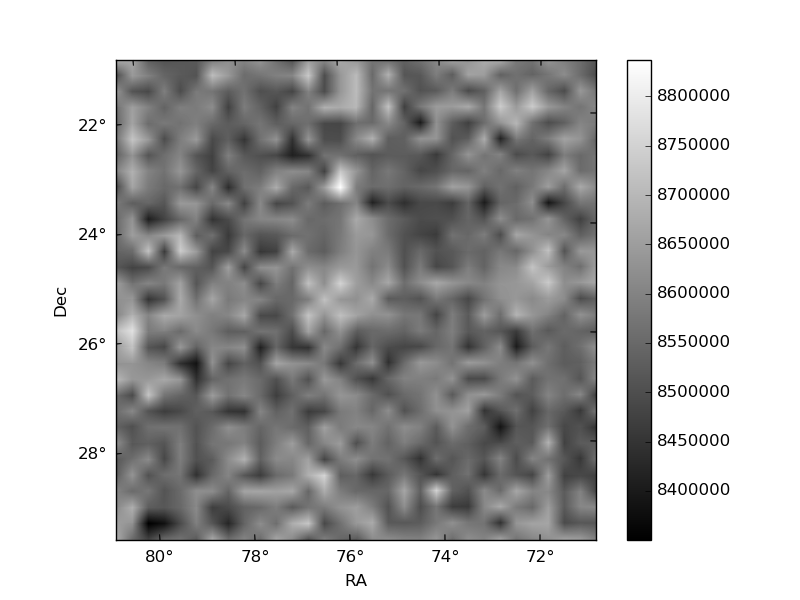
Histogram calculated using DETX and DETY for each event in the final _common_clean file
| Quadrant A | 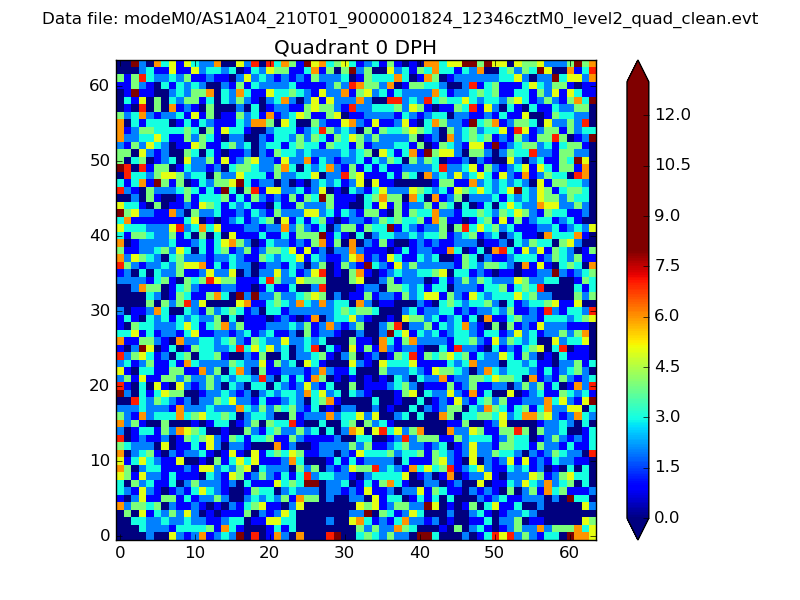 |
 |
Quadrant B |
|---|---|---|---|
| Quadrant D | 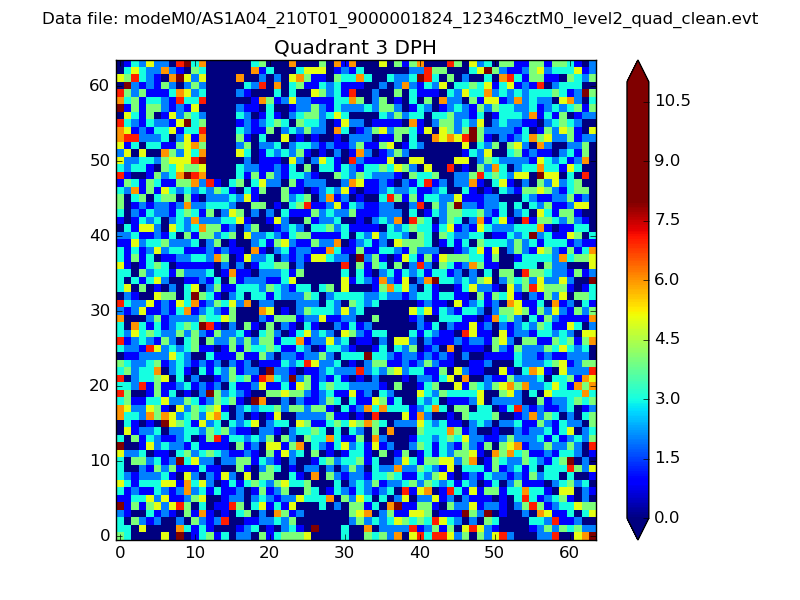 |
 |
Quadrant C |
| Plot type | Count rate plots | Images |
|---|---|---|
| Comparison with Poisson distribution Blue bars denote a histogram of data divided into 1 sec bins. Red curve is a Poisson curve with rate = median count rate of data. |
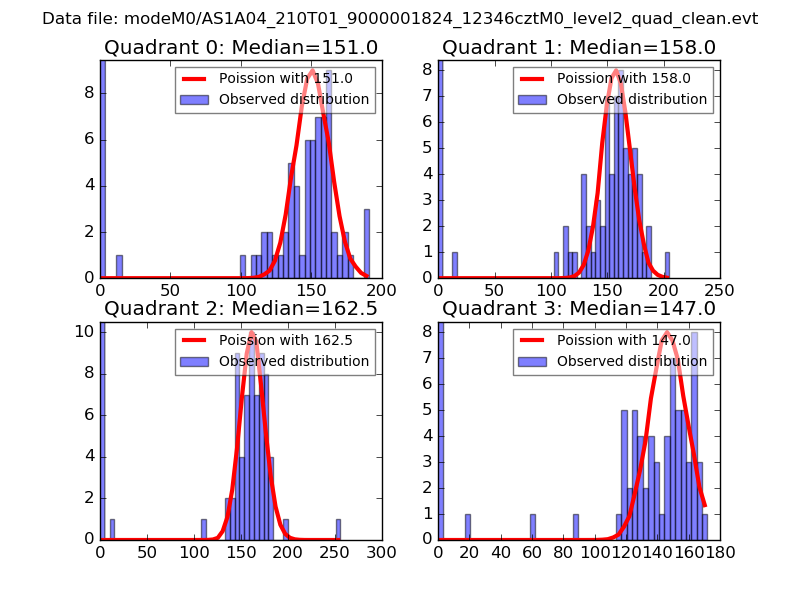 |
 |
| Quadrant-wise count rates Data is divided into 100 sec bins |
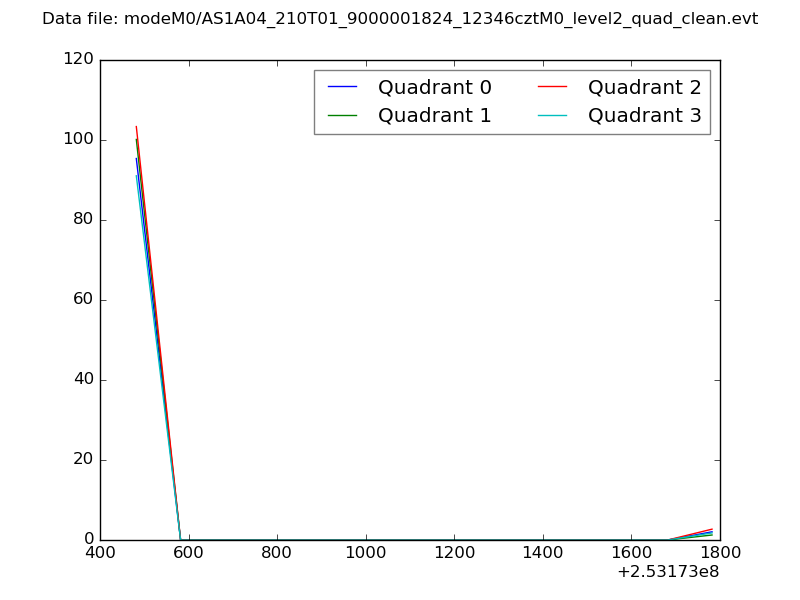 |
|
| Module-wise count rates for Quadrant A Data is divided into 100 sec bins |
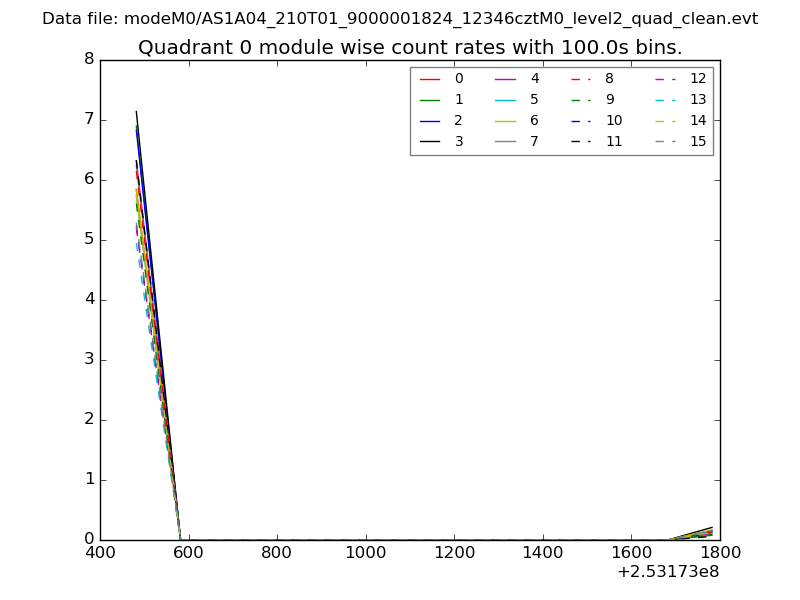 |
 |
| Module-wise count rates for Quadrant B Data is divided into 100 sec bins |
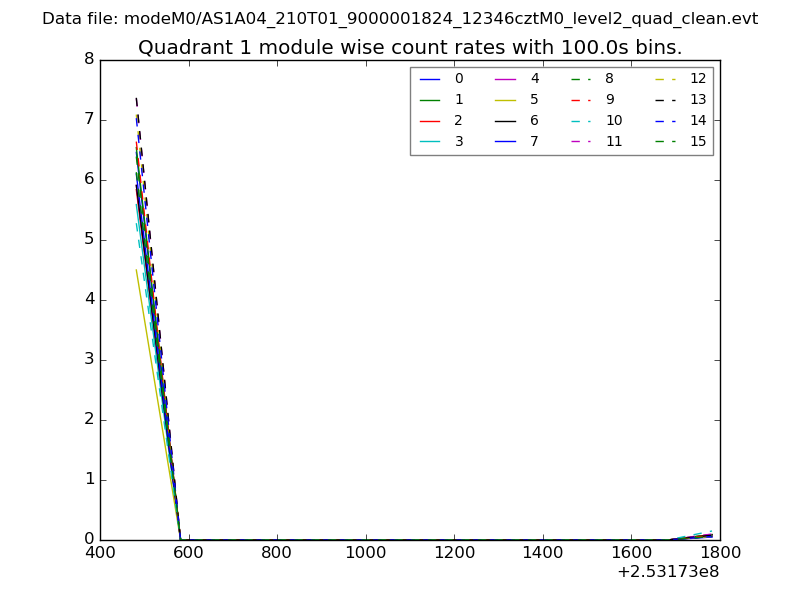 |
 |
| Module-wise count rates for Quadrant C Data is divided into 100 sec bins |
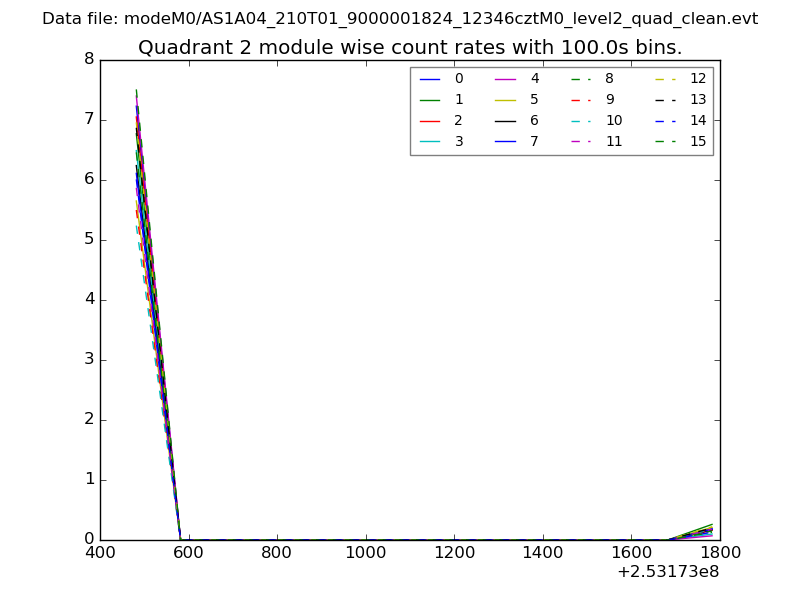 |
 |
| Module-wise count rates for Quadrant D Data is divided into 100 sec bins |
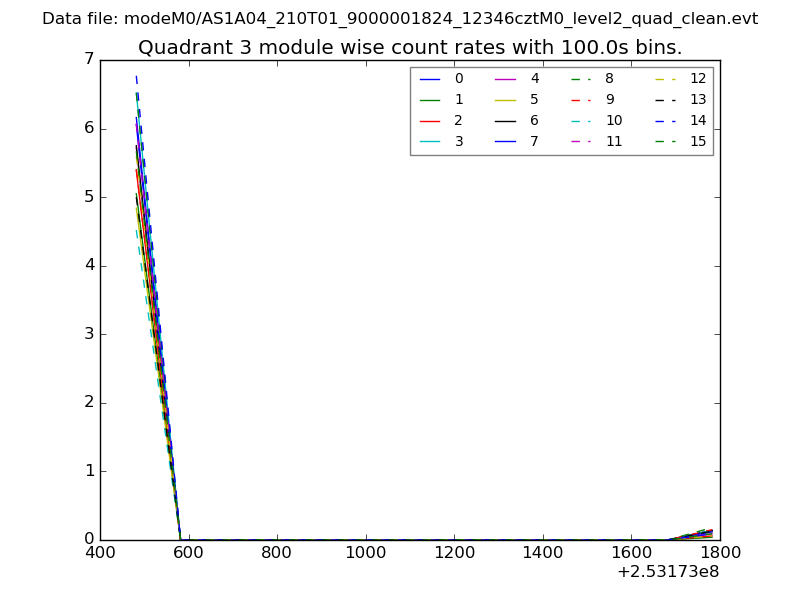 |
 |
| Parameter | Plot |
|---|---|
| CZT HV Monitor | 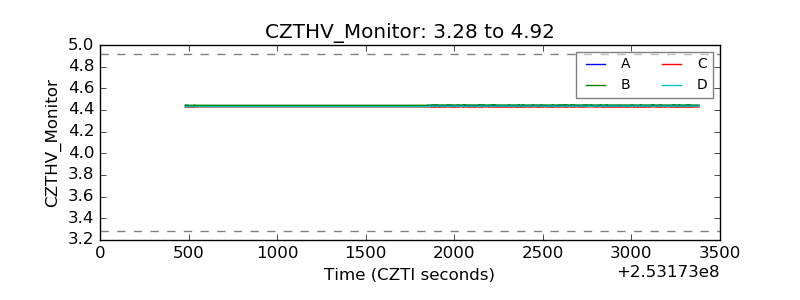 |
| D_VDD | 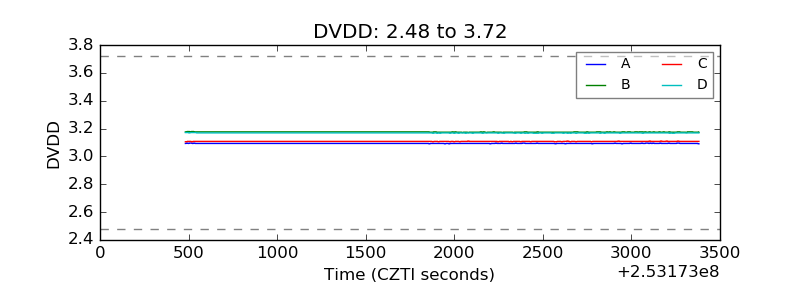 |
| Temperature 1 | 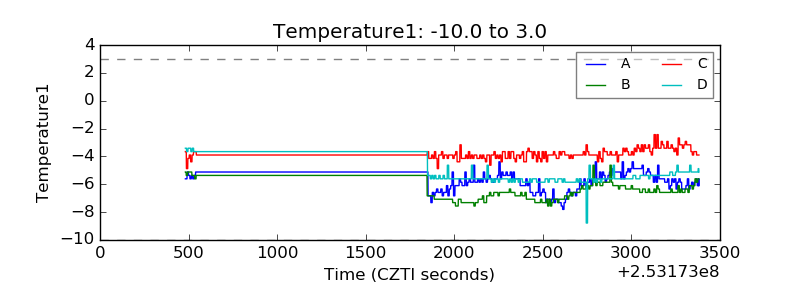 |
| Veto HV Monitor | 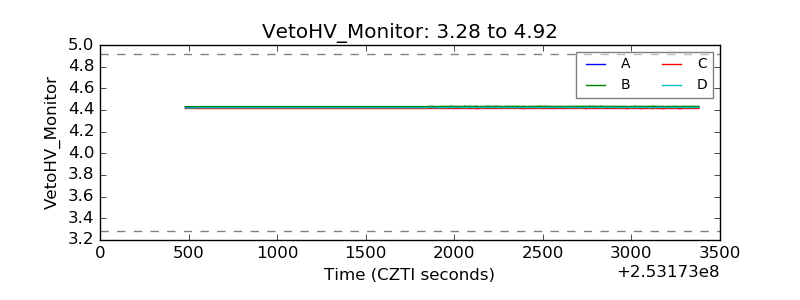 |
| Veto LLD | 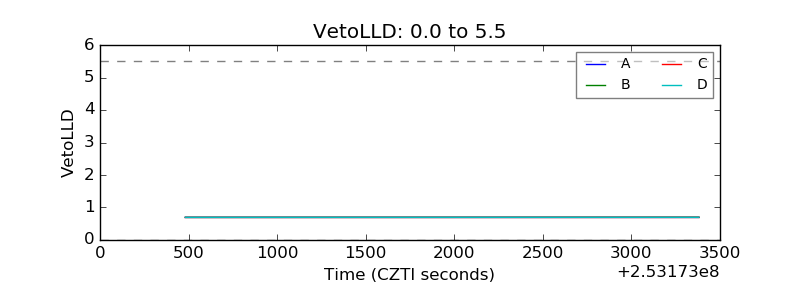 |
| Alpha Counter | 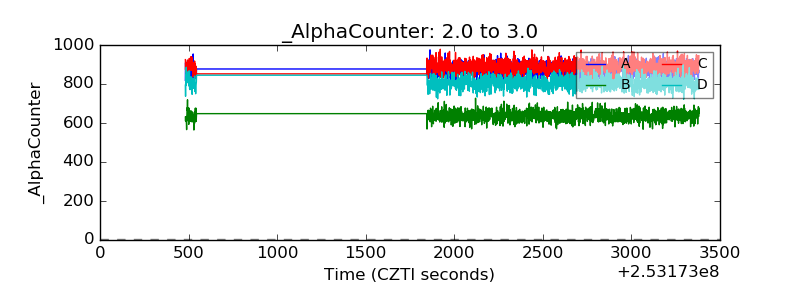 |
| _CPM_Rate | 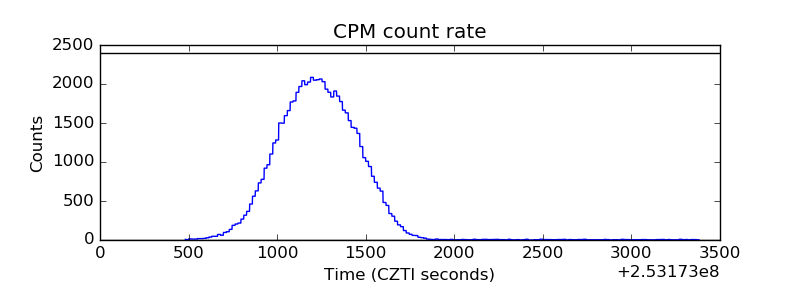 |
| CZT Counter | 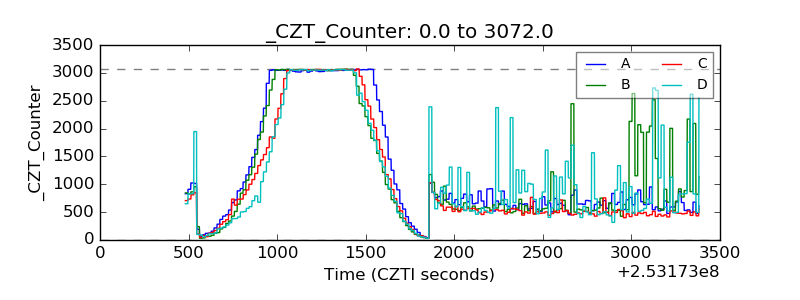 |
| +2.5 Volts monitor |  |
| +5 Volts monitor | 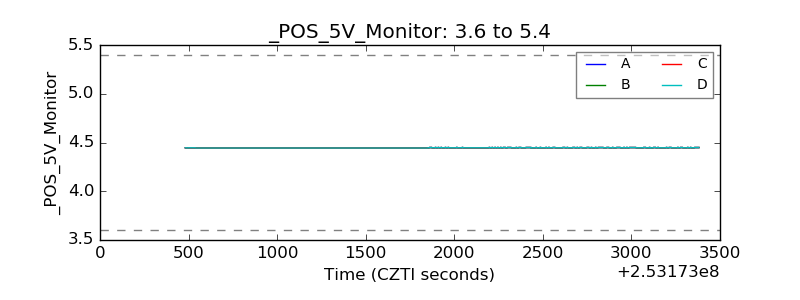 |
| _ROLL_ROT | 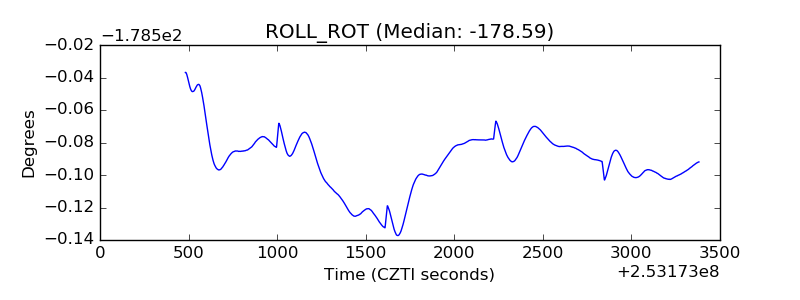 |
| _Roll_DEC | 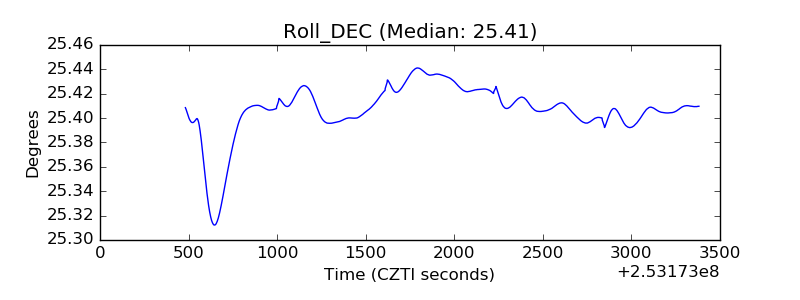 |
| _Roll_RA | 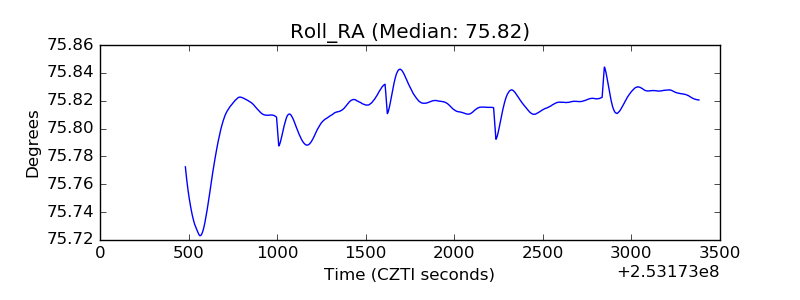 |
| Veto Counter | 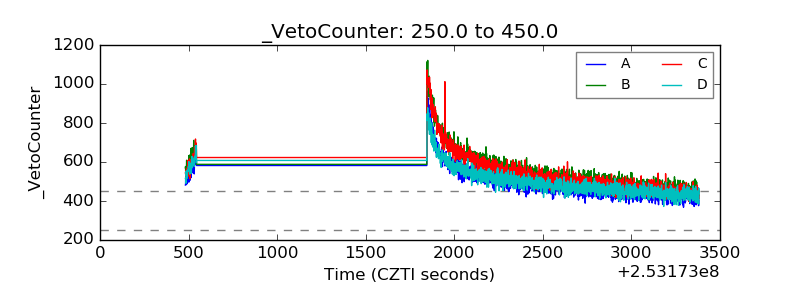 |