| Param | Original file | Final file |
|---|---|---|
| Filename | modeM0/AS1A04_210T01_9000001824_12349cztM0_level2.evt | modeM0/AS1A04_210T01_9000001824_12349cztM0_level2_quad_clean.evt |
| Size (bytes) | 440,562,240 | 82,872,000 |
| Size | 420.2 MB | 79.0 MB |
| Events in quadrant A | 3,224,730 | 533,181 |
| Events in quadrant B | 3,060,413 | 543,603 |
| Events in quadrant C | 2,671,864 | 538,477 |
| Events in quadrant D | 4,002,454 | 500,287 |
| Mode SS | |||
|---|---|---|---|
| Quadrant | BADHDUFLAG | Total packets | Discarded packets |
| A | 0 | 114 | 0 |
| B | 0 | 114 | 0 |
| C | 0 | 114 | 0 |
| D | 0 | 114 | 0 |
| Mode M9 | |||
|---|---|---|---|
| Quadrant | BADHDUFLAG | Total packets | Discarded packets |
| A | 0 | 11 | 0 |
| B | 0 | 11 | 0 |
| C | 0 | 11 | 0 |
| D | 0 | 11 | 0 |
| Mode M0 | |||
|---|---|---|---|
| Quadrant | BADHDUFLAG | Total packets | Discarded packets |
| A | 0 | 13144 | 1 |
| B | 0 | 12738 | 1 |
| C | 0 | 11753 | 1 |
| D | 0 | 15593 | 1 |
| Quadrant | Total seconds | Saturated seconds | Saturation percentage |
|---|---|---|---|
| A | 5634 | 159 | 2.822151% |
| B | 5634 | 233 | 4.135605% |
| C | 5634 | 87 | 1.544196% |
| D | 5634 | 308 | 5.466809% |
Noise dominated data is calculated using 1-second bins in cleaned event files. If a bin has >2000 counts, and if more than 50% of those come from <1% of pixels, then it is considered to be noise-dominated and hence unusable.
| Quadrant | # 1 sec bins | Bins with >0 counts | Bins with >2000 counts | High rate bins dominated by noise | Noise dominated (total time) | Noise dominated (detector-on time) | Marked lightcurve |
|---|---|---|---|---|---|---|---|
| A | 6690 | 5636 | 1 | 1 | 0.01% | 0.02% | 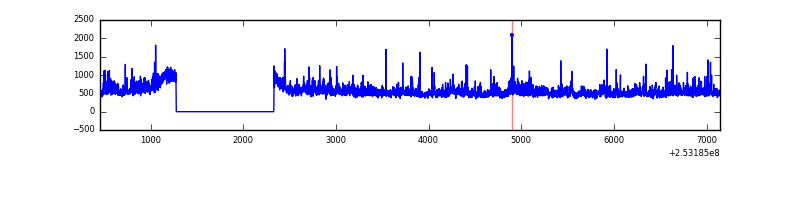 |
| B | 6690 | 5636 | 35 | 35 | 0.52% | 0.62% | 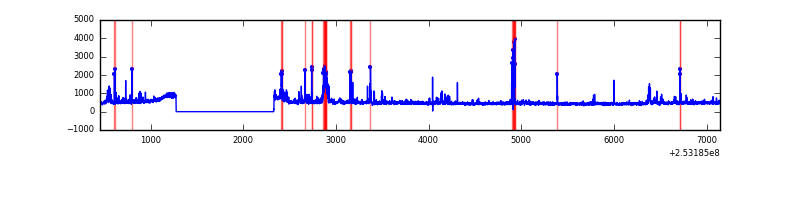 |
| C | 6690 | 5636 | 0 | 0 | 0.00% | 0.00% | 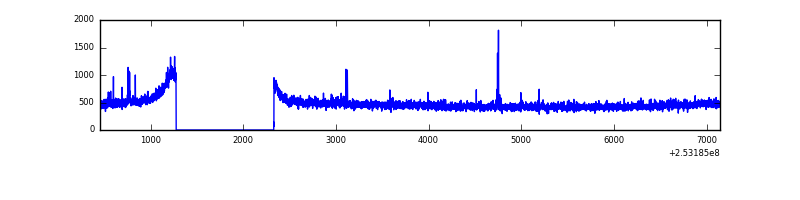 |
| D | 6690 | 5636 | 202 | 202 | 3.02% | 3.58% | 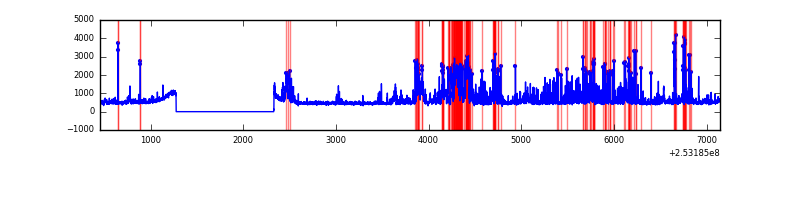 |
Top three noisy pixels from each quadrant. If the there are fewer than three noisy pixels in the level2.evt file, extra rows are filled as -1
| Pixel properties | Quadrant properties | ||||||
|---|---|---|---|---|---|---|---|
| Quadrant | DetID | PixID | Counts | Sigma | Mean | Median | Sigma |
| A | 13 | 251 | 213834 | 1520.49 | 690 | 674 | 140.2 |
| A | 1 | 162 | 113374 | 803.9 | 690 | 674 | 140.2 |
| A | 8 | 15 | 72269 | 510.69 | 690 | 674 | 140.2 |
| B | 4 | 239 | 248672 | 1866.25 | 690 | 674 | 132.9 |
| B | 3 | 64 | 35536 | 262.35 | 690 | 674 | 132.9 |
| B | 0 | 230 | 33680 | 248.38 | 690 | 674 | 132.9 |
| C | 15 | 208 | 22631 | 139.28 | 674 | 678 | 157.6 |
| C | 8 | 128 | 9441 | 55.6 | 674 | 678 | 157.6 |
| C | 8 | 112 | 5175 | 28.53 | 674 | 678 | 157.6 |
| D | 1 | 52 | 1244631 | 7700.43 | 663 | 645 | 161.5 |
| D | 13 | 104 | 63352 | 388.16 | 663 | 645 | 161.5 |
| D | 14 | 34 | 54911 | 335.91 | 663 | 645 | 161.5 |
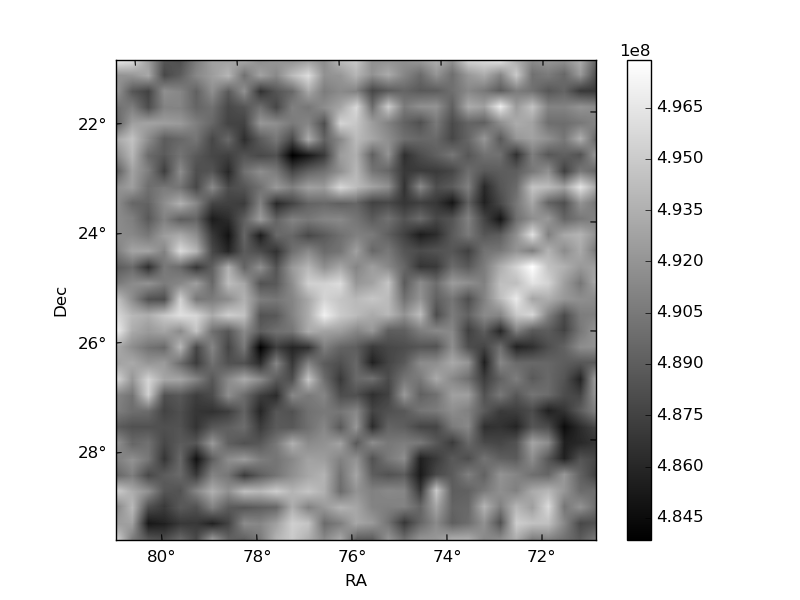
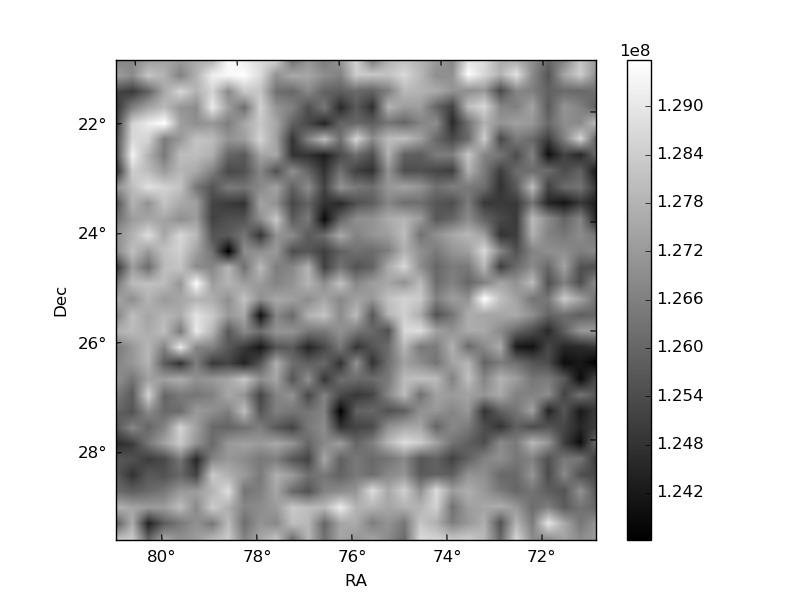
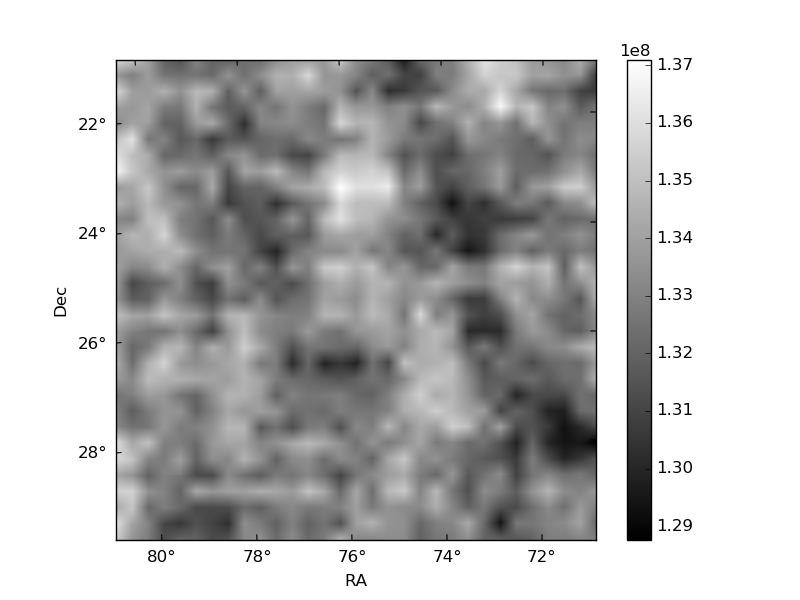
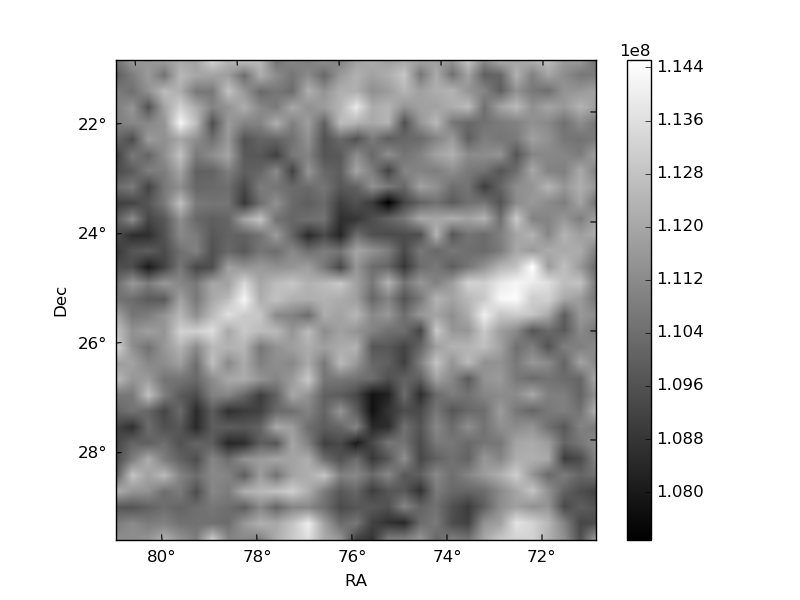
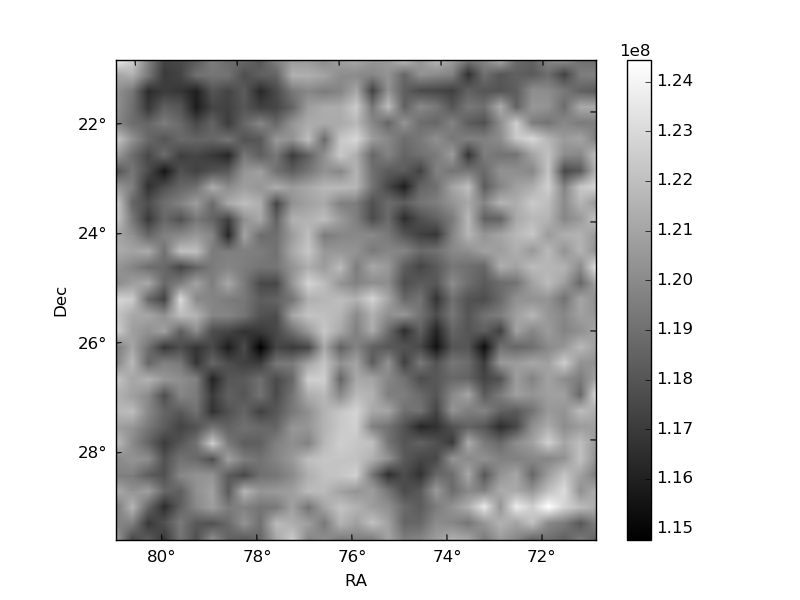
Histogram calculated using DETX and DETY for each event in the final _common_clean file
| Quadrant A | 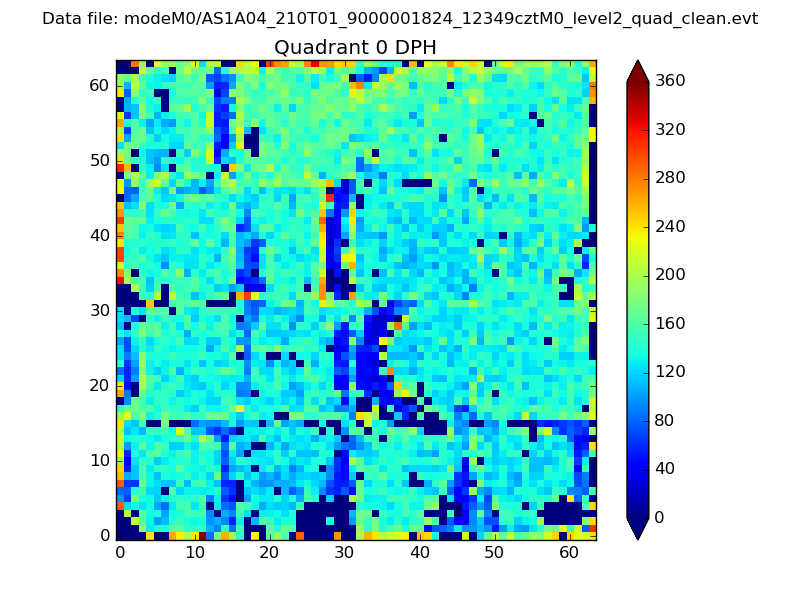 |
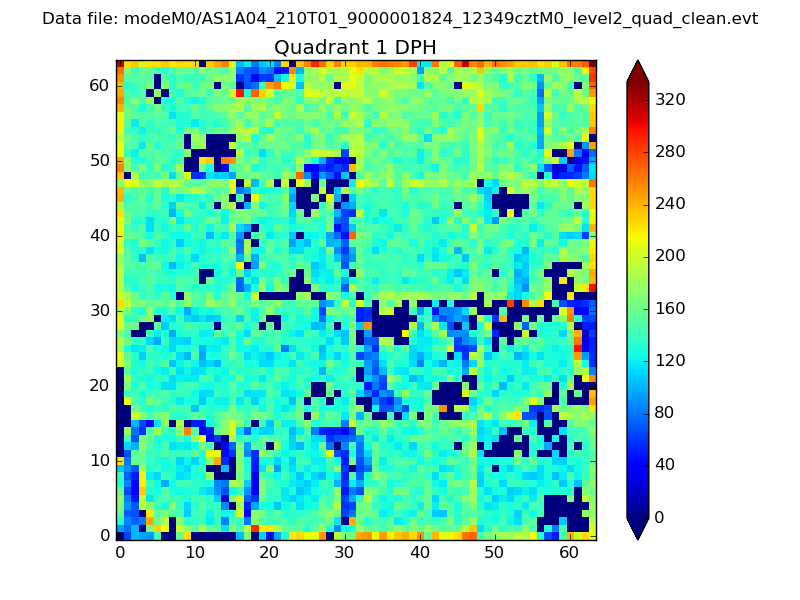 |
Quadrant B |
|---|---|---|---|
| Quadrant D | 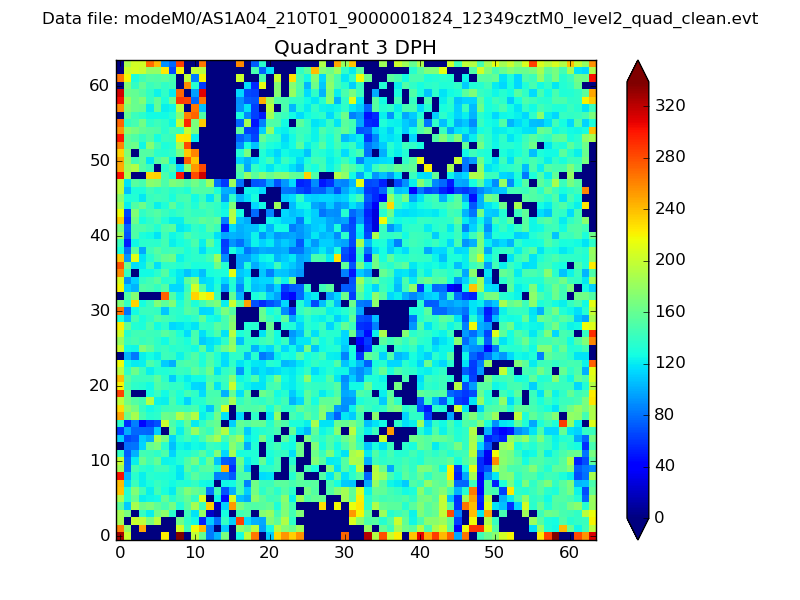 |
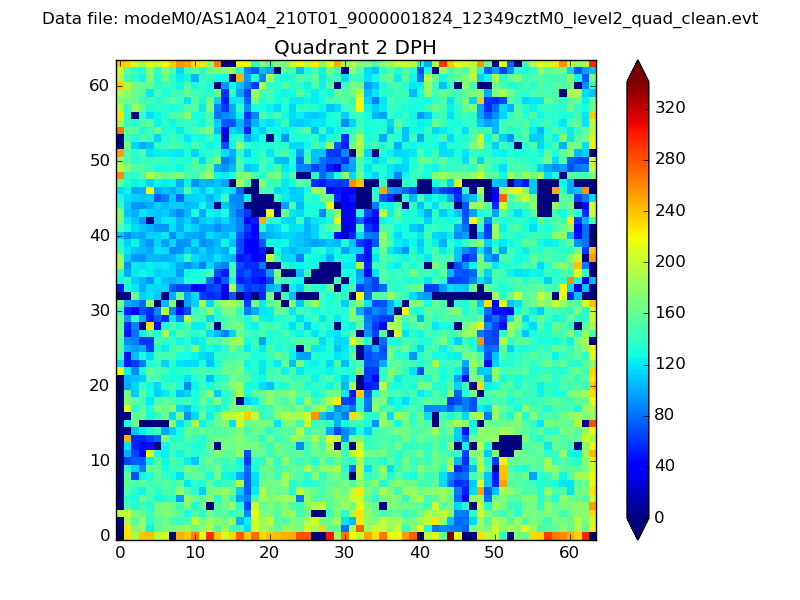 |
Quadrant C |
| Plot type | Count rate plots | Images |
|---|---|---|
| Comparison with Poisson distribution Blue bars denote a histogram of data divided into 1 sec bins. Red curve is a Poisson curve with rate = median count rate of data. |
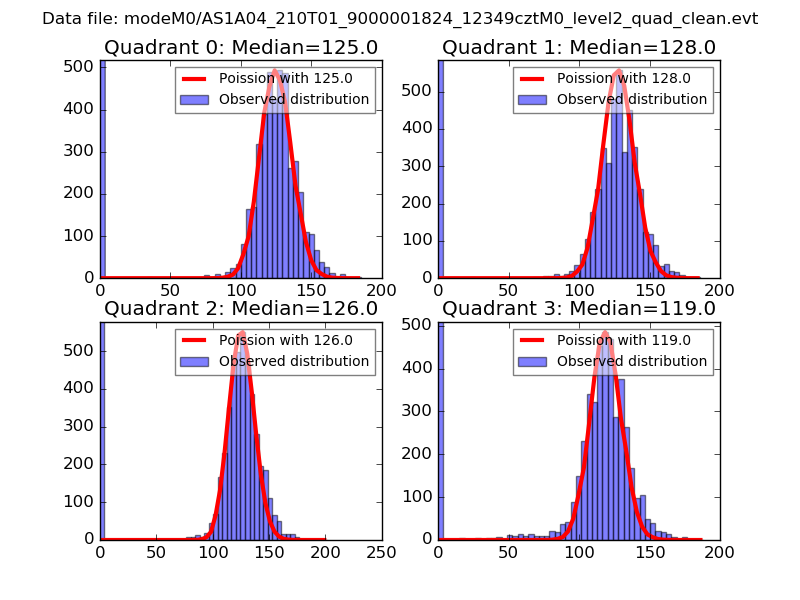 |
 |
| Quadrant-wise count rates Data is divided into 100 sec bins |
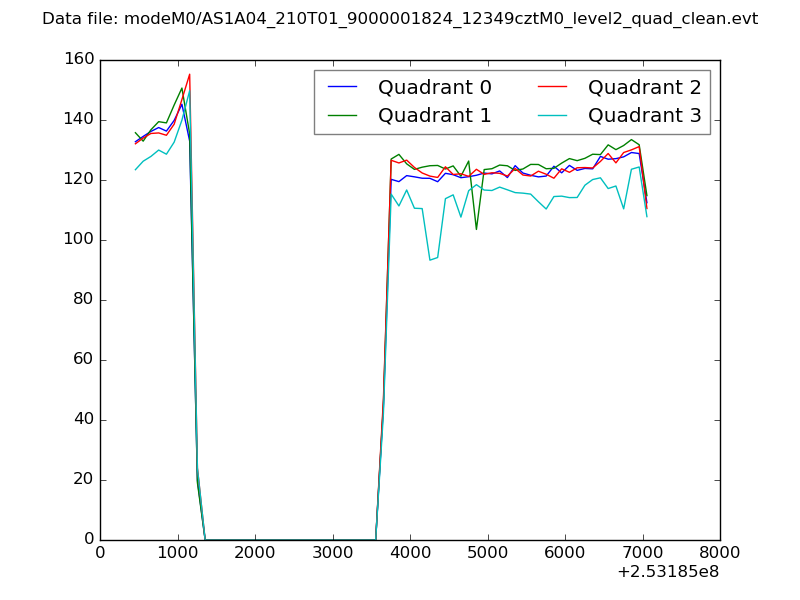 |
|
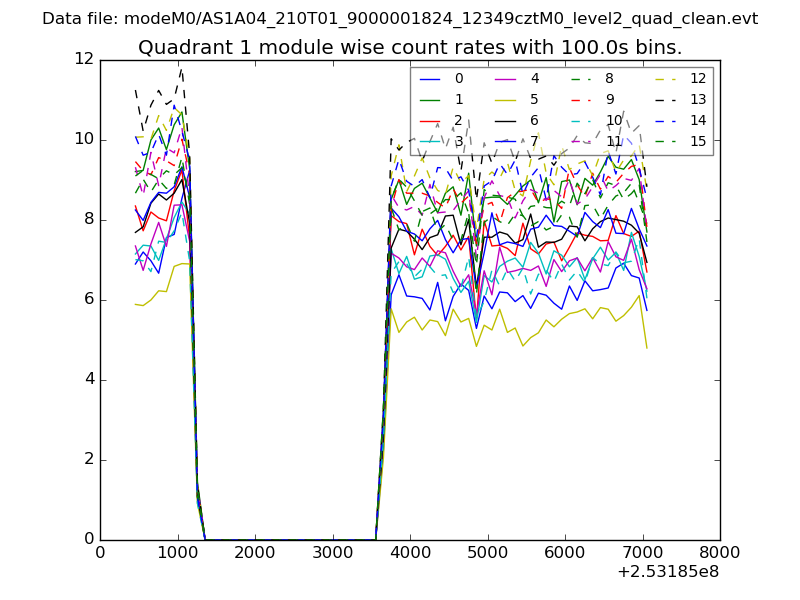
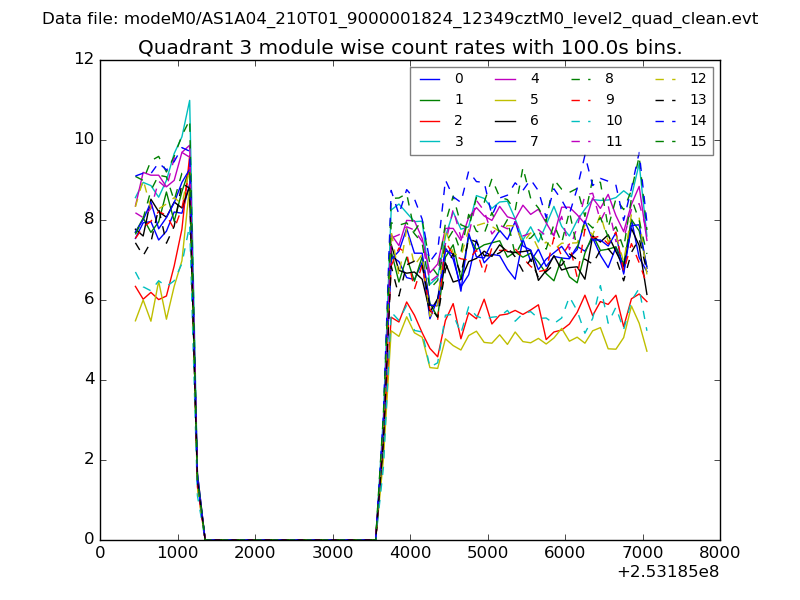
| Module-wise count rates for Quadrant A Data is divided into 100 sec bins |
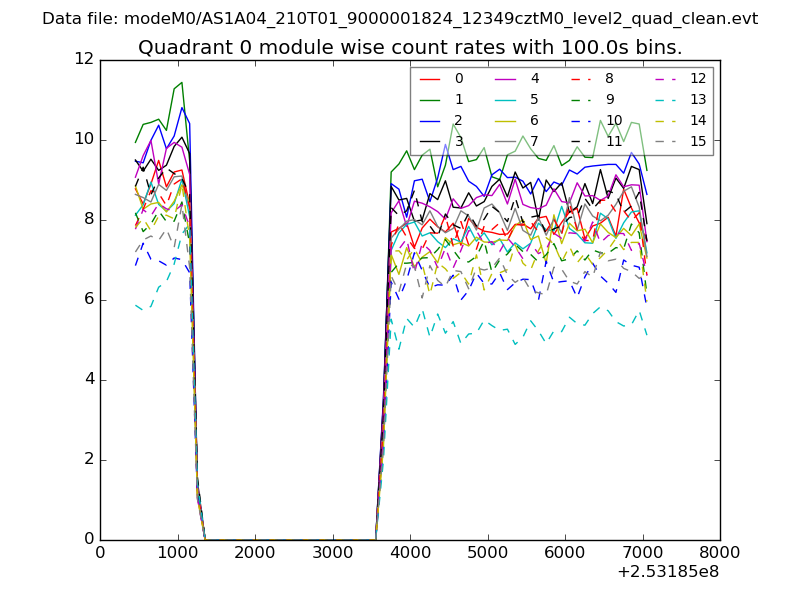 |
 |
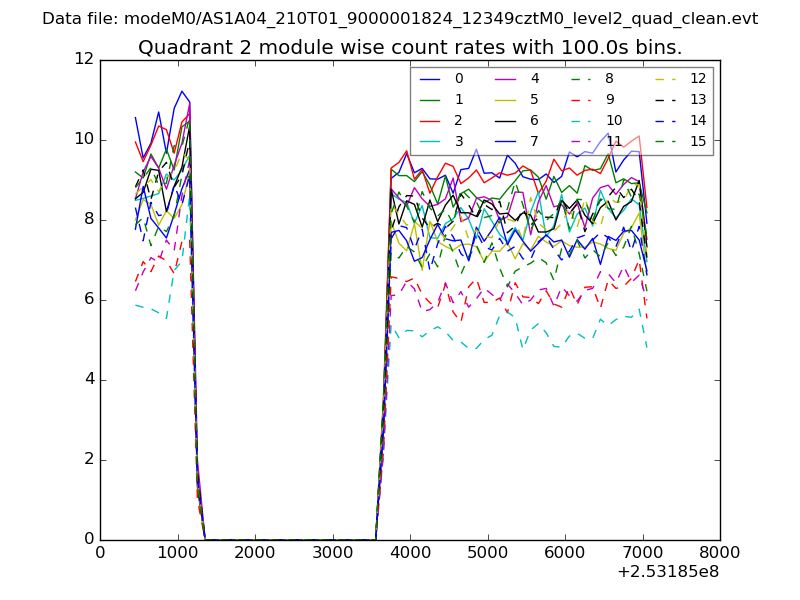
| Module-wise count rates for Quadrant B Data is divided into 100 sec bins |
 |
 |
| Module-wise count rates for Quadrant C Data is divided into 100 sec bins |
 |
 |
| Module-wise count rates for Quadrant D Data is divided into 100 sec bins |
 |
 |
| Parameter | Plot |
|---|---|
| CZT HV Monitor | 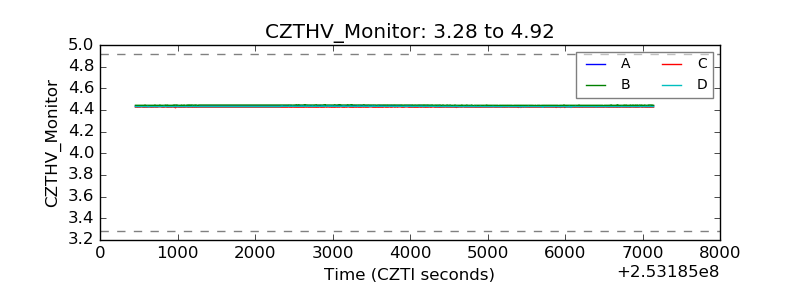 |
| D_VDD | 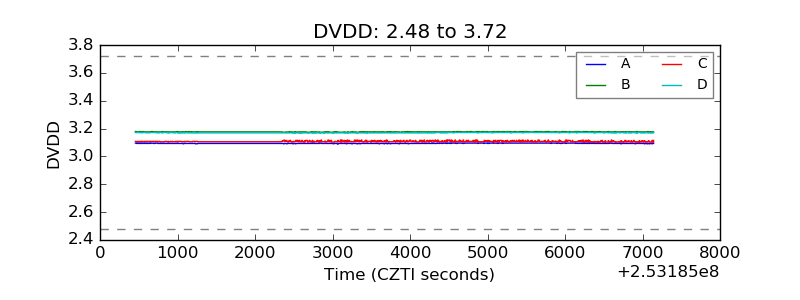 |
| Temperature 1 | 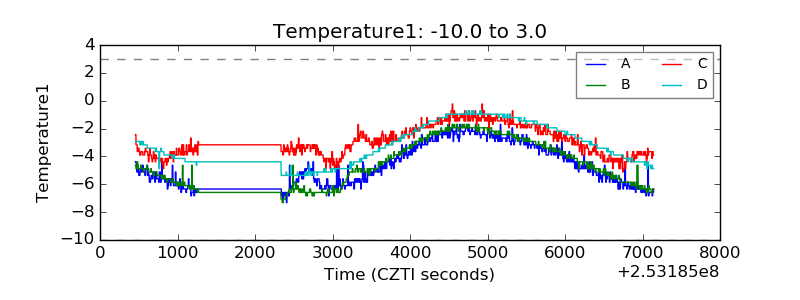 |
| Veto HV Monitor | 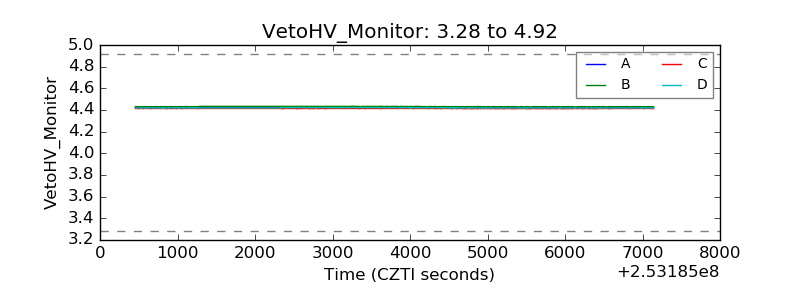 |
| Veto LLD | 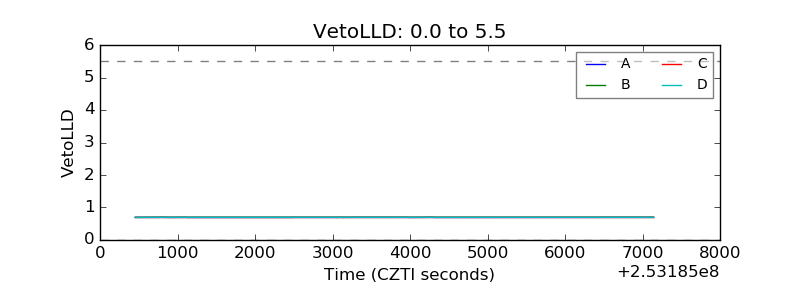 |
| Alpha Counter | 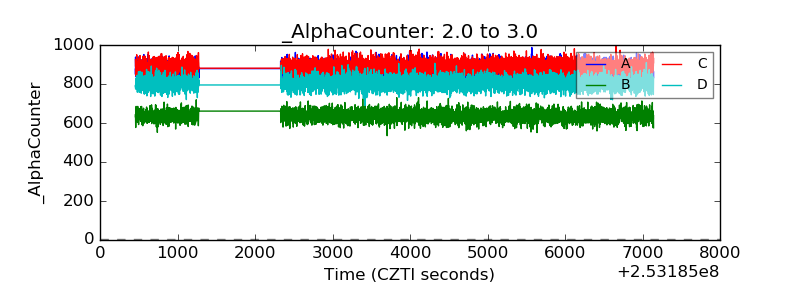 |
| _CPM_Rate | 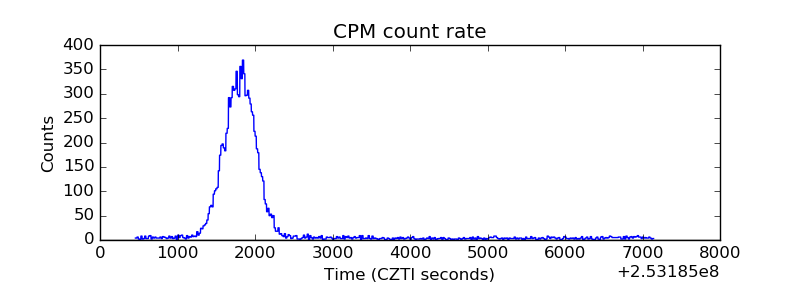 |
| CZT Counter | 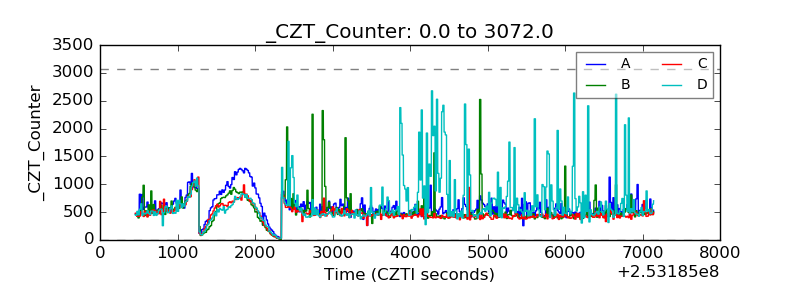 |
| +2.5 Volts monitor | 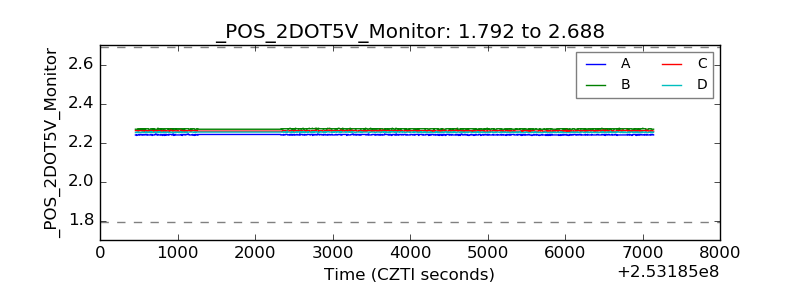 |
| +5 Volts monitor |  |
| _ROLL_ROT | 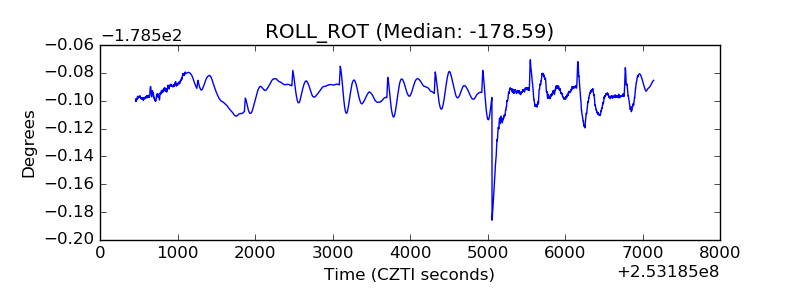 |
| _Roll_DEC | 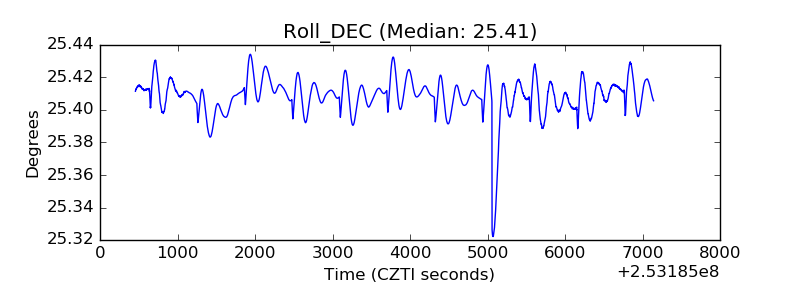 |
| _Roll_RA | 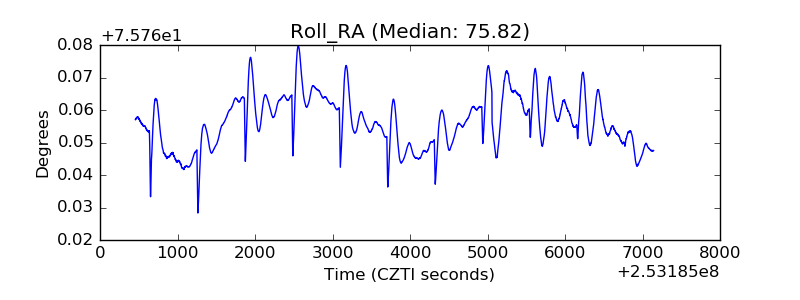 |
| Veto Counter | 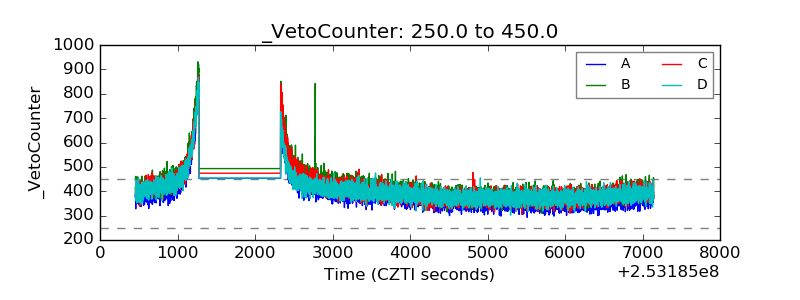 |